Tag: Bitcoin

  • Bitcoin Rises as Markets Digest Inflation Data Ahead of Fed Rate Decision

    Bitcoin Rises as Markets Digest Inflation Data Ahead of Fed Rate Decision

    U.S. Inflation Data Delivers Mixed Signals as Core CPI Runs Hot

    The latest Consumer Price Index (CPI) report from the Bureau of Labor Statistics gave markets a mixed bag on Friday. Headline inflation rose 3.4% year-over-year and 0.4% month-over-month, both matching consensus estimates and matching July’s annual pace. However, core CPI—which excludes food and energy—told a more nuanced story. The annual core rate cooled to 2.4% from 2.5%, its lowest level since 2021, but the monthly core reading came in at 0.3%, exceeding the 0.2% analysts had forecast. That hotter-than-expected monthly core figure is the detail markets zeroed in on as the Federal Reserve approaches its September 15-16 policy meeting.

    Fed Rate Hike Probabilities Tick Up

    The report lands five days before the Fed’s next decision, the last major data point Chair Kevin Warsh’s committee will see before voting. Warsh used his first Jackson Hole keynote to say the Fed still has “work to do” on inflation. Three regional Fed presidents already dissented in favor of a hike at the July meeting, so a move would not be entirely unexpected. CME FedWatch, which tracks probabilities implied by 30-day Fed funds futures, puts the odds of a 25-basis-point hike at roughly 69%. Prediction markets are slightly more cautious: Polymarket prices the same outcome at 62%, and Myriad—the platform run by Decrypt’s parent company Dastan—has it at 61%.

    Crypto Market Rallies Despite Initial Dip

    Bitcoin initially dipped on the news but quickly reversed, climbing back toward $79,000 as the broader market digested the implications for interest rates. Ethereum led major assets higher, surging 7.48% on the day to reclaim $2,611, while Solana rose 4.53% back above $100. Zcash stood out across the top 10, gaining 23.09% over the past week alongside a 4.71% daily gain. Total crypto market capitalization climbed back near $2.7 trillion.

    Sentiment swung hard with the price action. The Crypto Fear & Greed Index, which had slipped to 56 after Thursday’s hot producer-price report, jumped back to 73—firmly in “greed” territory—while the Altcoin Season Index sits at 38, indicating Bitcoin still dominates the ecosystem as traders lack enough risk appetite for a full altcoin rotation. Spot Bitcoin ETFs continue to show a net outflow of roughly $330.5 million on the day, a reminder that this rally hasn’t yet pulled fresh institutional money off the sidelines.

    Derivatives activity climbed alongside the rally. Open interest across crypto futures rose 1.52% to $429.99 billion, with 24-hour trading volume up 2.27% to $877.11 billion. The volatile session triggered $897.09 million in liquidations, split between $493.85 million in long positions and $403.24 million in shorts.

    Bitcoin Price Analysis: Golden Cross Forms on Daily Chart

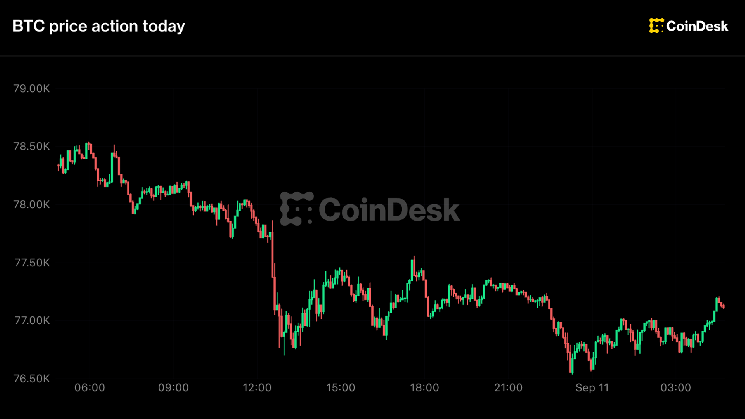
    Bitcoin opened Friday at $76,529 and briefly dipped toward the day’s $76,040 low in the minutes after the CPI print—an initial hawkish reaction before the market reversed hard. Bulls have since taken over, pushing BTC as high as $79,837 through the session. The asset now trades near $79,007, a 3.24% gain on the day and nearing the psychologically significant $80K mark.

    Bitcoin price data. Image: Tradingview

    Golden Cross Signals Medium-Term Trend Shift

    The chart’s biggest structural shift is the exponential moving average (EMA) crossover. Bitcoin’s 50-day EMA has now crossed above its 200-day EMA, forming a golden cross—a setup traders read as confirmation that the medium-term trend has flipped bullish rather than a warning of a coming reversal, which the opposite death cross would signal. The crossover just happened, meaning it is not technically confirmed yet; there isn’t yet a significant gap between both averages, so traders would be wise to keep their champagne in the refrigerator for a couple of days.

    Momentum Indicators Support Upside

    The Relative Strength Index (RSI) sits at 59.7—bullish territory and well below the 70 reading that would flag the move as overbought. The Average Directional Index (ADX), which measures trend strength regardless of direction, reads in the 40s, comfortably above the 25 threshold that separates a real trend from noise, with the DI+ line above DI- confirming buyers remain in control.

    Key Levels to Watch Ahead of Fed Decision

    The key zone to watch sits below current prices: a Fibonacci retracement drawn off the summer’s $68,858 low to the $82,281 high hit in late August places Bitcoin’s golden zone—the retracement band bulls need to defend—between $73,986 and $75,569. Above that, the $82,281 high from late August remains the level that needs to break for the rally to extend before the Fed’s rate decision on Wednesday at 2:00 PM ET.

    Myriad: $BTC next move: Pump to $84K or Dump to $55K? Click to make your prediction.

    Disclaimer: The views and opinions expressed by the author are for informational purposes only and do not constitute financial, investment, or other advice.


  • Grayscale Research Head Predicts Crypto ‘Speed Bump’ Scenario

    Grayscale Research Head Predicts Crypto ‘Speed Bump’ Scenario

    Grayscale’s Head of Research, Zach Pandl, suggests the latest U.S. inflation data could present a temporary speed bump for cryptocurrency markets. The August Consumer Price Index (CPI) report revealed hotter-than-expected headline inflation, increasing the probability of another Federal Reserve rate hike.

    August CPI Details: Headline Heat, Core Cooling

    The Bureau of Labor Statistics reported that headline CPI rose 0.4% month-over-month, while the annual rate held steady at 3.4%. However, the annual core inflation rate—which excludes volatile food and energy prices—eased to 2.4%. This figure aligns with economist forecasts and marks the lowest level since 2021.

    Pandl: High-ish core CPI means decent chance of Fed rate hike

    Reacting to the data on X (formerly Twitter), Pandl highlighted the mixed signals. High-ish core CPI means decent chance of Fed rate hike,” he wrote on X. “This is a ‘speed bump’ scenario for crypto.

    Despite the heightened rate-hike expectations, Pandl does not anticipate a severe correction in digital assets. He argued that any near-term weakness would likely be limited, potentially offering a secondary entry point for investors who missed August’s rally. In my opinion, dips will be shallow and will create an opportunity for allocators that missed the August price jump, the Grayscale executive said.

    Market Probability Spikes; Economists Weigh In

    Financial markets reacted swiftly to the report. Traders briefly priced in roughly an 85% probability of a rate hike, with Bianco Research founder Jim Bianco noting the probability climbed to about 90%. Economist Robin Brooks characterized the report as unfavorable for the central bank, arguing the stronger reading could push policymakers toward tightening.

    Tighter monetary policy typically raises borrowing costs, a dynamic historically bearish for risk assets like Bitcoin (BTC).

    Long-Term Disinflation Trend Intact

    Several analysts emphasized that the broader disinflationary trajectory remains intact. The core CPI annual rate continues to march toward the Fed’s 2% target. Analyst James E. Thorne opined that the 2.4% annual reading serves as evidence that inflation remains on a longer-term downward trajectory. Geiger Capital similarly noted that core inflation has now reached its lowest level since 2021.

    As of the latest data, Bitcoin is trading at approximately $78,772, according to CoinGecko.

  • Bitcoin Flashes Unprecedented 17-Year On-Chain Anomaly

    Bitcoin Flashes Unprecedented 17-Year On-Chain Anomaly

    Bitcoin On-Chain Analyst Flags Unprecedented HODL Wave Anomaly Suggesting Single Whale Accumulation

    Prominent on-chain analyst Willy Woo has identified an unusual signal in Bitcoin’s HODL Wave data that appears to have no precedent across nearly two decades of available history. The anomaly centers on how Bitcoin was accumulated around the recent market bottom, with Woo suggesting the buying pattern points to a single large entity rather than broad retail participation.

    Analyst Highlights “Anomaly” in 17.5 Years of HODL Wave Data

    In a post on X, Woo emphasized the rarity of the current data pattern:

    We have an ANOMALY.Whoever bought the bottom did it slowly. Possibly even a single whale.When it’s many investors, you expect to see spikes in buying activity. That’s happened every time across 17.5 years of Hodl Wave data except now. pic.twitter.com/1cU23USB3R

    According to Woo, the absence of typical accumulation spikes is the key deviation. “Whoever bought the bottom did it slowly. Possibly even a single whale,” he stated. The analyst explained that widespread investor participation historically produces clear spikes in Bitcoin’s youngest HODL Wave bands. “When it’s many investors, you expect to see spikes in buying activity. That’s happened every time across 17.5 years of Hodl Wave data except now,” Woo elaborated.

    How HODL Waves Reveal Accumulation Patterns

    HODL Waves segment Bitcoin’s circulating supply based on the duration coins have remained unmoved. The youngest bands are especially sensitive to recent buying activity because newly acquired coins appear there first before migrating to older age bands if held long-term. If those coins are spent again, they cycle back to the youngest bands.

    Normally, a market bottom accompanied by broad participation generates conspicuous bursts in these short-term waves. The current absence of such spikes suggests accumulation may have been driven by a very large investor or a small number of entities operating quietly.

    Single-Whale Theory Remains an Interpretation, Not a Conclusion

    Woo has acknowledged that the single-whale explanation is only one interpretation. Other factors could account for the anomaly, including:

    • Exchange-traded fund (ETF) flows
    • Institutional custody arrangements
    • Derivatives market activity
    • Structural changes in Bitcoin’s market since HODL Wave data first became available

    Bitcoin Price Action Remains Fragile Amid Macro Headwinds

    The on-chain signal arrives as Bitcoin navigates shaky price action. As reported by U.Today, the leading cryptocurrency recently slipped below the psychologically important $77,000 level on Thursday. While Bitcoin has since bounced from those lows, market fragility persists due to the high probability of an incoming rate hike.

    Adding to near-term uncertainty, a major derivatives expiry is scheduled for Friday. According to Coinbase Markets, approximately $2.51 billion worth of Bitcoin and Ethereum options are set to expire, with BTC accounting for the overwhelming majority of the total notional value.

  • Coinbase CEO: “$400,000 Is a Reasonable Target for Bitcoin”

    Coinbase CEO: “$400,000 Is a Reasonable Target for Bitcoin”

    Coinbase CEO Brian Armstrong Projects $400,000 Bitcoin by 2030

    Coinbase CEO Brian Armstrong has reiterated his long‑term bullish outlook for Bitcoin, stating that a price of $400,000 by 2030 is a “reasonable target.” In a recent interview, Armstrong outlined the key drivers behind his prediction, citing market cycles, evolving U.S. regulation, and growing institutional capital inflows.

    Bitcoin’s Four‑Year Market Cycle Nearing a Turning Point

    Armstrong emphasized that Bitcoin continues to follow an approximate four‑year cycle characterized by a strong rally, a period of euphoria, and a subsequent correction. He noted that the current downturn may be approaching its end.

    “Typically, there’s a rise, then a period of euphoria, and then a decline. Most declines last about a year, and we’ve already passed the one‑year threshold in the current decline.”

    Pointing to Bitcoin’s rebound from support around $60,000, Armstrong expressed confidence that the cycle bottom is behind us.

    “Personally, I believe that the bottom of this latest cycle in Bitcoin is behind us. We’ve already seen it start rising from around $60,000.”

    Regulatory Clarity and the CLARITY Act

    Regulatory developments in the United States play a significant role in Armstrong’s $400,000 forecast. He highlighted the CLARITY Act, a bill designed to establish a clearer legal framework for cryptocurrencies. While passage of the act would be a major milestone, Armstrong argued that Bitcoin’s upward trajectory does not depend solely on its success; subsequent regulatory rules could also shape the market’s direction.

    Armstrong described the legislation as a “regulatory checkbox” that would remove substantial uncertainty for banks and asset managers, potentially unlocking a wave of institutional investment.

    “This would be a huge milestone. It could pave the way for institutional capital and bring products like tokenized shares to the US. That would be very positive for the industry.”

    Macro Tailwinds: Bond Market Pressure and Alternative Assets

    Beyond crypto‑specific factors, Armstrong pointed to stress in global bond markets as a catalyst for demand for alternative stores of value such as Bitcoin. If these macroeconomic pressures combine with regulatory progress and the natural market cycle, he believes Bitcoin could enter another strong bull phase in the coming years, ultimately reaching the $400,000 level by 2030.

    *This is not investment advice.

  • Bitcoin Below $77,000, Zcash Leads Losses as Traders Bet on Fed Rate Hike

    Bitcoin Below $77,000, Zcash Leads Losses as Traders Bet on Fed Rate Hike

    Bitcoin hovered near a critical technical threshold Thursday as risk assets sold off broadly on surging oil prices, rising Treasury yields, and mounting expectations for another Federal Reserve interest-rate hike.

    Key Support Level in Focus

    Bitget analyst Lewis Huang marked the line before the print, saying “$76,270 is an important technical support level.” Bitcoin is now less than $800 above it.

    Energy Shock Ripples Through Markets

    Brent crude ripped above $107 a barrel, up more than 6%, with West Texas Intermediate near $102. The energy shock feeds directly into the inflation data the Fed is watching. The 10-year Treasury yield pushed toward 5% and the two-year above 4.5%.

    Gold slipped toward $4,330, the dollar index firmed near 99, and the S&P 500 closed lower at about 7,594, a fourth straight decline. Asian equity futures followed, with Japan down nearly 2%, Korea more than 3% and Hong Kong close to 1%.

    Higher Real Yields Pressure Crypto

    Higher real yields drain crypto through two channels at once. They make government debt competitive with an asset that pays nothing, and they raise the cost of carrying leverage.

    U.S. spot bitcoin ETFs are already showing it, with $120 million of outflows on Wednesday, more than double Tuesday’s, while ether, $XRP and solana funds all took in money the same day.

    CPI Data and Fed Expectations

    August CPI lands at 8:30 a.m. ET, with headline inflation expected at 3.4% year over year and core at 2.4%. Interest rate futures put the odds of a hike at the Sept. 15-16 meeting near 70%, up from roughly a coin flip two weeks ago.

  • Ethereum Liquidity Surges: Can ETH Steal Bitcoin’s Spotlight in Q4?

    Ethereum Liquidity Surges: Can ETH Steal Bitcoin’s Spotlight in Q4?

    Bitcoin’s August Surge Masks Weak Spot Demand and Liquidity Concerns

    Bitcoin closed August over 25% higher compared to the previous month, recording its best monthly performance since November 2024. However, the stablecoin market cap only managed to grow by 0.5% and failed to hold above $310 billion, which suggests that the inflow of liquidity is happening at a slow pace.

    On-Chain Metrics Reveal Lack of Spot Buying Pressure

    The same pattern is evident on the on-chain level. As the chart below shows, Bitcoin rose by around 45% from its recent low, but there is a lack of spot demand, as evidenced by the 90-day CVD being neutral. Liquidity across exchanges is also weak, as seen in Binance’s stablecoin reserves, which dropped nearly $7 billion from their cycle peak above $50 billion.

    Source: CryptoQuant

    Technical Bullishness Contrasts with Speculative Positioning Risks

    So, while Bitcoin’s technical structure has turned bullish, liquidity and spot demand remain muted. At the same time, rising Open Interest suggests growing speculative positioning, which makes $BTC vulnerable to a long squeeze if $80k resolves as the ceiling, especially with the FOMC meeting approaching.

    Ethereum’s Liquidity Divergence Signals Potential Shift from Bitcoin

    However, the bigger signal may be the growing liquidity divergence between Bitcoin and Ethereum. If capital continues to rotate towards $ETH and away from $BTC, this could set up the conditions for altcoins to outperform Bitcoin in the coming Q4, particularly as macro volatility drives risk appetite shifts. If this trend holds, it could provide the first confirmation that Bitcoin’s [$BTC] current rally is a bull trap.

    Ethereum Derives Liquidity from Both Speculation and On-Chain Utility

    Unlike Bitcoin, Ethereum is capable of deriving liquidity from both speculative demand and on-chain utility. The promise of Ethereum as a platform for stablecoins, tokenized assets, and DeFi creates additional demand for the asset.

    For instance, the total stablecoin supply in the Euro minted on the Ethereum blockchain increased by 347.3% over the past three years to reach $848.1 million. Ethereum hosts 69.4% of the total, surpassing all other blockchains combined by more than double. Similarly, stablecoins on the Robinhood Chain exceeded the $1 billion mark, illustrating the strong demand for on-chain liquidity.

    Record ETH Staking Underscores Capital Commitment to Ethereum

    In addition, as depicted in the chart below, staking $ETH is yet another example of increased demand for Ethereum. According to the chart, the amount of $ETH staked saw yet another ATH. Specifically, 42.95 million $ETH or $105.96 billion were deposited across all validators, representing 35.21% of $ETH’s supply.

    Source: ValidatorQueue

    Capital Flows Into Ethereum Ecosystem Drive ETH/BTC Ratio Higher

    Taken together, improving stablecoin liquidity and record $ETH staking suggest that capital is flowing into the Ethereum ecosystem. Not only are traders fueling demand, but holders are also locking up significant amounts on-chain and committing them to the network.

    This helps explain why the $ETH/$BTC ratio keeps trending higher. While Bitcoin is seeing rising bull trap fears and weak spot buy, Ethereum has seen increased liquidity and capital inflows. If the divergence persists, then $ETH/$BTC ratio could very well have the momentum to break above 0.031.

    Altcoin Outperformance Potential in Q4 Hinges on Sustained Liquidity Rotation

    More importantly, a sustained rotation of liquidity into Ethereum [$ETH] can spill over into the broader altcoin market. And if Bitcoin continues to lose liquidity share to $ETH, it could be a major catalyst for altcoins to outperform $BTC in the fourth quarter.

    Final Summary

    • Ethereum is seeing more liquidity, with stablecoin growth and record $ETH staking showing stronger demand.
    • If this trend continues, $ETH could keep gaining on $BTC and help drive an altcoin rally in Q4.
  • Altcoin Market Nears $1.07T Breakout as Warning Signs Emerge

    Altcoin Market Nears $1.07T Breakout as Warning Signs Emerge

    Altcoin Market Cap Reaches $1.77 Trillion, Barely Surpassing 2021 Peak

    On October 7, 2025, TOTAL2 — the market capitalization metric tracking altcoins including Ethereum (ETH) — hit an all-time high of $1.77 trillion. The new peak edged out the previous record of $1.71 trillion set on November 8, 2021, by a razor-thin margin.

    Altcoins Lag Bitcoin’s Recovery

    The minimal gain underscores a punishing bear market for long-term altcoin holders. While Bitcoin (BTC) shattered its 2021 all-time high by 58.8%, the collective altcoin market — long viewed by investors and traders as offering greater upside potential — has largely disappointed as an asset class.

    TOTAL2 Trapped in Multi-Year Range

    Source: TOTAL2 on TradingView

    Since 2022, TOTAL2 has consolidated within a long-term range. Its failure to decisively clear the prior peak confirms the range-bound structure. At the time of writing, the mid-range level at $1.07 trillion was being tested as resistance — a level that previously capped advances in May and could do so again.

    A sustained breakout above the mid-range would signal improving conditions for altcoins in the weeks ahead. However, on-chain metrics suggest such a move faces significant headwinds.

    Rising Exchange Inflows Signal Caution

    Source: CryptoQuant

    Crypto analyst Arab Chain highlighted a surge in addresses depositing altcoins to exchanges, reaching the highest level since May. Binance alone recorded 25,856 deposit addresses — the most among tracked platforms.

    This uptick indicates increased movement of altcoins onto trading venues, though it does not necessarily imply an imminent sell-off. The analyst noted the flows could also reflect heightened trader activity or liquidity provisioning.

    Declining Stablecoin Reserves Point to Weaker Buying Power

    Source: CryptoQuant

    Meanwhile, Tether (USDT) reserves across all exchanges have trended downward since December 2024. A brief period of stablecoin inflows during summer 2025 lasted only a few weeks before reversing.

    Falling stablecoin balances on exchanges typically signal reduced dry powder — the capital ready to deploy into crypto assets. Unlike the second half of 2025, the market currently lacks a strong directional bias according to this metric.

    Bullish Sentiment Tempered by Structural Warnings

    Despite growing confidence in broader crypto market sentiment, several warning signs warrant attention. Conditions remain constructive, but a clear, sustained bull run has yet to materialize.

    Key Levels to Watch

    • Altcoin market cap: $1.07 trillion (mid-range resistance)
    • Breakout catalyst: Rising demand and expanding purchasing power

    A meaningful altcoin advance depends on a reversal of current exchange inflow trends and a rebuilding of stablecoin reserves — signals that fresh capital is returning to the market with conviction.

  • Republicans Introduce New Version of Key Crypto Bill for BTC, XRP, ETH

    Republicans Introduce New Version of Key Crypto Bill for BTC, XRP, ETH

    Senate Republicans have circulated a revised 630-page version of the CLARITY Act mere days before a pivotal procedural vote that could shape the regulatory future of the broader cryptocurrency market, including major assets such as Bitcoin, XRP, and Ethereum.

    Partisan Dynamics Remain Unresolved

    Journalist Brendan Pedersen reported Thursday that the latest legislative text remains a Republican proposal rather than a bipartisan agreement. Democrats who have previously expressed interest in crypto legislation remain skeptical, according to Pedersen. A Democratic aide characterized the unresolved ethics dispute as the “biggest stumbling block by far.”

    “This latest proposal does nothing to resolve those concerns,” the aide said.

    Sept. 15 Cloture Vote Looms as Critical Test

    The Senate’s cloture motion on the motion to proceed to the CLARITY Act is scheduled to ripen on Sept. 15 at 2:15 p.m. ET. This procedural vote determines whether debate on the legislation can advance; it is not a final vote on passage. With the current draft still lacking bipartisan support, Republicans will need to persuade enough Democrats to allow the legislation to move forward.

    Key Revisions in the Updated Draft

    The updated legislation introduces several notable changes to the regulatory framework:

    Decentralization Definitions Refined

    The revised draft draws a clearer distinction between genuinely decentralized protocols and what it terms “non-decentralized finance trading protocols.” The text specifies that merely participating in a decentralized governance mechanism or an incident-response security council does not automatically constitute control.

    Developer Protections Retained

    The bill maintains significant protections for software developers, a provision viewed as critical for innovation in the digital asset space.

    Focus on Digital-Commodity Markets

    The revised DeFi language explicitly focuses parts of the regulatory regime on digital-commodity cash and spot markets, narrowing the scope of certain oversight mechanisms.

    Credit Union Provisions Strengthened

    Another notable revision strengthens language concerning credit unions. Regulators, including the National Credit Union Administration (NCUA), would retain their full supervisory and enforcement powers. The bill also makes technical changes to the GENIUS Act intended to place credit-union accounts on more equal footing with bank deposits when dealing with tokenized financial products.

    Political Hurdle Outweighs Technical Changes

    While the updated draft modifies several regulatory mechanics of the CLARITY Act, it does not resolve the core political dispute most likely to determine whether the legislation can advance. The Sept. 15 cloture vote represents the next major test, and the outcome will signal whether a path forward exists for comprehensive crypto market structure legislation in the current Congress.

  • Liquid Hackers Call Blockstream ‘Delusional, Greedy, and Arrogant,’ Demand 10% Bounty

    Liquid Hackers Call Blockstream ‘Delusional, Greedy, and Arrogant,’ Demand 10% Bounty

    Blockstream-Hacker Dispute Escalates Over Liquid Sidechain Security Breach

    The conflict between Blockstream and the party claiming to be a white-hat hacker has intensified, according to a recent update from Samson Mow. The hacker has leveled serious accusations against Blockstream, alleging the company dedicated only $1.5 million—or possibly nothing—to secure approximately $5 billion in assets on the Liquid sidechain.

    Hacker Demands Bounty, Threatens Further Losses

    In a message characterized by harsh language, the hacker labeled Blockstream’s approach a “flagrant neglect of security.” The group demanded that Blockstream pay a 10% bug bounty from its own funds and warned that refusal could lead to a 15% loss for Liquid users. The communication further accused Blockstream of being “delusional, greedy, and arrogant” in its security management. The hackers also stated they intend to publish the private key required to decrypt their conversations with the company.

    Meanwhile, the Liquid sidechain remains paused. Blockstream and Federation members are working on additional security fixes, resolving a chain split, and preparing for a coordinated network restart. Users have been advised not to send Bitcoin to Liquid peg-in addresses until the network is fully operational again.

    Background: $320 Million Withdrawal and Partial Return

    The latest exchange follows the withdrawal of roughly 4,000 BTC (valued at approximately $320 million at the time) from Liquid’s Federation wallet on September 6. The party responsible initially identified as white-hat hackers, stating the funds would be returned once Blockstream addressed the security vulnerability and patched all affected nodes. After Blockstream confirmed the bridge nodes had been patched, 3,400 BTC was returned to the Federation wallet, leaving approximately 598 BTC still in the hackers’ possession.

    Mow Warns of Serious Consequences

    In a separate post on X, former Blockstream Chief Strategy Officer Samson Mow cautioned the hackers that they may be underestimating the repercussions of their actions. He noted that Blockstream’s decision to engage with them via PGP encryption was a “courtesy” and questioned whether publicly admitting to taking the BTC and then demanding a bounty was a “wise move.”

    Mow further suggested the group left behind more forensic clues than they realize and warned that returning the funds does not guarantee they can simply walk away from the incident.

    “As a white hat, the road only widens; as a black hat, you’re forever on edge. Dreaming of walking away with assets unscathed is nothing but delusion. Some doors, once opened, can never be closed again.”

  • Bitcoin, Ethereum, XRP Plunge as US PPI Surges to 5.4%, Fed Rate‑Hike Odds Hit 74%

    Bitcoin, Ethereum, XRP Plunge as US PPI Surges to 5.4%, Fed Rate‑Hike Odds Hit 74%

    Bitcoin, Ethereum, and XRP extended their losing streak on Thursday after fresh U.S. inflation data fueled speculation that the Federal Reserve will raise interest rates at its upcoming policy meeting. The renewed sell-off across major cryptocurrencies highlights the asset class’s continued sensitivity to macroeconomic shifts and central bank signaling.

    Inflation Data Triggers Rate-Hike Bets

    The latest consumer price figures came in hotter than expected, reinforcing the narrative that the Fed’s tightening cycle may not be over. Markets quickly repriced the probability of a rate hike at the September 15–16 Federal Open Market Committee (FOMC) meeting, sending risk assets — including digital assets — lower.

    Crypto Market Reacts to Macro Pressure

    Bitcoin slipped below key technical levels, while Ethereum and XRP mirrored the downturn. The correlation between crypto and equities remains elevated, meaning that any hawkish tilt from the Fed tends to weigh on both traditional and digital risk markets simultaneously.

    FOMC Meeting in Focus

    Traders are now laser-focused on the September 15–16 FOMC gathering. A rate increase — or even hawkish forward guidance — could prolong the current correction in crypto prices. Conversely, a pause with dovish undertones might provide a short-term relief rally.

    The September 15-16 FOMC meeting could be weighed on risk assets on the crypto market.