Tag: Bitcoin

  • Trump Promises $5,000 Payment: Bitcoin and Altcoins React

    Trump Promises $5,000 Payment: Bitcoin and Altcoins React

    The U.S. election cycle, a key focus for Bitcoin and altcoin markets, has re-entered the spotlight. As the country moves toward the November congressional midterms, former President Donald Trump officially launched his campaign with a rally in Texas yesterday, unveiling a sweeping financial proposal aimed at adult American citizens.

    Trump Proposes $5,000 Payment for Every Adult Citizen

    Speaking at a Republican midterm election rally in Dallas, Trump declared that if Republicans secure control of both the Senate and the House of Representatives, every adult U.S. citizen would receive a $5,000 payment. The announcement was framed with a bold banner: “Trump: $5,000 for Every Adult Citizen!”

    However, the former president attached a strict domestic spending requirement. He stated, “I don’t want you spending this money in Canada, China, or Germany. The only condition is that the money is spent in the United States.”

    Funding Details and Legislative Hurdles Remain Unclear

    Trump did not outline how the program would be funded during his remarks. According to Reuters calculations, based on an estimated U.S. adult population of 270 million, the total cost could reach approximately $1.35 trillion. Legal experts cited by Reuters emphasized that a presidential decree alone would be insufficient to authorize such payments; congressional legislation would be required.

    Crypto Analysts Eye Potential Liquidity Surge and Altcoin Season

    The proposal has immediately sparked discussion within the cryptocurrency sector regarding its potential market impact. Cryptocurrency analyst Mark Chadwick suggested that implementing a $5,000 “dividend” for American adults could act as a powerful liquidity catalyst for digital assets.

    In a post on his X account, Chadwick compared the theoretical plan to the COVID-19 stimulus payments distributed in 2021. He argued that the influx of new capital could accelerate a bull market cycle he believes is already forming. Chadwick previously noted that the long-term downtrend in the altcoin market has broken, with current technical patterns resembling the early stages of previous major altcoin rallies.

    This is not investment advice.

  • Bitcoin Reacts to US PPI Data Release

    Bitcoin Reacts to US PPI Data Release

    Bitcoin slipped below $78,000 on Tuesday as traders braced for a critical week of U.S. inflation data, starting with the Producer Price Index (PPI) release. The pullback erased early-week gains that had briefly tested the $80,000 resistance level, and the broader altcoin market followed suit, with Ethereum (ETH), XRP, and BNB all posting losses.

    PPI and CPI Data to Shape Fed Rate Outlook

    The market’s focus remains fixed on the Federal Reserve’s September interest rate decision. According to Fed WatchTool data, the probability of a rate hike in September is currently priced at 62.2%. Today’s PPI figures and tomorrow’s Consumer Price Index (CPI) report are expected to be pivotal in shaping those expectations.

    Analysts suggest a lower-than-expected PPI reading could signal easing inflationary pressures, strengthening the case for a Fed rate cut and potentially triggering a positive reaction in Bitcoin and other risk assets. Conversely, a hotter-than-forecast print could dampen rate-cut hopes and apply short-term selling pressure on crypto markets.

    August PPI Data Released: Key Figures

    The U.S. Bureau of Labor Statistics released the August PPI data this morning. The results were mixed relative to forecasts:

    • Core PPI (Monthly): 0.2% (Expected: 0.3%; Previous: 0.2%)
    • Core PPI (Annual): 4.6% (Expected: 4.6%; Previous: 4.2%)
    • Headline PPI (Monthly): 0.4% (Expected: 0.4%; Previous: 0.0%)
    • Headline PPI (Annual): 5.4% (Expected: 5.3%; Previous: 4.7%)

    While the monthly core reading came in below expectations — a potential positive for risk sentiment — the annual headline figure ticked higher to 5.4%, above both the prior month and consensus estimates.

    Bitcoin’s Immediate Reaction

    Bitcoin’s initial price action following the data release was muted, holding near the $78,000 level as markets digested the mixed signals. Traders now await Wednesday’s CPI report for further directional clarity.

    This is not investment advice.

  • Crypto Falls Amid $386M Liquidation Wave, Rate-Hike Fears

    Crypto Falls Amid $386M Liquidation Wave, Rate-Hike Fears

    Bitcoin Volatility Spikes as Price Drops 2.5% in 14 Hours

    Bitcoin ($BTC) and the broader cryptocurrency market saw heightened volatility on September 9. The flagship asset rallied to an intraday high of $79,760 before reversing sharply, shedding 2.49% over roughly 14 hours to trade near $77,770.

    Liquidations Surge as Long Positions Unwind

    The pullback forced $BTC to retest a local support zone around $77,900. That move triggered the largest single-day liquidation total in nearly a week, with $269.96 million in long positions and $116.62 million in shorts forcibly closed, according to market data.

    Spot Bitcoin ETF Flows Show Demand Slowdown

    Institutional appetite appeared to cool. Over the prior two trading sessions, U.S. spot Bitcoin ETFs recorded a combined net outflow of $166.8 million, based on figures from Farside Investors.

    Long-Term Holders Take Profits

    On-chain analysis indicates that long-term holders have been realizing gains. Selling pressure from this cohort likely contributed to the short-term correction. However, the $76,000 demand zone held firm, preserving the bullish case for a recovery bounce.

    Key Supply Zone Remains Contested

    Between $76,000 and $82,000 lies a critical battleground. Approximately 35% of the total Bitcoin supply was accumulated at or above this range, making it a pivotal area for both bulls and bears in the longer-term outlook.

    Macro Headwinds Intensify

    The cryptocurrency retreat coincided with a broader risk-off shift. Rising oil prices reignited concerns over accelerating inflation, pushing the probability of a U.S. Federal Reserve rate hike to 60.2%.

    Technical Outlook: Bullish Structure Intact but Tested

    4-Hour Chart Holds Key Demand

    On the 4-hour timeframe, Bitcoin maintains a bullish market structure. Last week’s surge to $82,300 confirmed trend continuation. Despite the deep retracement, price remains above the $77,000 demand zone (marked in cyan on TradingView charts).

    A decisive break below $76,264 would be required to invalidate the bullish 4-hour structure and flip the bias bearish.

    Liquidation Heatmap Highlights Magnetic Levels

    CoinGlass’s 1-week liquidation heatmap identifies the nearest high-density liquidity cluster at $77,400. Volatility could pull price toward this level before a potential move higher.

    To the upside, notable magnetic zones sit at $79,700, $80,500, and $82,000 — levels traders should monitor for resistance or breakout confirmation.

    Summary

    • Negative spot ETF flows and long-term holder profit-taking drove the 24-hour retracement.
    • Over $200 million in long liquidations amplified the downside move.
    • Macro pressure persists: higher oil prices fuel inflation fears, with Fed rate-hike odds at 60.2%.
    • Short-term bias remains bullish provided the $76,000–$77,000 zone holds.
  • Bitcoin Holds $78,000 as Altcoin Market Falters

    Bitcoin Holds $78,000 as Altcoin Market Falters

    Bitcoin Holds $78K as Crypto Market Cap Dips to $2.76 Trillion

    Bitcoin traded at $78,378 on Tuesday, gaining roughly 1% over the past 24 hours and the past week, even as the broader cryptocurrency market slipped. Total crypto market capitalization fell nearly 1% to $2.76 trillion, with Bitcoin outperforming most altcoins. BTC’s own market cap hovered near $1.57 trillion, supported by daily trading volume between $29 billion and $35 billion across major exchanges.

    Range-Bound Trading Persists Below $83,000

    Bitcoin has remained stuck in a tight range below $83,000 for close to two weeks, a consolidation pattern that mirrors a similar quiet stretch in July and August. That earlier range eventually resolved into a bullish breakout. Currently, price is holding above a short-term floor near $77,000, with a recent low of $76,230 marking the next line of defense if the range breaks down.

    Some technical analysts argue that a clean daily close above $83,000 could open the door to a larger structural move, with a measured target projecting toward $160,000. That figure is framed as a pattern-based projection rather than a direct price forecast.

    Key Support Levels in Focus

    The broader uptrend dating from the July low remains intact as long as Bitcoin defends the $70,500 to $75,180 zone. A break below $70,500 would signal the first real crack in market structure, since that level represents the 50% retracement of the recent rally.

    Cycle-based timing models suggest a weaker stretch ahead, with a possible low forming in October, a period of calm into November, and a deeper dip near year-end before conditions improve heading into 2026.

    Sentiment Remains in Greed Territory

    Despite sideways price action, market sentiment has not cooled. The Fear and Greed Index sits at 69, firmly in “Greed” territory, indicating traders have not lost confidence even as price refuses to commit to a direction.

    What Analysts Are Watching Next

    • Break above $83,000: Would signal the range is finally resolving to the upside.
    • Drop below $76,230, then $70,500: Would point to a deeper pullback and potential trend change.
    • Historical rhyme: Whether this range snaps the way July–August’s did, with a fast move once the breakout occurs.

    For now, Bitcoin remains in a holding pattern. The levels are clear, the next move is not, and both short-term charts and longer-term timing signals agree on one thing: the market is building toward a decision, even if the direction remains unknown.

  • Bitcoin Sell Pressure Hits One-Month Low as Long-Term Holders Reduce Profit-Taking

    Bitcoin Sell Pressure Hits One-Month Low as Long-Term Holders Reduce Profit-Taking

    Bitcoin On-Chain Sell-Side Risk Drops Below Half of August Peak, Glassnode Reports

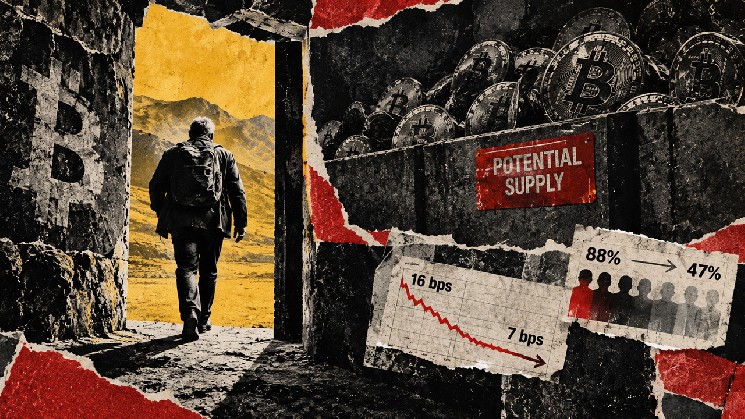
    Bitcoin’s on-chain sell-side risk has declined to less than half its August high, signaling reduced potential selling pressure even as a significant cluster of older coins remains held above current market prices. Analytics firm Glassnode detailed the shift in a September 9 report covering on-chain data through September 7.

    Sell-Side Risk Ratio Falls to 7 Basis Points

    The firm’s Sell-Side Risk Ratio stood at 7 basis points per day on a seven-day basis, down sharply from 16 basis points at August’s peak. This metric aggregates on-chain profits and losses and divides the total by realized capitalization, measuring value realization relative to that capital base to indicate potential selling pressure.

    Long-term holders accounted for 47% of realized profit during the period, compared with 88% at the August peak. The decline suggests older holders are contributing a smaller share of the market’s realized profit, though the percentage does not measure their share of all Bitcoin sales.

    A ratio below half its earlier level does not mean the volume of Bitcoin sold on exchanges has halved.

    Profit Realization Spikes Moderate

    Glassnode separately reported that the realized-profit spike on September 3 was less than half the size of August’s spike. That comparison tracks profit spikes specifically, distinct from the seven-day risk measure. Together, the findings describe quieter realization activity and a changed mix of holders taking profits.

    Overhead Supply Cluster Holds at $83,000–$86,000

    The report identifies roughly 1.07 million BTC acquired between $83,000 and $86,000, almost all held by long-term holders. That block of coins barely changed over 30 days. The holdings remain potential supply, while the realization data describe what holders have recently been doing.

    Exchange Demand Remains a Separate Test

    Reports noted negative exchange spot flow on September 8. Spot cumulative volume delta (CVD) remained negative despite improving, meaning aggressive exchange selling still outweighed aggressive buying in that measure.

    CVD tracks the balance of executed trading, while sell-side risk tracks on-chain profit-and-loss realization relative to realized capitalization. A lower reading in the latter does not require the former to turn positive.

    Bitcoin holders are realizing less profit and loss relative to the capital base, while the overhead coins remain largely in place. Treating that entire block as immediate selling pressure would overstate the evidence. A sustained advance would still require buyers to absorb the supply that actually comes to market.

    Related Reading: Bitcoin’s next $80,000 breakout has $47 billion more profitable supply to absorb

  • Bitcoin Price Could Drop to $70K if $78K Neckline Breaks

    Bitcoin Price Could Drop to $70K if $78K Neckline Breaks

    Bitcoin Holds Near $78,500 as Technical Pressure and Macro Risks Mount

    Bitcoin (BTC) traded near $78,500 on September 9 after retreating from a September 3 peak of $82,283, a decline of roughly 4.6%. The pullback has extended a series of lower highs on the 4-hour chart, with buyers repeatedly defending the $78,000 area but failing to reclaim the psychological $80,000 level.

    4-Hour Technicals Show Fading Momentum

    On the 4-hour timeframe, Bitcoin sat at approximately $78,522, below the middle Bollinger Band at $79,079 and only slightly above the lower band at $78,015. Proximity to the lower band often signals increasing selling pressure, though the nearby support could also trigger a short-term bounce. A recovery above the middle band would be needed to weaken the immediate bearish setup.

    The upper Bollinger Band sits near $80,144, making the $80,000–$80,150 region the first major resistance zone. A daily close above that area would give bulls another chance to challenge recent highs around $81,500 and $82,300.

    The 4-hour Relative Strength Index (RSI) read 43.58, below both the neutral 50 mark and its signal average of 44.71, indicating bearish momentum without reaching oversold territory.

    Macro Headwinds: Oil, Yields, and Fed Policy

    Bitcoin’s decline coincided with a broader risk-off move driven by escalating Middle East tensions. Brent crude climbed to $99.22 per barrel on September 9, while West Texas Intermediate rose to $94.13, reviving fears that higher energy costs could keep inflation elevated.

    Rising inflation expectations affect Federal Reserve interest-rate projections. Higher rates and bond yields boost returns on lower-risk assets, creating competition for non-yielding assets like Bitcoin.

    U.S. Treasury yields added pressure. The benchmark 10-year yield surged above 4.85% after the Treasury announced a $6 billion buyback of older bonds (10- to 20-year maturities). The 30-year yield hit its highest level since 2007. Rising yields tighten financial conditions by increasing borrowing costs and reducing appetite for volatile assets.

    Traders are now focused on incoming inflation data and oil prices ahead of the Federal Reserve’s September 15–16 policy meeting for clues on whether the central bank will maintain a restrictive stance.

    Daily Structure Still Intact, but Head-and-Shoulders Looms

    Daily indicators remain less bearish. Bitcoin continues to trade above the daily Supertrend support at $72,786, meaning the broader recovery structure has not been invalidated despite the recent drop.

    The daily Aroon lines are closely matched at 57.14% and 50%, showing neither buyers nor sellers have established firm control on the higher timeframe.

    Crypto analyst Gerla identified a potential head-and-shoulders pattern, with the left shoulder near late-August highs, the head at the September 3 peak, and the right shoulder possibly forming during the latest rebound.

    “$78K–$79K is the line in the sand. Lose that and $70K could come pretty quick,” Gerla said in a Sept. 9 post on X.

    The pattern remains unconfirmed while Bitcoin holds its neckline. A decisive daily close below $78,000 would strengthen the bearish setup and expose the $76,000–$77,000 zone before the larger downside target near $70,000.

    Liquidation Heatmap Highlights Key Liquidity Zones

    CoinGlass’s three-day liquidation heatmap shows heavy leveraged-position clusters above current levels. The strongest nearby liquidity sits between roughly $79,700 and $80,200, with additional concentrations extending toward $82,000. These levels can act as magnets during high-leverage periods, though they do not guarantee price will reach them. A recovery through $79,100 could trigger short liquidations and fuel a test of the $80,000 cluster.

    Downside liquidity is concentrated near $78,000 and between approximately $77,500 and $77,800. A break below current support could accelerate volatility as leveraged longs are closed. Further liquidity appears around $76,000, aligning with the next technical support area beneath the proposed neckline.

    Key Levels to Watch

    • Immediate range: Lower Bollinger Band (~$78,015) to middle band (~$79,079). Holding $78,000 keeps a relief move toward $79,700–$80,150 in play.
    • Bullish trigger: Sustained break above $80,150 weakens the short-term bearish structure and puts $81,500 and $82,283 back in focus. Clearing the September peak would confirm a renewed uptrend.
    • Bearish confirmation: Daily close below $78,000 shifts focus to $77,500, then the wider $76,000–$77,000 support zone. The head-and-shoulders interpretation gains credibility below the neckline, though the daily Supertrend near $72,786 remains a critical barrier before the $70,000 scenario can develop.
  • Steak ‘n Shake Reports Double-Digit Sales Growth After Bitcoin Adoption

    Steak ‘n Shake Reports Double-Digit Sales Growth After Bitcoin Adoption

    Indianapolis-based burger franchise Steak ‘n Shake reports that accepting Bitcoin payments has driven significant business growth, with the company citing double-digit same-store sales increases since adopting the cryptocurrency in May 2025.

    Bitcoin Adoption Correlates with Sales Acceleration

    In a post on X Tuesday, the company highlighted its performance since integrating Bitcoin Lightning Network payments.

    Ever since we started accepting Bitcoin in May 2025, we have achieved double-digit same-store sales growth! And this quarter has been extraordinary, with franchise-partners same-store sales gaining 19%. Come have a Bitcoin burger and Bitcoin shake to celebrate! Thank…

    The firm added: “And this quarter has been extraordinary, with franchise-partners same-store sales gaining 19%.”

    Payment Cost Savings Cited as Key Driver

    Steak ‘n Shake began accepting Bitcoin via the Lightning Network last year and announced in January that it had added $10 million in Bitcoin to its strategic reserve. At the Bitcoin 2026 Conference in April, Chief MAHA Officer Michael Boes detailed how the payment method has become a core driver of the chain’s business performance.

    According to Boes, same-store sales rose 11% quarter over quarter in Q2 2025 and accelerated to 15% in Q3 2025, outpacing major rivals including McDonald’s, Taco Bell, and Domino’s. He characterized this as the highest same-store sales growth of any restaurant in the industry, attributing the performance to Bitcoin Lightning transactions being cheaper and faster than traditional electronic payment methods.

    The cost difference is substantial: when customers pay with Bitcoin instead of a credit card, Steak ‘n Shake saves roughly 50% on processing fees. Traditional credit card processors charge merchants between 2.5% and 3.5% per transaction.

    Bitcoin is real money made with real energy,

    Boes said at the conference.

    Company Rejected Multi-Crypto Approach

    The franchise also considered accepting other cryptocurrencies but abandoned the idea after a poll on X indicated customers believed only Bitcoin was necessary.

  • Bitcoin Gold Cross Alert: Analyst Warns “Bullish at First, But Then…”

    Bitcoin Gold Cross Alert: Analyst Warns “Bullish at First, But Then…”

    Cryptocurrency analyst Benjamin Cowen has warned investors that Bitcoin historically declines following a “Golden Cross” pattern, a technical formation typically interpreted as a bullish signal.

    Golden Cross Often Precedes Short-Term Pullback

    The Golden Cross occurs when the 50-day moving average crosses above the 200-day moving average. While technicians widely view this crossover as a long-term buy signal, Cowen’s analysis of past cycles shows the pattern frequently coincides with local market tops.

    Analyst: “Bitcoin Generally Seen to Decline After a Gold Crossover”

    According to Cowen, the rallies that precede the Golden Cross push the moving averages higher to create the crossover. However, once the intersection is complete, the market often experiences sell-offs from those local highs. Historical data from the 2019 and 2023 Golden Cross events shows pullbacks ranging between 12% and 15% at the moment of intersection, followed by recovery and new local highs.

    Current Pullback Considered Natural

    Cowen characterizes the ongoing pullback as a natural market structure development. He emphasizes that the critical factor is not the depth of the initial selling wave, but the character of the rebound rally that follows. It remains uncertain whether Bitcoin will establish a new high or form a lower peak after the sell-off concludes.

    Bullish vs. Bearish Scenarios for Q4

    Outlining forward-looking scenarios, Cowen stated that a higher peak during the rebound would strengthen the bullish case. Conversely, if the rebound remains weak and forms a lower peak—similar to the price action observed in 2014 and 2015—the risk of a renewed downturn in the fourth quarter could increase.

    This is not investment advice.

  • Bitcoin Warning: Signal That Failed in Past Bull Runs Flares Up Again

    Bitcoin Warning: Signal That Failed in Past Bull Runs Flares Up Again

    Bitcoin MVRV Z-Score Nears Critical 365-Day Average, CryptoQuant Signals Potential Regime Shift

    Cryptocurrency analytics platform CryptoQuant reports that Bitcoin’s MVRV Z-Score is approaching its 365-day moving average — a level that has historically marked major market regime changes. While the indicator is trending toward this threshold, the current reading does not yet confirm the start of a new bull market.

    Historical Significance of the 365-Day Moving Average Breakout

    According to CryptoQuant’s analysis, a sustained break above the 365-day moving average on the MVRV Z-Score has previously signaled a transition from a recovery phase to an expansion phase. The firm highlights three prior instances:

    • The 2015–2016 breakout preceded the 2017 bull market.
    • The 2020 move came ahead of the 2020–2021 rally.
    • The 2023 recovery aligned with the final expansion period of that cycle.

    If Bitcoin clears and holds above this level, it could reflect a resurgence of unrealized profits across the network and the beginning of a new expansion regime. Conversely, a rejection would suggest overall market profitability remains insufficient to support a broader bull run.

    Current Cycle Shows Structurally Shallower Correction

    A key distinction in the current cycle is that the MVRV Z-Score did not fall below zero during the recent pullback — unlike at previous major cycle lows, where the indicator entered a low-valuation zone. CryptoQuant notes this could mean one of two things:

    • Bitcoin is experiencing a structurally shallower correction.
    • A capitulation event on the scale of prior macro lows may not yet be complete.

    Additionally, the MVRV Z-Score has formed lower peaks in each successive cycle. This trend suggests that even as Bitcoin’s price reaches higher highs, the market’s valuation excesses are becoming progressively more limited over time.

    Risk Assessment: Key Levels to Watch

    CryptoQuant outlines the following scenarios for market direction:

    • Bullish scenario: MVRV Z-Score reclaims and sustains above the 365-day moving average.
    • Repair regime: Rejection at the 365-day average indicates the market remains in a repair phase.
    • Correction not complete: A move back toward zero would reinforce the view that the current correction process is unfinished.

    This analysis is for informational purposes only and does not constitute investment advice.

  • Europe Wants To “Mobilize” €10 Trillion Of Savings. Got Bitcoin?

    Europe Wants To “Mobilize” €10 Trillion Of Savings. Got Bitcoin?

    Europe’s Capital Shortfall: The €750–800 Billion Investment Gap

    European Commission President Ursula von der Leyen recently told French business leaders that trillions of euros in household savings held in bank accounts are sitting idle. She argued that Europe needs to put these savings to work for its companies. Her concern reflects a genuine structural issue: European companies struggle to access the capital required for growth, while households keep a disproportionate share of wealth in bank deposits.

    The European Commission’s Savings and Investments Union strategy cites the Draghi report’s estimate that the EU requires an additional €750 billion to €800 billion in annual investment by 2030. Banks remain central to the European economy, yet early-stage technology firms need equity capital and deep markets capable of absorbing risk. Many promising companies still relocate to the United States to scale or are acquired by foreign competitors.

    Household Savings vs. Capital Markets: The European Paradox

    European households save a larger portion of their income than Americans but allocate far less to capital markets. In a November 2024 speech, European Central Bank President Christine Lagarde noted that the household savings rate stands at about 13% in Europe versus 8% in the U.S. She added that Europeans held roughly €11.5 trillion in cash and deposits in 2023, representing one‑third of household financial assets.

    ECB analysis suggests that aligning the European deposit-to-financial-assets ratio with the American benchmark could redirect up to €8 trillion into European markets. Bridging the gap between savers and businesses could theoretically boost household wealth while helping European firms expand.

    Brussels’ Proposal: Savings and Investment Accounts Explained

    The rhetoric around mobilizing savings has sparked fears of deposit seizures. The published policy does not support that claim. The Commission’s September 2025 recommendation on Savings and Investment Accounts asks member states to create simple investment accounts giving retail savers access to shares, bonds, and regulated funds. Key features include:

    • No minimum opening balance
    • Permission to hold multiple accounts
    • Assets can move between providers without triggering a taxable event

    The Commission aims to attract capital through favorable tax treatment — deductions, exemptions, deferrals, or a uniform tax rate — paired with broad provider access. Participation is voluntary. Providers are encouraged to offer diversified investments across asset classes and geographies, including options aligned with European priorities such as digital infrastructure, defense, and green infrastructure. Most crypto assets are excluded, though financial instruments with crypto exposure may qualify under existing rules.

    Why Bank Deposits Aren’t Truly Idle

    Labeling deposits as idle makes sense only from the perspective of the investment Europe desires. A deposit appears inactive because it has not yet become equity in a startup, a bond issued by a European manufacturer, or a fund holding European securities. The household holding it may have entirely different objectives.

    A bank deposit provides liquidity, stability, and optionality. It may cover next month’s rent, fund medical or caretaking needs, or serve as a cushion against unemployment. It also functions as a liability on a bank’s balance sheet, supporting the banking system’s lending and liquidity operations. The return may be low, especially after inflation, but low yield can be the price a saver knowingly pays for immediate access and lower volatility.

    The ECB’s own data helps explain this mindset. Lagarde reported that 45% of European consumers lack confidence that financial advice serves their best interests. European retail investors in mutual funds pay almost 60% more in fees than their American counterparts. A household responding to high fees, opaque risk, and distrust is making a rational choice under imperfect conditions. Better markets could gradually shift behavior, but describing hard‑won savings in negative terms obscures the institutional failures that produced this attitude.

    Bitcoin and the Ownership Question

    Bitcoin cannot solve Europe’s immediate equity‑financing shortage or close the technology gap. However, it is relevant because it provides money that is separate from any state or government. A bitcoin holder controls the keys required to authorize a transaction. The Bitcoin network has no central issuer or account administrator with the power to redirect balances toward an approved industrial objective. Governments can regulate exchanges, tax gains, and prosecute crimes, but the protocol itself offers no administrative lever for reallocating coins because officials believe another use would be more productive.

    This architecture gives technological form to an old idea: savings are deferred consumption created by labor, judgment, and restraint. Their owner may invest, spend, lend, or hold them untouched. Bitcoin allows that decision to remain with the holder when kept in self‑custody, provided the holder is responsible and comfortable with the technology. While bitcoin’s price remains more volatile than many would accept as a sole savings vehicle, volatility and the risk of permanent loss of purchasing power are distinct. Savers need the freedom to decide how much volatility they can tolerate, especially when that volatility comes with a lower risk of inflation and confiscatory policy interventions.

    Competing for Capital: Trust, Property Rights, and Cultural Change

    If we steelman the Savings and Investments Union, its proposals for simplified investment accounts, lower fund fees, consistent rules, and better risk disclosures are easy to support. They would give households the confidence and access needed to engage with markets that have been fragmented and difficult to navigate. If European companies offer attractive returns and Europe protects property rights, household capital will have reasons to invest.

    However, defense of private property rights in Europe has been historically inconsistent. In extreme cases — which nonetheless manifest every few decades — countries have confiscated savings directly from accounts, or even displaced millions of people, seizing their homes and belongings. Europeans’ desire for higher savings buffers is therefore rational. Building trust in markets requires strong financial engineering, but that alone is insufficient. Cultivating a culture of individual liberty and respect for private property would do far more to align European savers’ attitudes with their U.S. counterparts. The European Commission would do well to recognize the need for this cultural transformation, take steps to advance it, and even acknowledge bitcoin as part of the picture.

    Von der Leyen’s phrase captured the urgency of Europe’s capital shortage, but it also exposed the need for a public conversation about why trust in European markets remains relatively low. A strong investment case earns capital by offering terms savers accept. Savings are accumulated choices. Europe may compete for them. The last word should belong to the people who did the work.