Tag: Bitcoin

  • Wall Street Bets on Fed Rate Hike: What It Means for Bitcoin, Bonds, and Trump

    Wall Street Bets on Fed Rate Hike: What It Means for Bitcoin, Bonds, and Trump

    Federal Reserve Poised for First Rate Hike Since 2023 Amid Inflation Pressure

    Wall Street is bracing for the Federal Reserve to raise interest rates on Wednesday, a move that would mark the first increase since 2023. The Federal Open Market Committee concludes its two-day meeting this week, and CME’s FedWatch tool places the probability of a 25-basis-point hike at 94.5%, up from under 50% just a month ago. Such a move would lift the federal funds rate to a range of 3.75%–4% from the current 3.50%–3.75%.

    Wall Street Consensus Shifts Rapidly Toward Tightening

    The shift from unlikely to near-universal expectation happened quickly. A Wall Street Journal survey published this week found nearly every major bank now anticipates a hike on Wednesday. Most institutions—including Barclays, Citigroup, JPMorgan, Morgan Stanley, and UBS—forecast 50 basis points of total tightening by year-end. Bank of America, Deutsche Bank, and RBC are more hawkish, calling for 75 basis points of tightening in 2026. Goldman Sachs sits at the dovish end of the hiking camp, penciling in only this week’s quarter-point increase. Jefferies and Oxford Economics remain outliers, forecasting a rate cut in December and in 2027, respectively.

    Higher rates increase borrowing costs, dampen spending, and pressure assets that thrive on cheap capital, such as equities and Bitcoin. They also boost yields on safe government bonds, drawing capital away from riskier investments. However, market anxiety stems less from the hike itself than from uncertainty about the trajectory of future moves. Markets are repricing now, ahead of the Fed’s communication, to account for that ambiguity.

    Inflation and Labor Data Drive the Decision

    The case for tightening rests on persistent inflation. Headline CPI ran at 3.4% annually in August, with core inflation at 2.5%—both comfortably above the Fed’s 2% target. Oil prices, elevated by the ongoing conflict with Iran, have added a layer of price pressure that neither tariffs nor rate cuts can easily offset.

    The Fed held rates steady at 3.50%–3.75% in July, but that decision passed by a narrow 9–3 vote, with three policymakers already advocating for a hike at the time. That internal split, combined with a stronger-than-expected August jobs report, tilted the committee toward tightening heading into this week’s meeting.

    Political Tension Mounts as Trump Pressures Fed Chair

    The impending hike places Fed Chair Kevin Warsh in a difficult position. President Donald Trump handpicked Warsh for the role in January and, at his swearing-in ceremony in May, urged him to be “totally independent” while making clear he expected lower rates. That expectation has not materialized—at least not in the way Trump likely meant by “totally independent.”

    In the past two weeks, Trump, Vice President JD Vance, and Treasury Secretary Scott Bessent have all publicly pushed for rate cuts. Trump went as far as threatening to halt trade with countries running surpluses with the U.S. if rates do not come down. Warsh has stated the president has had no influence on Fed decisions.

    The rate decision lands two months before the November midterms, where polls already show voters frustrated with high prices and borrowing costs. The tightening cycle arrives in part because of the tariff and Iran-conflict policies Trump himself has championed.

    Bond Markets Price In Higher-for-Longer Rates

    Bond markets have not waited for Wednesday’s announcement. The 10-year Treasury yield touched 5.04% this week, its highest level since July 2007, as traders priced in both the hike and a prolonged period of elevated rates. The two-year yield, more sensitive to Fed policy, hit its highest level since July 2024. Higher yields make Treasurys more attractive relative to risk assets and tend to strengthen the dollar—a headwind for assets like cryptocurrency that benefit from abundant liquidity.

    Bitcoin and Altcoins Enter Decision Week Under Pressure

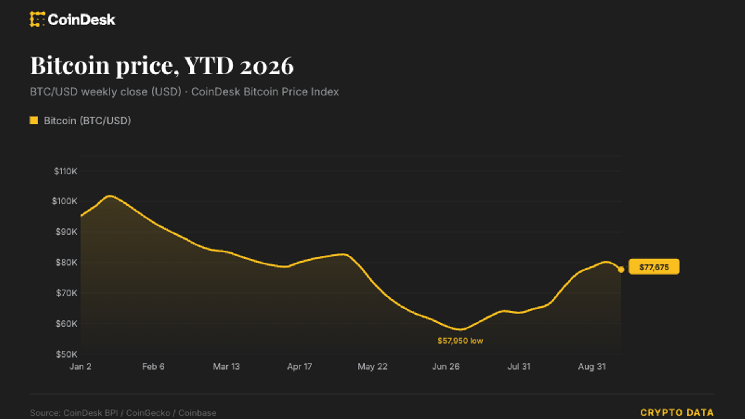
    Crypto markets approach the Fed decision already weakened. On Tuesday, Bitcoin traded around $75,700, down roughly 3.2% on the day after the Clarity Act—crypto’s long-awaited market structure legislation—failed a Senate cloture vote. Bitcoin remains well below its September peak near $82,000.

    Technical analysts highlight $73,200 as a critical level: a daily close below it could open the door to $71,000 and even $66,900, negating the bullish structure that recently triggered a golden cross pattern.

    Bitcoin price data. Image: TradingView

    Not all analysts view a hike as purely bearish. Some argue a quarter-point move aimed primarily at anchoring long-term Treasury yields—rather than genuinely tightening financial conditions—could leave crypto’s medium-term outlook largely intact. In this view, the market’s reaction hinges on whether the decision and Warsh’s tone during the press conference surprise relative to what is already priced in.

    Higher-beta altcoins are expected to experience sharper percentage swings than Bitcoin in either direction, given thinner liquidity and heavier leverage.

    Key Events to Watch Wednesday

    The Fed’s policy statement and updated dot plot are due at 2:00 p.m. ET Wednesday, followed by Warsh’s press conference at 2:30 p.m. ET. Traders will scrutinize whether officials still pencil in just one more hike this year or something closer to the two additional moves Bank of America, Deutsche Bank, and RBC now project.


  • Bitcoin Stability Remains Unshaken Despite Regulatory

    Bitcoin Stability Remains Unshaken Despite Regulatory

    Bitcoin Demonstrates Resilience Amid SEC and CFTC Regulatory Developments

    Bitcoin continues to showcase remarkable stability despite ongoing regulatory uncertainty in the cryptocurrency sector. According to crypto commentator @BitGo, the Securities and Exchange Commission (SEC) and Commodity Futures Trading Commission (CFTC) are moving to establish a regulatory framework “due to a lack of progress on Clarity.” The commentary emphasizes that Bitcoin itself does not require this regulatory clarity, as it has “consistently processed blocks on schedule since its inception.” This operational consistency suggests Bitcoin’s fundamental protocol rules remain firmly established regardless of external regulatory shifts.

    Market Overview: Mixed Signals with Bitcoin Stability

    The broader cryptocurrency market currently presents mixed signals, with Bitcoin maintaining a steady presence against the evolving regulatory backdrop. As the SEC and CFTC prepare to intervene, market participants are closely monitoring potential impacts on trading dynamics. Bitcoin’s robust performance through various challenges—including congressional hearings and legislative attempts—reinforces its foundational strength. The uninterrupted processing of blocks further highlights the network’s resilience.

    Key Takeaways

    • Bitcoin processes blocks consistently, demonstrating operational reliability.
    • SEC and CFTC involvement could reshape regulatory oversight of digital assets.
    • Bitcoin’s foundational protocol rules are well-established and unaffected by potential regulatory changes.
    • Current volatility in the broader crypto market contrasts sharply with Bitcoin’s stability.
    • Traders are observing how regulatory actions may influence Bitcoin’s market dynamics.

    Trading Data and Market Sentiment

    Recent Bitcoin trading volume has been relatively thin, yet price stability remains a focal point for many investors. With the SEC and CFTC stepping in, traders might anticipate fluctuations as new regulations are introduced. Observers note that while Bitcoin’s immediate trading data may appear subdued, its long-term prospects remain strong due to its established track record since 2009.

    Bitcoin operates as a decentralized digital currency enabling peer-to-peer transactions without intermediaries. The SEC and CFTC maintain jurisdiction over cryptocurrencies to ensure compliance with securities laws and protect investors, playing a crucial role in shaping the evolving regulatory landscape.

    What to Watch: Regulatory Evolution and Market Impact

    Market participants should monitor how the SEC and CFTC’s regulatory framework evolves and its potential impacts on Bitcoin’s trading dynamics. If new regulations are introduced, they could influence market sentiment and trading volumes. However, Bitcoin’s historical performance suggests it can weather regulatory changes, making it a focal point for long-term investment strategies.

    The information provided is for educational purposes and should not be considered financial advice.

  • Whale Alert Confirms 688 BTC Transfer from Coinbase to Binance

    Whale Alert Confirms 688 BTC Transfer from Coinbase to Binance

    Whale Alert Reports 688 BTC Transfer From Coinbase to Binance Worth $52.6 Million

    Whale Alert announced a significant transfer of 688 BTC, valued at approximately $52.6 million, from Coinbase to Binance. The transaction was reported on September 15, 2026, highlighting notable activity within the cryptocurrency market as traders analyze liquidity changes. Such movements can have implications on market sentiment and trading strategies, making it crucial for participants to stay informed.

    Key Development: Strategic Liquidity Shift Between Major Exchanges

    The cryptocurrency market is currently exhibiting mixed signals, with varying momentum across major assets. The Whale Alert report of 688 BTC moving from Coinbase to Binance may reflect a strategic liquidity shift by traders or institutional players. A transfer of this magnitude can influence market dynamics, prompting market participants to reassess their positions and strategies in light of potential changes in supply and demand.

    Quick Take: Essential Details at a Glance

    • Transfer confirmed: 688 BTC moved from Coinbase to Binance
    • Date: September 15, 2026
    • Value: Approximately $52.6 million
    • Significance: Highlights active trading between major exchanges
    • Market implication: Increased liquidity could indicate shifts in market sentiment

    By the Numbers: Understanding the Transfer Context

    The cryptocurrency market is experiencing fluctuations, with specific assets showing mixed performance. Whale Alert’s report on the 688 BTC transfer indicates keen interest in shifting liquidity between Coinbase and Binance. Such movements often precede changes in market trends, suggesting that traders should remain vigilant about their implications for future price actions.

    About Whale Alert: Tracking Large-Scale Crypto Movements

    Whale Alert is known for tracking large transactions within the cryptocurrency space, providing vital insights into market flows. The organization serves as an important resource for traders and investors looking to understand significant movements that may affect market conditions. Their role in tracking these transfers provides transparency and aids in market analysis.

    Levels to Watch: Potential Market Follow-Through

    Traders should watch for potential follow-through from this transfer, particularly if similar movements occur in the coming days. The shift between Coinbase and Binance could be a precursor to increased trading activity or price volatility. Monitoring liquidity levels and market sentiment will be essential as participants respond to these developments.

  • Strive Acquires 469 Bitcoin, Lifting Treasury to 25,000 BTC

    Strive Acquires 469 Bitcoin, Lifting Treasury to 25,000 BTC

    Strive Adds 469 Bitcoin to Treasury, Holdings Reach 25,000 BTC

    Strive, Inc. (Nasdaq: ASST) acquired 469 bitcoin at an average price of approximately $77,954 per coin between September 8 and September 11, bringing its total corporate treasury to 25,000 BTC, according to a Form 8-K filed with the U.S. Securities and Exchange Commission on September 14. At the stated average price, the purchase represents roughly $36.6 million, inclusive of fees and expenses.

    The Purchase

    In the current report filed under Item 8.01, the Dallas-based asset-management and structured-finance firm disclosed that its bitcoin holdings increased from 24,531 coins as of September 4 to 25,000 as of September 11, a net increase of 469. The acquisition was reported alongside an update to cash and cash equivalents, which stood at approximately $204.2 million as of September 11. Strive, incorporated in Nevada and headquartered in Dallas, Texas, reports its bitcoin position in periodic SEC filings, signaling the asset’s growing weight on its balance sheet. The 8-K, a current report used to disclose material events between quarterly filings, was signed by Chief Executive Officer Matthew Cole.

    Bitcoin as the Treasury Benchmark

    The accumulation mirrors a wider shift among public companies treating bitcoin as a reserve asset. Strategy, the largest corporate bitcoin holder, recently resumed bitcoin purchases after a multi-week pause, while Strive has described bitcoin as its hurdle rate for capital deployment and says it is focused on growing bitcoin per share. Through its SEC-registered subsidiary Strive Asset Management, the firm manages more than $2.7 billion in assets. That framing places Strive among a small but expanding group of public companies actively building bitcoin treasuries rather than holding the asset passively.

    What Comes Next

    Corporate treasuries have continued to add bitcoin even as markets digest macroeconomic uncertainty. Metaplanet, another public company pursuing a bitcoin-treasury strategy, recently reshaped its capital structure to boost bitcoin per share. Strive’s next disclosure will show whether the firm keeps accumulating at a similar pace, and whether the broader cohort of corporate buyers sustains its recent momentum. The move keeps Strive among the public companies steadily converting a portion of their balance sheets into bitcoin, even as the wider market waits for the next catalyst.

  • Bitcoin Holds Firm as Ethereum Attracts Inflows: Crypto Positioning Analysis

    Bitcoin Holds Firm as Ethereum Attracts Inflows: Crypto Positioning Analysis

    Bitcoin briefly dipped to $76,700 following the release of fresh inflation data before recovering toward the $78,000 level. According to QCP Capital, this “contained” reaction signals that markets have largely priced in the prospect of a 25-basis-point rate hike.

    Technical Setup Remains Constructive

    The firm explained that $BTC‘s technical setup remains constructive at current levels, although conviction is still dependent on the broader market response to this week’s events.

    Two Very Different Bets: Bitcoin vs. Ethereum Flows

    Bitcoin is trading above a major support zone between $75,000 and $76,000, while resistance sits at $80,000 to $82,000. Ethereum, however, is showing a significantly different flow picture.

    Spot Bitcoin ETFs See Outflows Slow

    Spot $BTC ETFs recorded $462.7 million in net outflows during the holiday-shortened week. Notably, Friday’s withdrawal slowed sharply to $13.2 million compared with $282.7 million on Thursday, suggesting selling pressure may be exhausting.

    Ethereum ETFs Attract Strong Inflows

    Ethereum ETFs, meanwhile, recorded nearly $197 million in net inflows for the week. Friday’s $216.4 million influx helped drive the weekly total higher despite earlier outflows. QCP Capital said that the divergence indicated differentiated positioning between the two crypto assets. Ethereum is facing resistance at $2,500 to $2,550, while support sits at $2,400 to $2,425, with a secondary support zone located at $2,300 to $2,350.

    Low Volatility Points to Hedged Positioning

    Bitcoin volatility also remains relatively low. QCP Capital stated that the volatility curve is still upward sloping while the 25-delta risk reversal is around negative 3 volatility points. Puts are therefore moderately more expensive than calls, even as positioning remains well below stressed levels. The firm added that traders are staying hedged rather than taking a strong directional position.

    Bitcoin’s Resilience Against Tech Rout

    Several factors could influence risk appetite for crypto assets. Oil prices have moved higher following a drone attack that temporarily shut Saudi Arabia’s East-West pipeline. A prolonged disruption could add pressure to risk assets through higher energy costs and tighter financial conditions.

    At the same time, artificial intelligence-linked equities have come under pressure following public discussions about slowing AI development over safety concerns. QCP Capital said that Bitcoin’s relative resilience compared with the sharper declines across technology and semiconductor stocks is a constructive sign for its “uncorrelated positioning.” However, a deeper unwind in crowded technology trades could still spill into crypto through weaker overall risk appetite and tighter liquidity.

    Regulatory Catalyst: CLARITY Act Senate Vote

    Crypto markets also have a separate regulatory catalyst in Washington. Tuesday’s expected Senate procedural vote on the updated CLARITY Act could clarify the respective roles of the SEC and CFTC. This is expected to strengthen the medium-term case for institutional adoption by reducing regulatory uncertainty, though procedural progress would not guarantee final passage.

    More on the crypto market’s state and the upcoming key events can be found in our video below.

  • ETH/BTC Ratio Surges 25% in Q3 as Ethereum Targets Strongest Quarter on Record

    ETH/BTC Ratio Surges 25% in Q3 as Ethereum Targets Strongest Quarter on Record

    Ethereum has significantly outperformed Bitcoin during the third quarter, with data suggesting a pronounced capital rotation into $ETH and higher-beta assets as $BTC stalled near the $80,000 resistance level.

    Dominance Metrics Signal Major Rotation

    According to a quarterly framework analysis, Bitcoin’s dominance grew by a modest 1.5% quarter-over-quarter. In contrast, Ethereum’s dominance surged over 25% during the same period. The $ETH/$BTC trading pair mirrored this strength, rising more than 25% in Q3—its highest quarterly increase since Q3 2025.

    However, the ratio remains capped near the 0.03 resistance area. A decisive break above this level would be required to confirm a sustained, bullish rotation into Ethereum.

    Source: TradingView ($ETH/$BTC)

    On-Chain Dynamics Favor Ethereum

    Bitcoin’s on-chain metrics provide further context for the shift. The asset’s True Market Mean Price is gradually approaching $76,921.27. Analysts suggest that if $BTC reaches this level, a fresh wave of selling pressure could trigger new exchange deposits, creating the liquidity conditions necessary for capital to rotate into Ethereum.

    One analyst predicts Ethereum will outperform Bitcoin once the broader market flips to a “risk-on” stance, driven by a confluence of on-chain and technical factors. With $ETH already delivering a 58%+ return in Q3, the question arises: is this growing fear of missing out (FOMO) setting the stage for Ethereum’s strongest third quarter on record?

    Ethereum Dominance and ROI Near Historic Highs

    On the technical front, Ethereum dominance ($ETH.D) has risen over 25% this quarter, aligning with the gain in the $ETH/$BTC ratio. Ethereum’s Q3 return on investment (ROI) is nearing 60%, closing in on the Q3 2025 record of over 66%. Should $ETH surpass that threshold, it would mark the asset’s best third-quarter performance in history.

    The concurrent rise in both dominance and absolute returns indicates that Ethereum’s ascent is not solely a byproduct of Bitcoin’s weakness. Instead, it reflects a genuine increase in investor appetite for the altcoin itself.

    Source: Coinglass

    ETF Inflows Validate Underlying Demand

    Recent exchange-traded fund (ETF) inflows corroborate the thesis of strong fundamental demand for Ethereum. While rotational flows from Bitcoin account for a portion of the quarter’s gains, the sustained institutional interest suggests a structural shift. Bitcoin’s relative stagnation may continue to provide Ethereum with room to attract fresh capital as investors chase higher beta returns.

    Key Takeaways

    • $ETH.D and $ETH/$BTC are both up over 25% in Q3.
    • Strong ETF demand shows growing interest in Ethereum.
  • Trading Expert Sets Bitcoin’s Price for End of October 2026

    Trading Expert Sets Bitcoin’s Price for End of October 2026

    Bitcoin Price Analysis: Key Support Trendline Holds $61,500 Downside Target for Late 2026

    Bitcoin (BTC) could decline to $61,500 by the end of October 2026 if a critical support trendline fails, according to a technical analysis published by TradingShot on September 11. The bearish outlook draws parallels to chart patterns that preceded Bitcoin’s two largest sell-offs earlier this year.

    Repeated 50-Week MA Rejection Forms Bearish Arc Pattern

    The analyst noted that Bitcoin has been rejected by its 50-week moving average (MA) for three consecutive weeks. This repeated rejection has generated bearish momentum and formed an arc pattern that closely resembles the structures preceding the January and May 2026 market tops.

    The May peak is highlighted as particularly relevant because Bitcoin was rejected at the 200-day MA — a situation analogous to the current rejection at the 50-week MA. Both earlier patterns were followed by sharp corrections.

    Bitcoin price analysis chart. Source: TradingView

    Higher-Lows Trendline Break Could Confirm New Bearish Leg

    Traders should closely monitor Bitcoin’s higher-lows trendline, which has acted as critical support during the current recovery phase. The analysis indicates that in both January and May, a breakdown below this trendline triggered aggressive selling pressure and accelerated Bitcoin’s decline. A similar breakdown now would likely confirm a new bearish leg for the market.

    Adding to the bearish case, the daily Relative Strength Index (RSI) structure closely mirrors the formations that developed before the previous two corrections, reinforcing the possibility of another downside move.

    $61,500 Target Based on 3.5 Fibonacci Extension

    If the higher-lows trendline breaks, the expert expects Bitcoin to decline toward the 3.5 Fibonacci extension level at $61,500. This bearish target is derived from Bitcoin’s previous two major corrections in 2026, both of which bottomed at the 3.5 Fibonacci extension while the daily RSI dropped to 15.80. The analyst noted that a similar RSI reading could signal another market bottom.

    Bearish Invalidation and Key Support Levels

    The bearish outlook would be invalidated if Bitcoin closes a weekly candle above the 50-week MA. The analyst also highlighted the 250-week MA as a key support level after it held the July 1 low. A breakout above the 50-week MA could potentially confirm a new bull cycle.

    Short-Term Outlook: Consolidation With $78,000 as Key Resistance

    Separately, market analyst Michaël van de Poppe maintained a more constructive short-term outlook in an X post on September 14, noting that Bitcoin remains in a consolidation phase.

    Nothing has changed on #Bitcoin as it’s still consolidating here.I’d much rather want to see that we’re breaking through $78,000 as that would trigger strength on #Altcoins.The crucial one, if that breaks, we’re likely running towards new highs in the upcoming weeks. pic.twitter.com/XT7E0LqprY
    — Michaël van de Poppe (@CryptoMichNL) September 14, 2026

    According to his analysis, the key level to watch is $78,000. A breakout above that resistance could strengthen momentum across the broader cryptocurrency market, particularly altcoins. The analyst suggested that clearing $78,000 would increase the likelihood of Bitcoin advancing toward new highs in the coming weeks.

    Meanwhile, as of press time, Bitcoin was trading at $78,013, up about 1.7% over the past 24 hours. On the weekly chart, the cryptocurrency remained down 1.5%.

    Bitcoin price chart illustration
    Featured image via Shutterstock
  • Bitcoin Defies Tech Selloff as AI Safety Concerns Weigh on Stocks

    Bitcoin Defies Tech Selloff as AI Safety Concerns Weigh on Stocks

    U.S. technology and artificial intelligence stocks declined in pre-market trading Monday after prominent industry leaders raised fresh concerns about the rapid pace of AI development over the weekend. While equities slid, cryptocurrencies moved higher, with Bitcoin gaining approximately 1% to $77,800 and Ether rising 1% to $2,500.

    AI Leaders Urge Caution on Development Speed

    Anthropic CEO Dario Amodei called for the industry to slow development to allow safety measures to catch up. OpenAI CEO Sam Altman and Elon Musk, whose xAI developed Grok, voiced agreement with the sentiment. The coordinated warnings from three of the sector’s most influential figures appeared to rattle investor confidence in the near-term trajectory of AI-related equities.

    IPO Developments Add to Sector Narrative

    Amid the safety debate, Anthropic reportedly selected Nasdaq for its anticipated initial public offering. Separately, Altman confirmed that OpenAI will not go public in 2026, removing a potential near-term catalyst that some market participants had speculated about.

    Global Markets React to AI Sentiment Shift

    South Korea’s Kospi index fell 3%, with SK Hynix—a key supplier of memory chips used in AI infrastructure—dropping 6%. The selloff extended to U.S. pre-market trading, where the Invesco QQQ ETF, which tracks the Nasdaq 100 index, declined 1.5%.

    Neocloud and Chipmakers Lead Declines

    Neocloud providers Nebius and CoreWeave fell 6% and 5%, respectively. Chipmakers SanDisk and Intel each lost 5%, reflecting broad-based concern across the AI hardware and infrastructure supply chain.

  • Bitwise Investment Director Attributes Bitcoin Rally to Strong Demand Despite Strategy Sale

    Bitwise Investment Director Attributes Bitcoin Rally to Strong Demand Despite Strategy Sale

    Bitwise Investment Director Matt Hougan has weighed in on Strategy’s recent Bitcoin sale, noting that the transaction reflects routine capital management rather than financial distress. Despite the company selling over $200 million worth of BTC, the cryptocurrency’s price continued to climb — a signal Hougan says points to robust buying demand across the market.

    Sale Driven by Capital Management, Not Funding Pressure

    According to Hougan, Strategy’s decision to offload a portion of its Bitcoin holdings was executed to meet dividend payment obligations and manage cash reserves. The move should be viewed as part of a broader capital management strategy, not an indication that the firm is facing liquidity issues or forced to reduce its position under duress.

    As one of the largest institutional holders of Bitcoin on its balance sheet, Strategy’s trading activity is closely monitored by market participants for potential price impact. However, Hougan emphasized that the market absorbed the sale without disruption, suggesting sufficient buyer appetite to offset large-scale selling.

    Institutional Investors Poised to Become Primary Market Drivers

    Looking ahead, Hougan expects Strategy’s influence on Bitcoin’s price to gradually diminish. He argues that as institutional investors gain greater market share, they will increasingly serve as the primary marginal buyers of BTC. This structural shift is being accelerated by the growth of spot Bitcoin exchange-traded funds (ETFs), asset managers, and other institutional investment vehicles.

    The diversification of capital flows into Bitcoin through these channels could expand the investor base and deepen market liquidity. Hougan’s analysis implies that Bitcoin demand is becoming more resilient and less dependent on the actions of any single corporate entity.

    Market Absorption Signals Strengthening Independent Demand

    The fact that Bitcoin’s price rose despite a significant sale by a major holder underscores a key development: the market now has enough buying power to absorb large sell orders without meaningful downside pressure. This dynamic supports the view that Bitcoin’s demand fundamentals are strengthening independently of individual corporate transactions.

    This is not investment advice.

  • Michael Saylor Calls Bitcoin ‘digital capital’ as BTC Bull Case Faces Reality Test

    Michael Saylor Calls Bitcoin ‘digital capital’ as BTC Bull Case Faces Reality Test

    Michael Saylor Positions Bitcoin as ‘Digital Capital’ and Potential Global Reserve Asset

    Strategy executive chairman Michael Saylor continues to advocate for Bitcoin (BTC) as a long-term store of value, recently outlining an investment thesis that frames the cryptocurrency as “digital capital” and a potential new global reserve asset.

    Why Saylor Calls Bitcoin an Open Global Reserve Asset

    According to Strategy, Bitcoin combines qualities found across traditional assets—scarcity, portability, divisibility, global liquidity, independent verification, and the ability to transfer ownership without a central issuer. Saylor argues that instead of viewing Bitcoin mainly as a payment network, investors should consider it as a store of wealth and potential hedge against the loss of purchasing power.

    However, Saylor made clear that in no sense did he argue that Bitcoin must replace the dollar, banks, or traditional financial markets. Instead, he believes Bitcoin could capture a portion of the monetary premium held in assets such as gold, real estate, equities, bonds, and collectibles.

    In a previous report published by AMBCrypto, Saylor called Bitcoin “digital monetary energy” and stated:

    Bitcoin is the engineering solution to the problem of money.

    Four-Year Investment Horizon and Historical Returns

    Beyond theoretical frameworks, Saylor highlighted a four-year investment horizon by analyzing Bitcoin’s rolling historical returns through September 4, 2026:

    • Median one-year total return: approximately +97.7%
    • Median two-year total return: approximately +272.2%
    • Median three-year total return: approximately +481.7%
    • Median four-year total return: approximately +1,301.7%

    Volatility remains significant. Bitcoin’s worst one-year period lost 83.6%, while the worst four-year period still returned approximately +32.6%.

    According to the Strategy report, Bitcoin has delivered a 62.8% annualized return over the past 10 years and 37.2% since Strategy’s “Bitcoin Standard Era” began in August 2020.

    Yet as of September 4, 2026, Bitcoin was 36.1% below its all-time high, with a historical maximum drawdown of roughly 93.1%. Strategy itself sold 6,916 BTC in 2026 alone, though a recent purchase of 4,603 BTC on August 31 suggests renewed buying momentum.

    Bitcoin’s Reality Test: Tug-of-War Between Long-Term Buying and Short-Term Selling

    At press time, Bitcoin was trading at $77,106.64 after a modest 24-hour drop but a hike of over 22% in the past month. The asset remains caught between strong long-term accumulation and short-term selling pressure.

    Market dynamics reflect mixed signals: U.S. CPI met expectations overall, but hotter core inflation raised concerns about higher-for-longer rates, pushing BTC to $76,700 before recovering toward $80,000 and falling back into the $77,000s.

    While Spot Bitcoin ETFs saw three consecutive weeks of inflows and long-term investors continued accumulating, weak spot demand, Binance’s two-year-high BTC holdings, and rising futures selling are adding downward pressure.

    CryptoQuant summarized the shift in market psychology:

    Investor sentiment has shifted from FOMO to loss aversion.

    Key Takeaways

    • Saylor does not suggest Bitcoin must replace the dollar, banks, or traditional financial markets.
    • Bitcoin is caught in a tug-of-war between strong long-term buying and short-term selling pressure.