Category: Coins

Digital assets, cryptocurrencies, blockchain, and currency news.

  • Crypto Market’s Weekly Winners and Losers: VET, RAIN, STABLE, and ARB

    Crypto Market’s Weekly Winners and Losers: VET, RAIN, STABLE, and ARB

    Crypto markets remained largely range-bound during the week following Bitcoin’s strong rebound in the final week of August. Bitcoin failed to break above $80,000, while mixed performance across the wider market reflected profit-taking among traders.

    At the same time, capital continued rotating into selected altcoins, helping support the total cryptocurrency market value.

    Weekly Crypto Market Winners

    VeChain [$VET] Still Has Room to Rise

    VeChain [$VET] was the clear winner of the week, surging 25% and climbing above $0.07 for the first time since mid-May. Given the renewed fear of missing out (FOMO), the rally could have further room to extend.

    Technical indicators also support the recent strength. VeChain continued this week’s advance after posting a 30% rally last week, taking its total gain above 50% in less than 14 days. This sharp move raises the possibility of significant profit-taking, particularly as short-term holders (STHs) are now sitting in profit.

    However, the Relative Strength Index (RSI) remains below the overbought zone. This suggests that despite VET’s strong performance, the cryptocurrency has not yet reached an excessively extended level that would typically signal a major correction.

    Source: TradingView ($VET/$USDT)

    With strong FOMO, profitable short-term holders and a relatively compressed RSI, VET could potentially break through the $0.08 threshold. If that happens, the token could continue higher on its current bullish momentum before profit-taking pressure from short-term holders intensifies.

    Rain [$RAIN] Has Reached an Overextended Level

    Rain [$RAIN] ranked second among the week’s biggest gainers after rising 22%. Unlike VET’s more bullish market structure, RAIN’s setup appears more volatile, with the altcoin now recording four consecutive weeks of gains.

    The move has pushed the weekly RSI into overextended territory, a pattern that previously preceded a sharp correction during the mid-June cycle. With the broader market still consolidating, capital could continue flowing into RAIN.

    If the trend continues, a move toward $0.02 could become possible. However, the rally is unlikely to move in a straight line. RAIN could experience short-term relief before attempting another breakout, making HOLD the more suitable approach for now.

    Solana [$SOL] Shows Bullish Continuation

    Solana [$SOL] was the third-biggest weekly winner, gaining 10% after rising 28% during the previous week’s trading. Notably, SOL continues to outperform other large-cap cryptocurrencies.

    This divergence suggests that SOL’s rally may be driven by more than broad altcoin rotation and could instead reflect “Solana-specific” bullish momentum. That makes the divergence an important factor to monitor. The RSI has also not yet entered overextended territory.

    Against this backdrop, a move toward $110 appears increasingly likely in the near term, placing SOL among the large-cap cryptocurrencies to watch during the remainder of the third-quarter cycle.

    Other Notable Weekly Winners

    Outside the major cryptocurrencies, several tokens posted substantial gains. Pons [PONS] led the market with a 543% surge, followed by Bitlayer [BTR], which gained 540%, and The Index [INDEX], which climbed 327%.

    Weekly Crypto Market Losers

    Stable [$STABLE] Could Face a Deeper Correction

    Stable [$STABLE] led the week’s declining altcoins, falling 13%. The sell-off pushed the token below $0.03 and erased all of the gains recorded after the April market cycle.

    STABLE is now approaching the critical $0.02 support level that triggered a 50% rebound in April, followed by five consecutive weeks of gains. With profit-taking increasing, a similar recovery remains possible.

    However, the RSI remains well above oversold territory, indicating that STABLE still has room to decline before buyers return. For now, $0.02 is the key level to watch for a potential reversal.

    Source: TradingView ($STABLE/$USDT)

    If bulls defend the $0.02 support, STABLE could establish another rebound and potentially revisit $0.03. If the RSI remains away from oversold conditions, however, the altcoin could extend its decline until it reaches a more attractive reversal area.

    Arbitrum [$ARB] Approaches a Critical Inflection Point

    Arbitrum [$ARB] was the second-biggest weekly loser, declining 11%. Its price structure is similar to STABLE’s, with the correction following a 37% rally last week as a broader risk-off mood returned to the market.

    Bears have pushed ARB well below the key $0.105 resistance level, pointing to further downside risks in the near term. The RSI also remains far from oversold conditions, suggesting that additional short-term declines are possible.

    With the $0.07 support level now under pressure, further failures to hold above it could trigger another wave of selling and lead to additional weakness. Conversely, if bulls defend this support, ARB sellers may retreat, allowing for a short-term price rebound.

    Bitway [$BTW] Could Be in a Textbook Accumulation Zone

    Bitway [$BTW] recorded the third-largest weekly decline, slipping 3%. Although the move appears bearish on the surface, the shallow correction could offer a more constructive interpretation. BTW pulled back after posting six consecutive weeks of gains.

    The extended rally pushed the RSI to an overbought reading of 90. However, the token gave back only 3% over the past week. This suggests that investors may not be as bearish as expected and that FOMO remains present in the market.

    Under these conditions, BTW could develop an accumulation zone around its current price. If bulls maintain the token’s current value, it could quickly move toward the $0.5 level.

    Other Notable Weekly Losers

    The downside of the market also produced several steep declines. Velvet [VELVET] led losses with an 84% drop, followed by Tutorial [TUT], which fell 45%, and The Interfold [FOLD], which declined 40% as bullish momentum rapidly faded.

    Crypto Market Outlook

    It was a volatile week for the cryptocurrency market, with major pumps and dumps across both large-cap and smaller altcoins. Traders should remain cautious, conduct their own research and manage their trades carefully.

    Final Summary

    • VeChain [$VET], Rain [$RAIN], and Uniswap [UNI] led the week in gains.
    • Stable [$STABLE], Bitway [$BTW], and Arbitrum [$ARB] recorded significant declines.
  • Solana Breaks 10-Month Slump as Institutional Investment Surges

    Solana Breaks 10-Month Slump as Institutional Investment Surges

    Solana traded near $106 on Sunday afternoon after reaching $110.38 on Aug. 27, its highest price since late January. $SOL has gained roughly 46% this month and is about 80% above its June low, pushing Solana’s market value back toward $61 billion.

    Institutional Money Starts Chasing Solana

    The rally ended 10 consecutive monthly declines and gave Solana its strongest month since 2024. However, $SOL remains well below its January 2025 all-time high ($ATH) near $293, making August a comeback rather than a period of price discovery. Solana would need to rise another 63.5% to reclaim that record.

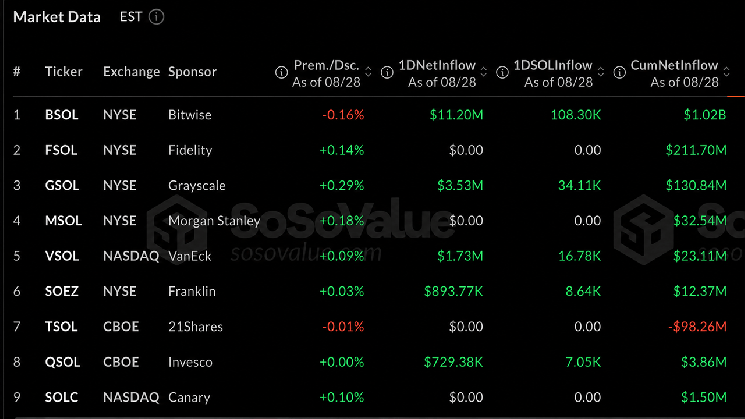
    Regulated investment products have provided a visible source of buying demand. U.S. spot Solana exchange-traded funds (ETFs) have attracted roughly $1.34 billion in cumulative net inflows since launching in October 2025, according to data from sosovalue.com. Bitwise’s BSOL Solana fund, which also operates as a staking ETF, has surpassed $1 billion in assets under management.

    Solana ETF statistics via sosovalue.com on Sunday, Aug. 30, 2026.

    Another major distribution channel is also approaching. On Aug. 27, Charles Schwab announced plans to add spot $SOL, avalanche (AVAX) and chainlink (LINK) to Schwab Crypto in the coming months. Schwab oversees more than $12 trillion in client assets across approximately 39 million brokerage accounts.

    Corporate buyers are entering the market as well. Defi Development Corp. purchased 19,000 $SOL at an average price of $98.14, increasing its holdings to approximately 2.33 million $SOL. Goldman Sachs also disclosed roughly $88 million in Solana ETF exposure in its latest regulatory filing.

    Solana Governance Vote Could Tighten Future Supply

    Solana has completed its first binding onchain governance vote. SGP-0002, dubbed “Double Disinflation,” passed with 67% support from participating stakeholders, narrowly exceeding the required two-thirds threshold.

    The proposal doubles Solana’s annual disinflation rate from 15% to 30%. In practical terms, new $SOL will enter circulation at a much slower rate sooner, while the network retains its eventual 1.5% inflation floor. Estimates suggest the change could reduce issuance by roughly 18.9 million $SOL over six years.

    The impact will not be immediate. Developers must still complete the software work and activate the policy across the network, making implementation the next key checkpoint for traders monitoring Solana’s future supply.

    Record Network Traffic Tests Solana’s Capacity

    The price rally also coincided with heavy network activity. The Kobeissi Letter reported on Aug. 25 that Solana processed a record 4.2 billion transactions in July, 13.5% more than in June and roughly 91% above December 2025 levels. Between Aug. 17 and Aug. 23, the network processed approximately 1.32 billion non-vote transactions, setting another weekly record.

    Blockworks data image showing Solana’s transfer count via The Kobeissi Letter’s X post on Aug. 25.

    Additional capacity is already scheduled. Transaction V1, planned for Sept. 9, will increase the maximum transaction size from 1,232 bytes to 4,096 bytes, giving applications considerably more space to package data within individual transactions.

    Storage costs could also decline. Solana’s planned rent reduction may eventually cut the deposit required to store data onchain by 90%, lowering expenses for developers building token accounts, non-fungible tokens and tokenized real-world assets.

    September Could Determine Whether Solana’s Rally Continues

    Leverage amplified August’s move, with more than $16 million in Solana short positions liquidated during the breakout toward $109, according to Coinglass.com derivatives data. Forced buying can accelerate a rally, but the same mechanism can intensify losses when momentum reverses.

    September will present a more difficult test. $SOL traders will monitor the first rent reduction, the Transaction V1 upgrade on Sept. 9, faster transaction times and progress toward the planned Alpenglow consensus upgrade in October. These milestones could help determine whether August marked the beginning of a larger Solana recovery or simply produced the token’s sharpest rebound in nearly a year.

    Feature and hero image via sosovalue.com metrics.

  • DeFi Sector Surges 38% as US Policy Shift Unlocks Token Value Capture

    DeFi Sector Surges 38% as US Policy Shift Unlocks Token Value Capture

    DeFi tokens have risen nearly 38% since August 17 as investors reassess how evolving US crypto policy could affect protocol revenue and token valuations.

    SoSoValue said the rally is bringing decentralized finance closer to a market in which fees, token buybacks and on-chain activity play a larger role in determining value.

    US Crypto Policy Shift Supports DeFi Rally

    In a post on X, SoSoValue said its DeFi sector index, $DEFI.ssi, climbed from 0.3616 on August 17 to approximately 0.498 after reaching 0.511. The move represents a cumulative gain of about 37.7%.

    The rally coincided with recoveries in Bitcoin and Ethereum, as well as broader short covering. However, the research firm said investors are also reconsidering whether mature DeFi protocols can return more of their revenue to tokenholders.

    That question has constrained DeFi valuations for years. Protocols have generated substantial trading fees, lending income and other revenue, while tokenholders often had little direct claim on those economics.

    Fee distributions and token buybacks have also raised potential securities-law concerns in the United States. As a result, many protocols have been reluctant to activate mechanisms that connect revenue directly to their tokens.

    That situation could be changing. Last week, the SEC proposed its “Regulation Crypto Assets” framework, which includes exemptions and a conditional safe harbor for certain crypto-asset offerings.

    Under the proposal, a token may no longer remain part of an investment contract after a project completes or permanently stops the essential managerial work it had promised to perform.

    US Legislation Could Expand DeFi Tokenholder Rewards

    The Senate’s CLARITY Act draft goes further by proposing protections for noncontrolling developers, validators, node operators, oracle providers and self-custody wallet software.

    The draft also leaves room for rewards tied to trading, staking, governance and liquidity provision. It still requires 60 votes in the Senate, while the SEC proposal remains subject to public comment.

    Even so, SoSoValue said markets are already expressing greater confidence in the direction of US crypto policy, despite the lack of complete legal certainty.

    You may also like:

    • Aave Deprecates 50 Low-Adoption Assets and Winds Down Six Chain Deployments
    • Flare Simplifies DeFi for XRP Holders With Smart Accounts Upgrade
    • DEX Aggregator Odos is Shutting Down: What Users Need to Do Before July 30

    Protocol Revenue and Buybacks Strengthen DeFi Valuations

    The valuation case for DeFi tokens becomes more compelling when protocol revenue is considered. Uniswap generated approximately $7.18 million over the past 30 days, followed by PancakeSwap with $5.16 million, Jupiter with $4.69 million, Aave with $4.12 million and Aerodrome with $4.11 million.

    Several of these protocols now have mechanisms that connect their revenue to their tokens. Hyperliquid, for example, uses part of its trading fees to buy HYPE. Uniswap has linked revenue to UNI burns, while Jupiter allocates 50% of protocol fees to JUP purchases. PancakeSwap also directs part of its fees toward CAKE buybacks and burns.

    Ethena has proposed an even larger allocation. Once USDe reaches its stated supply threshold, 95% of the net revenue paid to the foundation across its three core business lines would be used for ENA buybacks.

    According to SoSoValue, the next phase of the DeFi token rally will depend on whether protocol revenue continues to grow and whether tokenholders receive a larger share of those economics.

  • Bitcoin ETFs End Nine-Day Inflow Streak as Ethereum Funds Extend Their Run

    Bitcoin ETFs End Nine-Day Inflow Streak as Ethereum Funds Extend Their Run

    U.S. spot Bitcoin exchange-traded funds recorded $201.9 million in net outflows on Aug. 28, ending a nine-day inflow streak and reducing cumulative net inflows to approximately $55.1 billion. Ethereum ETFs continued to attract investor capital, recording $102.1 million in inflows and extending their own streak to 10 consecutive days.

    Bitcoin ETFs reverse after strong inflow streak

    U.S. spot Bitcoin ETFs broke a nine-day winning streak on Friday as investors withdrew money while Ethereum ETFs continued to pull in fresh capital.

    According to SoSoValue data, the Bitcoin funds posted $201.9 million in net outflows on Aug. 28. The reversal ended a run of consecutive inflows that had continued since mid-August, lowering cumulative net inflows to about $55.1 billion. The funds held approximately $93.9 billion in total net assets. Decrypt’s ETF flow tracker changed its Bitcoin sentiment reading to “bearish” on the day.

    Myriad: Bitcoin’s next price move? Click to make your prediction.

    An exchange-traded fund, or ETF, is an investment vehicle that holds an underlying asset and trades on a traditional stock exchange. It allows investors to buy and sell shares through a standard brokerage account. A spot Bitcoin ETF holds Bitcoin directly, with each share representing a claim on a portion of the fund’s holdings. This structure gives investors indirect exposure to Bitcoin’s price without requiring them to purchase the cryptocurrency themselves.

    The convenience of spot Bitcoin ETFs has helped attract traditional and institutional investors. U.S. spot Bitcoin ETFs launched in January 2024 after years of regulatory rejections and quickly became some of the fastest-growing ETFs in history.

    Daily ETF flows now shift between heavy accumulation and sharp withdrawals as Bitcoin prices and the broader macroeconomic environment change. As a result, market observers closely monitor fund flows as a measure of investor sentiment.

    Bitcoin ETF Net Flows. Image: Decrypt

    Ethereum ETFs extend 10-day inflow streak

    Friday’s pullback followed an otherwise strong period for Bitcoin ETFs. The funds attracted $2.8 billion during an eight-day inflow streak as Bitcoin tested $80,000. They also recorded their largest single-day inflow since May, with daily inflows repeatedly exceeding $300 million and reaching more than $600 million on Aug. 20.

    Ethereum ETFs showed no comparable weakness. The funds brought in $102.1 million on Aug. 28, extending their inflow streak to 10 days, according to SoSoValue. Their cumulative net inflows rose to approximately $12.9 billion, while total net assets reached $13.8 billion.

    Ethereum ETF Net Flows. Image: Decrypt

    Decrypt’s tracker maintained its Ethereum reading at “bullish.” The sustained demand represents a notable shift, with Ethereum products in recent sessions nearly matching or exceeding Bitcoin’s daily inflows despite having a much smaller asset base.

    The divergent ETF flows emerged as Bitcoin declined after Federal Reserve Chair Kevin Warsh delivered hawkish remarks at Jackson Hole. The comments cooled a rally that had pushed Bitcoin toward $80,000, although the cryptocurrency later recovered to around $79,000 over the weekend.

    The single-day Bitcoin ETF outflow remains modest compared with the tens of billions of dollars the funds have accumulated since their launch. The end of a nine-day inflow streak does not necessarily indicate a broader decline in institutional demand, which has remained strong across both Bitcoin and Ethereum.

  • Bitcoin Price Correction: Why BTC Stalled at $78,000 Again

    Bitcoin Price Correction: Why BTC Stalled at $78,000 Again

    Bitcoin rose 26% in less than two weeks to reach $81,455 before stopping at the same price level that ended its previous rally. As of Sunday, 30 August at 11:37 UTC, BTC/USD traded at $78,019 on Bitstamp, down 0.12% on the day.

    Why Did Bitcoin Correct After Reaching $81,000?

    The catalyst was macroeconomic rather than crypto-specific.

    On Friday, 28 August, new Federal Reserve Chair Kevin Warsh delivered his first Jackson Hole keynote. He highlighted PCE inflation running at 3.7% year over year and 4.1% annualised over the previous six months, signalling that the Fed still has more work to do.

    Markets repriced rapidly. September rate-hike odds on CME FedWatch rose to roughly 56% from 35% a day earlier, reaching 60% intraday. Gold fell 2.4%, US equities surrendered their early gains, and Bitcoin dropped from $81,455 to a low of $76,845 before closing near $77,800.

    Forced liquidations intensified the decline. CoinGlass recorded approximately $486 million in liquidations across about 95,731 traders, including $368 million in long positions. Altcoins performed worse, with Ethereum closing at $2,443, down 2.70%; Solana at $104.13, down 4.65%; and XRP at $1.3833, down 4.80%.

    What Do Bitcoin ETF Flows Say About Institutional Demand?

    US spot Bitcoin ETFs recorded $201.81 million in net outflows on 28 August, ending a nine-day inflow streak that had brought nearly $3 billion into the funds since 17 August.

    ARK 21Shares ARKB accounted for $114.9 million of the outflows, followed by Bitwise BITB at $49.7 million and BlackRock IBIT at $33.4 million. Morgan Stanley’s MSBT was among the few funds to attract new money, recording $9.3 million in inflows.

    The distribution of outflows is significant. IBIT’s relatively small share of the redemptions points to profit-taking after a rapid rally rather than a broad institutional exit. August month-to-date inflows remain above $3.1 billion, making it the strongest month of 2026. The funds collectively hold more than one million bitcoin, and the reversal came one day after their combined net assets crossed $100 billion.

    Ether ETFs moved in the opposite direction, adding $102 million on the same day and recording a tenth consecutive session of inflows.

    ETF creations require fund managers to buy spot Bitcoin, while redemptions require them to sell. If outflows continue this week, the market could lose the buying support that helped hold the $80,000 level.

    What Does the Bitcoin Chart Show?

    Bitcoin bottomed near $62,277 in mid-August before moving almost vertically higher. It cleared the 200-day exponential moving average at $72,170 within days and then ran into resistance at $78,670. The price is now sitting near that level without managing to close above it.

    The difficulty is that $78,670 also capped Bitcoin’s early-May rally. At that time, BTC consolidated just below the level for two weeks, failed to break through and fell to the low $60,000s by June.

    The current setup closely resembles that earlier structure, although there is one important difference. In May, the 200-day EMA was above the market and declining. It is now below the price at $72,170 and has begun to flatten.

    Momentum is also cooling. The daily RSI is 71.03, placing it in overbought territory, and it has already fallen below its own moving average at 74.90.

    The sharp advance also created a volume vacuum between approximately $68,000 and $76,000. Such thinly traded areas can accelerate moves in either direction.

    Bitcoin Price Targets if BTC Breaks Higher

    The next bullish move depends on a daily close above $78,670 supported by strong volume.

    $81,455: This is the first target, based on the 28 August high and the 50-week moving average near $81,000. That moving average has separated bull and bear phases through much of Bitcoin’s history and remains one of the most important levels in the current cycle. A sustained breakout above $82,000 would require genuine spot demand rather than short covering.

    $88,000: This is the next major target and the first clear structural resistance above $81,455.

    $100,000: This remains the stretch case. Standard Chartered’s Geoff Kendrick has indicated that his year-end forecast may now be too low, although reaching $100,000 would likely require the Federal Reserve narrative to turn more dovish after a soft inflation reading before 16 September.

    Bitcoin Downside Price Targets

    A second rejection at $78,670 would leave several clearly defined support levels below.

    $74,450: This is the first support and the most likely destination for a normal pullback. Holding this level would keep the broader uptrend intact.

    $72,170: The 200-day EMA is the key technical line. A loss of this level would suggest that the August advance was a bear-market rally.

    $66,803 to $65,000: This support shelf formed through July and early August. A decline into this zone would erase most of the recent advance but leave the broader structure repairable.

    $62,277: This is the origin of the rally. A complete round trip back to this level would represent a textbook failed breakout.

    $58,000: This is the bear-case target. Glassnode has warned that sellers appear exhausted while buyers remain absent, and that a break below $58,500 could open the way to a deeper decline. Michael Terpin has identified an October bottom near $57,000. That scenario would require a September rate hike to materialise.

    For context, Bitcoin has already fallen approximately 54% from its high in the current cycle, although that decline remains shallower than the drawdowns recorded in 2018 and 2022.

    Which Bitcoin News Could Move BTC Next?

    The CLARITY Act remains stalled in the Senate, while bank lobbying pushed Circle and Coinbase shares lower on 28 August. A proposed SEC crypto custody rule, RIN 3235-AN46, entered White House review on 25 August.

    XRP ETFs advanced through two new US filings, and Grayscale launched the first spot Zcash ETP under the ticker ZCSH on NYSE Arca.

    Market sentiment is another risk. The Crypto Fear and Greed Index reached 72 on 28 August, compared with a 30-day average of 42. When positioning becomes crowded so quickly, relatively small catalysts can trigger outsized selling. Friday’s move demonstrated that risk.

    Bitcoin Price Prediction: What Should Traders Watch?

    Bitcoin is at a decision point rather than in a confirmed trend.

    The bullish scenario requires a daily close above $78,670, a return to net ETF inflows this week and support from the $76,700 to $77,300 area during any retest. If all three conditions are met, Bitcoin could break through $81,000 and open the path toward $88,000.

    The bearish scenario requires a second rejection at the current resistance level followed by a break below $72,170. Given the limited trading volume between current prices and the lower support zones, such a move could reopen $65,000 quickly.

    The base case is range-bound trading. Bitcoin is overbought into resistance, while the underlying structure remains strong but is losing momentum. The Federal Reserve outlook is also uncertain with three weeks remaining before the key September decision.

    A range between $74,450 and $78,670 while the RSI cools would be the healthiest outcome for the bulls, and it is the scenario the chart currently supports. Traders should watch ETF flow data from Monday through Wednesday for the next major signal.

    Source: cryptonews.net

  • Bitcoin Early Adopters Stir as 6,427 BTC Worth $500 Million Moves in August

    Bitcoin Early Adopters Stir as 6,427 BTC Worth $500 Million Moves in August

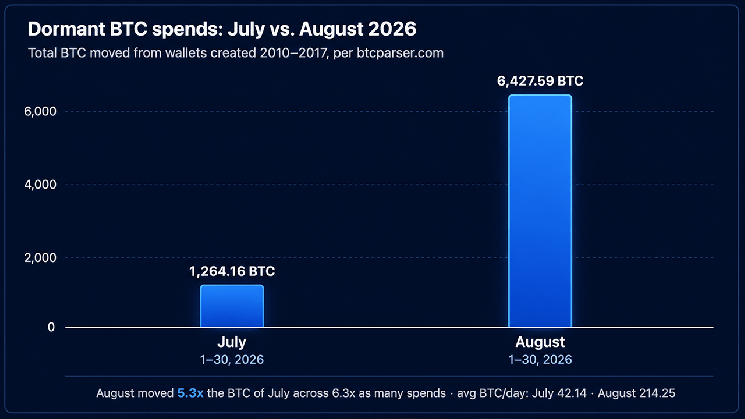
    Bitcoin activity from dormant wallets surged in August after a month marked by hardware wallet security concerns, with 6,427.59 BTC moved from addresses created between 2010 and 2017.

    The renewed movement began after Bitcoin.com News reported on July 30 that losses linked to the Coldcard firmware exploit had reached approximately 2,000 BTC. During the same month, hardware wallet manufacturers Safepal and Trezor disclosed data breaches that exposed customer information, including names, email addresses, phone numbers, and shipping addresses.

    Although no direct connection can be established, the movement of vintage bitcoin by early adopters may reflect heightened caution and a broader effort to reassess and reorganize storage arrangements.

    August dormant Bitcoin activity surpassed July totals

    In the first 10 days of August, dormant bitcoin spending had already exceeded July’s total. Wallets created between 2010 and 2017 recorded 30 spends in July, moving a combined 1,264.16 BTC.

    Across the last 30 days of August, dormant wallet activity averaged approximately 214.25 BTC per day—5.3 times July’s average of 40.78 BTC per day. Btcparser.com recorded 188 distinct spends involving the 6,427.59 BTC moved during the period.

    Eight transfers came from ancient wallets created in 2010 or 2011. Two transfers from 2010 wallets moved 50 BTC, while six movements involving 2011 wallets transferred 155.57 BTC.

    Dormant bitcoin movement discovered by btcparser.com throughout Aug. 1 through 30. Spends from 2014 wallets saw the most activity.

    Wallets dating from 2012 through 2017 accounted for most of the activity, with 2014 wallets showing the greatest movement. Addresses created in 2014 were involved in 94 transfers that moved approximately 3,286.26 BTC between Aug. 1 and Aug. 30.

    Wallets created in 2016 ranked second, with 985.38 BTC changing hands across 29 movements. The 2013 cohort ranked third, recording 16 distinct transfers totaling 845.48 BTC.

    Wallets from 2012 moved 233.41 BTC, while addresses created in 2015 transferred approximately 415 BTC. Wallets from 2017 recorded 456.47 BTC spent across 26 movements.

    Two 2014 wallet clusters showed different patterns

    The 2014 total did not represent one broad wave of dormant bitcoin movement. Instead, it divided into two distinct clusters with notably different behavior.

    The first cluster comprised 64 addresses created between Jan. 27 and Feb. 4, 2014. Together, they moved 1,672 BTC. The coins were not transferred all at once; they trickled out across 11 separate days between Aug. 3 and Aug. 13, followed by several later transfers. Individual movements ranged from 0.31 BTC to 33 BTC.

    The second cluster followed a sharply different pattern. Twenty-five addresses created between Nov. 30 and Dec. 26, 2014, moved 1,514 BTC in nearly uniform lots of approximately 50 BTC. Of those addresses, 22 were swept on Aug. 19 within roughly one hour.

    The two 2014 clusters reveal interesting patterns.

    The level of coordination makes it unlikely that several unrelated holders independently moved decade-old coins on the same afternoon. Instead, the pattern points to a single custodian or key holder carrying out a scripted batch sweep.

    The wallets appear to have been funded together in late 2014. Possible explanations include an exchange cold-storage reorganization, an escrow release, or a bulk paper-wallet distribution, although the blockchain data does not establish which scenario applies.

    Bitcoin’s dormant holders leave their motives unknown

    The deeper story may extend beyond technical vulnerabilities to a loss of confidence strong enough to prompt early adopters to reconsider passive custody. The coordinated movement of old bitcoin addresses suggests that larger holders may be proactively consolidating legacy holdings and increasingly treating aging keys as operational liabilities rather than digital trophies.

    The holders’ true motivations remain unknown. For now, the blockchain movements themselves are the only evidence available to explain the renewed activity.

    Source: cryptonews.net

  • Aster Listing Sends Niu Lai Token Up 510% as Trader Opens $111K Long

    Aster Listing Sends Niu Lai Token Up 510% as Trader Opens $111K Long

    On Aug. 30, blockchain analytics tracker Lookonchain reported that Niu Lai surged more than 510% after being listed for perpetual trading on Aster DEX. According to the report, one trader opened a 5x long position worth approximately $111,000 and was showing an unrealized profit of $49,500. The original data post is available on X.

    What the Data Shows

    The report provides a limited snapshot of market activity rather than a prediction of future prices. Its figures relate to the wallets, products or market segments identified in each post, and the timing is important because crypto markets can change rapidly.

    In the Aster example, the reported return was unrealized. In the GOLD sale, wallet attribution was based on on-chain tracking. The SOL withdrawals show transactions moving from named exchanges but do not reveal the owners’ intentions. ETF inflows, exchange balances and trading-volume figures are measurements from the named data providers, not official statements from every market participant.

    Why These Crypto Market Developments Matter

    These developments highlight how trading activity, custody decisions and liquidity can influence digital-asset markets. A new perpetual listing may attract leverage as well as attention. A coordinated-looking token sale can raise questions about concentration and disclosure.

    Large withdrawals may reduce immediately visible exchange balances, but they do not automatically indicate accumulation. ETF inflows can expand regulated access to digital assets, while exchange outflows may reflect several motives, including self-custody, staking or transfers between trading venues. Trading-volume dominance measures market participation, not the quality or durability of the assets involved.

    What the Report Does Not Show

    The posts do not establish that any reported market move will continue. They also do not, by themselves, prove intent, ownership or a completed change in market structure. Readers should distinguish realized gains from unrealized positions, observed transfers from wallet labels, and on-chain activity from confirmed investor decisions.

    What to Watch Next

    Follow-up evidence will show whether the activity continues after the initial move, whether additional wallets or filings clarify attribution, and whether liquidity remains available across venues.

    For the ETF and exchange-balance data, subsequent daily flows will help determine whether the reported direction was temporary or part of a longer-term trend. Until more evidence becomes available, these developments remain dated market observations. BlockchainReporter will continue to distinguish sourced on-chain data from interpretation and avoid treating a single reading as a forecast. Further context is available in earlier market coverage.

  • Fedwatch Turns Hawkish as Odds of a September Rate Increase Reach 57%

    Fedwatch Turns Hawkish as Odds of a September Rate Increase Reach 57%

    The focus has shifted to the Federal Reserve’s September 16 federal funds rate decision. CME’s FedWatch Tool, which converts federal funds futures trading into implied policy probabilities, currently gives a 57% chance of a 25-basis-point rate hike that would lift the target range to 3.75%-4%. The probability of holding rates at the current 3.5%-3.75% range stands at 43%. With uncertainty elevated, forecasts for the next Federal Open Market Committee decision remain highly divided.

    September Fed Rate Hike Bets Rise Sharply

    The shift is even more striking compared with trader expectations just one week earlier. CME data showed that the probability of a rate hike was only 39.9% on Aug. 21. By Aug. 28, following the Jackson Hole speech, that figure had climbed to 57%, while bets on a September rate cut had almost disappeared.

    Prediction markets have not fully embraced the hawkish outlook. As of this weekend, Polymarket traders assigned a 52% probability to the Fed holding rates and 48% to a 25-basis-point hike. More than $66.6 million has changed hands on the wager, while the once-common rate-cut position now carries odds of just 1%.

    Traders on the prediction marketplace Kalshi are seeing similarly close odds. Its September Fed market, with more than $23.8 million in volume, puts the probability of no change at 52%, compared with 48% for a quarter-point hike.

    Another Kalshi betting contract gives the Fed a 67% chance of raising the federal funds rate at some point before 2027.

    Warsh Highlights Persistent Inflation Risks

    The market probabilities shifted significantly after Warsh’s keynote at the Jackson Hole Economic Policy Symposium. He avoided promising a September rate hike but repeatedly emphasized persistent inflation and the Federal Reserve’s responsibility to restore price stability.

    “There should be no misunderstanding: The Fed’s price-stability objective of 2 percent, as measured by the personal consumption expenditures (PCE) price index, is a firm, fixed target,” Warsh stressed.

    He also made clear that short-term interest rates remain the Fed’s primary tool for achieving that objective.

    The inflation figures Warsh cited help explain why traders interpreted his remarks as hawkish. The Fed’s preferred 12-month PCE inflation measure is running at 3.7%, while the six-month reading is higher at 4.1%. Neither figure is close to the central bank’s fixed 2% target, although some Fed critics believe that level will never be reached again.

    Warsh also described an economy that gives policymakers little reason to fear the effects of higher interest rates. Business investment is rising rapidly, particularly in the artificial intelligence (AI) sector. S&P 500 profits have increased more than 20% over the past year, while real consumer spending has grown more than 2% over four quarters. Unemployment remains at 4.1%.

    Markets Face a Close September Fed Decision

    That combination of persistent inflation and solid economic growth creates a difficult environment for federal funds rate doves. Higher rates can cool demand and inflation, while continued growth and employment give policymakers more room to tighten monetary policy without immediately damaging the labor market.

    Warsh still declined to commit to a rate hike, saying:

    “I stand here today committed to a discipline, not to a decision.”

    The message was deliberate: Markets can speculate about September, but the Federal Reserve does not intend to provide traders with an answer weeks before the meeting. For investors, the decision has become a genuine coin toss, with substantial money positioned on both outcomes. CME futures currently favor a hike, while Polymarket and Kalshi narrowly lean toward a rate hold.

    Inflation and labor-market reports will now carry even greater weight, and either could shift the balance before Fed officials meet in mid-September.

    Source: cryptonews.net

  • Vietnam Crypto Licenses: 5 Firms Clear Initial Review

    Vietnam Crypto Licenses: 5 Firms Clear Initial Review

    Vietnam Crypto Exchange Licensing: Five Applicants Pass Initial Assessment

    Vietnam has not yet issued its first crypto exchange license, but five companies have passed an initial assessment under the country’s five-year digital asset market pilot.

    To Tran Hoa, deputy standing head of the Digital Asset Trading Market Board under Vietnam’s State Securities Commission, disclosed the update at the Vietnam RWA Summit 2026, according to an Aug. 30 report from the Vietnam News Agency.

    Authorities have not identified the five applicants or announced when final licensing decisions will be made. Passing the initial assessment does not authorize any company to operate a crypto exchange.

    Vietnam crypto exchange applicants face $383 million capital requirement

    Vietnam’s Resolution No. 05/2025/NQ-CP requires every crypto exchange applicant to hold at least 10 trillion Vietnamese dong, approximately $383 million, in contributed charter capital. The capital must be contributed in Vietnamese dong.

    Institutional shareholders must provide at least 65% of the capital. More than 35% must come from at least two qualifying organizations, such as commercial banks, securities companies, fund managers, insurers or technology companies.

    Applicants must also obtain an appraisal confirming that their technology meets Level 4 information-system security standards. The Ministry of Public Security is responsible for the required security assessment before an exchange can begin operating.

    Other licensing conditions address management qualifications, asset custody, transaction monitoring, internal controls, conflict management and customer complaints. Applicants must also maintain anti-money laundering and investor-identity verification systems.

    The 10 trillion dong requirement refers to charter capital, not an additional licensing fee paid to the government. Vietnam has not confirmed whether all five preliminary applicants have already secured the full amount.

    New Vietnam crypto penalties take effect Sept. 1

    Decree No. 284/2026/ND-CP takes effect on Sept. 1 and will apply while Resolution 05 governs the crypto market pilot. It introduces penalties for unlicensed services, improper issuance, inadequate customer checks and anti-money laundering failures.

    Organizations that provide crypto services or advertise an exchange without a license can face fines of between 180 million and 200 million dong. Authorities may also order the removal of websites, software and trading systems involved in violations.

    Licensed service providers can be fined for failing to separate customer assets, monitor transactions or protect account information. Organizations that fail to verify customers can face fines ranging from 50 million to 70 million dong.

    The decree generally sets fine levels for organizations. Individuals who commit the same violations ordinarily face half the stated amount. The maximum penalty is 200 million dong for an organization and 100 million dong for an individual.

    Domestic traders will not face immediate platform fines

    Article 9 sets an organizational fine of 30 million to 50 million dong for domestic investors who trade outside a provider licensed by the Ministry of Finance. Under the general half-rate provision, an individual could face a fine of between 15 million and 25 million dong.

    However, this penalty will not automatically apply from Sept. 1. Article 7 of Resolution 05 states that domestic investors become subject to the licensed-platform requirement six months after the first crypto asset service provider receives approval.

    Vietnam has not licensed any provider, so the six-month transition period has not started. Domestic investors therefore will not be fined from Sept. 1 solely for continuing to use an overseas or otherwise unlicensed platform, according to experts cited by the Vietnam News Agency.

    Other violations covered by Decree 284 can still become enforceable on Sept. 1. These include operating or advertising an unauthorized platform, improperly issuing tokens and certain failures involving customer data or anti-money laundering controls.

    First crypto exchange license will start Vietnam’s six-month countdown

    Vietnam introduced the pilot through Resolution 05 on Sept. 9, 2025. The five-year regulated crypto market pilot established rules for issuance, custody, trading and licensed service providers.

    Under the initial framework, locally issued crypto assets may be offered only to foreign investors. Eligible tokens must be backed by real-world assets and cannot represent securities or fiat currencies under the pilot.

    Vietnam has previously indicated that only a limited number of exchanges would receive licenses. The report that five companies passed the initial assessment does not mean that all five will ultimately be approved.

    The key next step is the Ministry of Finance’s first crypto exchange license. That decision will begin the six-month period after which domestic investors must conduct covered crypto trading through licensed Vietnamese providers.

    No licensing deadline has been announced. Investors should monitor official notices from the Ministry of Finance and the State Securities Commission rather than treating preliminary assessments as authorization to operate.

  • Solana Price Prediction: Is SOL Ready for Its Next Big Rally?

    Solana Price Prediction: Is SOL Ready for Its Next Big Rally?

    Solana is showing early signs of a potential trend reversal after reclaiming the $100 level. Improving weekly momentum indicators and long-term cycle analysis suggest that $SOL may be emerging from a prolonged bottoming phase, although confirmation still depends on establishing a sustained pattern of higher highs and higher lows.

    Solana Long-Term Cycle Chart Projects a Potential Move Toward $1,000

    Solana’s broader market structure may be shifting from accumulation and manipulation toward a potential expansion phase. CryptoCurb’s analysis projects a long-term move toward $1,000 if the current bullish setup continues to develop.

    Solana $SOL $1,000 Market Cycle Projection. Source: CryptoCurb (@CryptoCurb) on X

    The weekly $SOL/USDT chart divides the market into three phases: accumulation, manipulation and distribution. The accumulation zone covers much of 2024 and 2025, when $SOL traded within a broad range after recovering from earlier cycle lows.

    The chart identifies the decline into 2026 as a manipulation phase. During that period, $SOL fell below the lower boundary of its previous range before stabilizing near $100. CryptoCurb’s thesis is that the breakdown represents a shakeout rather than the beginning of another extended bearish cycle.

    The immediate technical challenge is a sustained recovery above the lower section of the former trading range. With $SOL shown near $104, the area between roughly $110 and $120 represents an important initial resistance zone. A decisive reclaim of that range would strengthen the argument that the breakdown has failed and that Solana is moving back toward an expansion phase.

    Beyond that point, the projected path becomes significantly more aggressive. The chart shows $SOL potentially rising toward approximately $600, correcting into the mid-$400s and later extending toward $1,000 around 2028.

    However, the $1,000 level remains a speculative long-term scenario rather than a confirmed price target. The chart does not establish that level through a measured move or another independent technical calculation. The bullish outlook therefore depends first on $SOL reclaiming its former range and later breaking above the major highs established during the 2024-2025 structure.

    $SOL Weekly Chart Shows Bullish Divergence and New Buy Signals

    A second weekly chart from Jesse Olson supports the shorter-term reversal case. It shows improving momentum, a strong weekly candle and several bullish technical signals.

    Solana $SOL Weekly Bullish Reversal Signals. Source: Jesse Olson (@JesseOlson) on X

    The Kraken $SOL/USD chart shows $SOL at $105.06 after opening the week at $95.41, reaching $110.61 and trading as low as $93.27. At the time shown on the chart, the token had gained approximately 10.1% for the week.

    Olson highlights a series of bullish signals, including bullish divergence, a buy signal, an RSI-related buy signal and a newly printed green trending dot. The green dot is notable because it follows an extended sequence of bearish trend markers, suggesting that momentum conditions may be changing.

    Solana’s price has also moved above a visible reference level near $97.72 and is testing the $105-$110 area. A clean move above that zone would improve the short-term market structure and raise the probability of a higher high.

    The next confirmation would be the formation of a higher low after any pullback. Together, a higher high and higher low would provide stronger evidence that $SOL is transitioning from a downtrend into a developing uptrend instead of staging another temporary relief rally.

    The chart also identifies a lower reference near $76.77, which serves as an important invalidation level for the developing bullish structure. A sustained move below that area would weaken the reversal thesis.

    Above the current price, the visible volume profile indicates further resistance around $115-$125, followed by a heavier supply zone near $145-$150. Clearing those levels would offer stronger technical confirmation that Solana’s bottoming process has developed into a broader recovery.