Author: Evan Mercer

  • Pascal Co-Founder Highlights Solana’s Strong Brand and Community

    Pascal Co-Founder Highlights Solana’s Strong Brand and Community

    Key Highlights

    • Pascal co-founder Ivo Crnkovic identifies Solana’s strong brand identity and enthusiastic community as distinctive strengths in the blockchain landscape
    • Positive builder sentiment emerges despite stagnant trading volume and mixed signals across the broader cryptocurrency market
    • Solana’s community-driven approach and high-performance infrastructure position it to attract new developer projects and ecosystem growth

    Crnkovic’s Assessment of Solana’s Market Position

    Ivo Crnkovic, co-founder of Pascal, has drawn attention to Solana’s distinctive position within the blockchain ecosystem, emphasizing the network’s combination of a solid brand identity and an actively engaged community. His commentary, shared via social media, characterizes Solana as a standout ecosystem where these dual strengths create favorable conditions for continued innovation and developer participation. Crnkovic’s observations arrive at a pivotal moment when the broader cryptocurrency market is delivering mixed signals, yet Solana’s reputation as a builder-friendly platform appears to be reinforcing its appeal among developers and project teams.

    Community Dynamics and Builder Appeal

    The Pascal co-founder’s insights highlight how Solana’s community-driven approach functions as a competitive differentiator. The ecosystem’s vibrant user base and strong brand recognition are cited as key factors attracting builders to the platform. This dynamic suggests potential for increased project development activity, as developers gravitate toward environments offering both technical scalability and robust community support. Solana’s architecture—known for high throughput and low transaction costs—complements these social dynamics, creating a feedback loop where technical performance and community enthusiasm reinforce each other.

    Market Context and Trading Activity

    Despite the positive qualitative assessment, current token metrics reveal a more nuanced picture. Solana’s trading volume remains stagnant, indicating thin market activity in the near term. However, market observers note that influential commentary from figures like Crnkovic could catalyze renewed interest from both investors and developers. The ecosystem’s evolution continues to be shaped by regulatory dynamics and broader market conditions, though its foundational strengths in scalability and speed remain intact. Traders and participants are monitoring key indicators including community engagement metrics, emerging project launches, and the balance between grassroots community input and strategic platform decisions.

    Why This Matters

    Crnkovic’s endorsement carries weight because it comes from a builder actively evaluating blockchain infrastructure for development. In an environment where developer mindshare often predicts long-term ecosystem viability, Solana’s ability to maintain brand coherence and community vitality—even during periods of muted price action—signals resilience. The network’s high-performance architecture continues to lower barriers for complex applications, while its community culture reduces the cold-start problem for new projects. As regulatory clarity improves and market cycles shift, ecosystems with entrenched developer communities and proven technical throughput are positioned to capture disproportionate growth. The interplay between social sentiment and on-chain fundamentals will be a critical variable for stakeholders tracking Solana’s trajectory through 2025 and beyond.

    Frequently Asked Questions

    What specific strengths did Ivo Crnkovic highlight about Solana?
    ▼

    Crnkovic emphasized Solana’s “strong brand” and “enthusiastic user base” as its distinctive combination, noting these factors make it a standout ecosystem with potential for increased builder participation and innovation.

    How does current trading volume contrast with the positive sentiment?

    Solana’s trading volume is currently described as stagnant, indicating thin market activity. However, analysts suggest the positive commentary around its brand and community dynamics could spur renewed interest from investors and developers despite current low volume.

    What factors will influence Solana’s ability to attract new projects?

    Key factors include sustained community engagement, emergence of new projects leveraging Solana’s high-performance infrastructure, the balance between community governance input and strategic platform decisions, and broader regulatory and market conditions affecting the crypto landscape.

  • Arthur Hayes Buys 25.33M ENA, Predicts Price Surge to $0.50

    Arthur Hayes Buys 25.33M ENA, Predicts Price Surge to $0.50

    Key Highlights

    • Arthur Hayes purchased 25.33 million $ENA tokens for $5.53 million and now holds an unrealized profit of $3.28 million.
    • The prominent crypto trader has set a bullish price target of $0.50 for the Ethena Labs governance token.
    • Market data shows $ENA currently trading with zero reported 24-hour volume, suggesting a thin market that could amplify large trade impacts.

    Arthur Hayes Signals Conviction in Ethena Labs With Major $ENA Accumulation

    Prominent cryptocurrency trader and BitMEX co-founder Arthur Hayes has placed a significant wager on the Ethena Labs ecosystem, revealing a bullish price target of $0.50 for the $ENA governance token. According to on-chain analytics platform Lookonchain, Hayes accumulated 25.33 million $ENA tokens approximately one month ago at a cost basis of $5.53 million. That position has since appreciated substantially, showing an unrealized profit of $3.28 million as of the latest reporting. The disclosure, sourced directly from Lookonchain’s social media monitoring of whale wallets, underscores Hayes’s track record of identifying asymmetric opportunities in the digital asset space.

    Market Structure Raises Questions Amid Zero Volume Reporting

    Despite the sizable position and public price target, current market data presents an unusual picture. Aggregators indicate that $ENA is trading at $0 with no reported volume over the past 24 hours, a condition that typically signals either a data reporting failure, extreme illiquidity, or a pre-market phase for a newly listed asset. Such thin order books mean that any meaningful buy or sell pressure—especially from a whale-sized allocation like Hayes’s—could produce exaggerated price swings. The broader cryptocurrency market is currently delivering mixed signals across major assets, leaving traders to parse whether Hayes’s move represents a leading indicator for $ENA or an idiosyncratic bet detached from general sentiment.

    Trader Focus Shifts to Technical Levels and Macro Catalysts

    With Hayes’s entry price and $0.50 target now public, market participants are mapping out key technical zones to watch. The $0.50 level serves as the primary resistance target, while traders will attempt to identify emerging support levels should trading activity resume in earnest. Beyond token-specific dynamics, macroeconomic variables—including Federal Reserve interest rate policy, evolving regulatory frameworks for decentralized finance, and overall risk appetite—will likely dictate whether $ENA can sustain momentum or revert to dormancy. The intersection of a high-profile endorsement and a near-zero volume environment creates a unique setup that warrants close observation over the coming weeks.

    Why This Matters

    Arthur Hayes has cultivated a reputation for early positioning in narrative-driven crypto sectors, from decentralized derivatives to yield-bearing synthetic assets. His involvement with Ethena Labs—a protocol designed to create a censorship-resistant, delta-neutral “synthetic dollar” (USDe) backed by staked Ether and futures basis trades—aligns with his historically vocal support for permissionless financial primitives. When a trader of Hayes’s stature discloses a nine-figure notional position (at target) and a specific price objective, it functions as both a capital allocation signal and a narrative catalyst. However, the current absence of reported volume introduces execution risk: liquidity may be insufficient to support an orderly exit if thesis drift occurs. Investors should treat the $0.50 target as a scenario analysis rather than a forecast, and monitor on-chain flow data from platforms like Lookonchain, Arkham, or Nansen for confirmation of follow-on participation.

    Frequently Asked Questions

    What is $ENA and what role does it play in the Ethena Labs ecosystem?

    $ENA is the governance token of Ethena Labs, the protocol behind USDe, a synthetic dollar designed to maintain parity with USD through delta-neutral strategies involving staked Ethereum and short perpetual futures positions. $ENA holders participate in protocol governance, including parameter adjustments and treasury management.

    How reliable is the reported zero trading volume for $ENA?

    Zero reported 24-hour volume often indicates either a data aggregation gap across centralized and decentralized exchanges, a very recent listing with limited exchange coverage, or extremely low liquidity. Traders should verify volume across multiple on-chain explorers and exchange APIs before drawing conclusions about market depth.

    Does Arthur Hayes’s position constitute a buy recommendation for retail investors?

    No. The source material explicitly states the article does not constitute financial advice. Hayes’s disclosed position reflects his personal risk tolerance, capital base, and thesis. Retail investors should conduct independent due diligence, assess their own risk parameters, and consider the heightened volatility inherent in low-liquidity assets.

  • a16z-Backed Layer-1 Project Linera Shuts Down After Token Sale Falls Short

    a16z-Backed Layer-1 Project Linera Shuts Down After Token Sale Falls Short

    Key Highlights

    • Linera, an a16z-backed Layer-1 blockchain founded by former Meta researcher Mathieu Baudet, announced its shutdown on September 19 after a community token sale raised only 57% of its $1.5 million minimum target.
    • The project had previously secured approximately $12 million across two venture rounds—led by a16z Crypto and Borderless Capital—but emergency financing efforts failed to bridge the funding gap.
    • The team is winding down operations and will close its Discord server; user point balances remain recorded but carry no guarantee of future value, and the microchain-based protocol will not reach mainnet under the current team.

    Linera Shuts Down After Token Sale Misses Minimum Threshold

    Layer-1 blockchain project Linera has ceased operations, the team announced via Discord on September 19, citing insufficient funding as the sole reason for the shutdown. The decision comes despite the project having raised roughly $12 million in venture capital across two prior rounds and developing a novel “microchain” architecture designed for high-throughput parallel execution. Founded by former Meta researcher Mathieu Baudet, Linera had positioned its network of small, parallel chains—called microchains—as a scalable solution for handling large volumes of simultaneous on-chain activity.

    Community Round Falls 43% Short of $1.5 Million Minimum

    The immediate catalyst for the shutdown was the failure of Linera’s LNRA community token sale on the Sonar platform. The round attracted $848,271 in USDC from 617 participants—approximately 57% of the $1.5 million minimum required for the sale to close. Because the threshold was not met, the sale did not complete and every contribution was refunded to participants rather than locked into the project. The team characterized the result as nearly $900,000 in commitments, still well short of the capital needed to continue development toward a mainnet launch. Subsequent emergency financing efforts also failed to close the shortfall.

    Two Venture Rounds Totaling $12 Million Were Not Enough

    The shutdown is notable given Linera’s venture backing. A $6 million seed round announced in June 2022 was led by a16z Crypto, with participation from Cygni Capital, Kima Ventures, and Tribe Capital. A second $6 million round followed in August 2023, led by Borderless Capital and backed by Flow Traders, GSR, Matrixport, and Laser Digital. Despite this $12 million in institutional capital, the project exhausted its runway—a fate shared by other venture-funded crypto startups such as Kulipa, a stablecoin card issuer that shut down four months after raising a $6.2 million seed round.

    Why This Matters

    Linera’s closure underscores the persistent gap between venture funding and sustainable token economics in blockchain infrastructure. Even well-capitalized teams with novel technical architectures—Linera’s microchain design aimed to solve parallel execution bottlenecks—can fail when community fundraising falls short and follow-on capital dries up. The refund of all community contributions reflects a growing emphasis on investor protection in token sales, but it also leaves early supporters without token allocation or upside. For the broader ecosystem, the shutdown removes a technically distinct Layer-1 contender from the competitive landscape, while a16z Crypto’s recent $25 million seed investment in OpenReserve signals continued appetite for new infrastructure bets. Linera’s intellectual property and microchain research may yet influence future designs, but the protocol will not reach mainnet under its current team.

    Frequently Asked Questions

    Will Linera token holders or community sale participants receive any allocation?

    No. Because the community sale did not meet its $1.5 million minimum, all USDC contributions were refunded. No LNRA tokens were minted or distributed through the sale.

    What happens to user points earned during Linera’s testnet?

    User point balances remain on record, but the team explicitly stated there is no guarantee of future value. The Discord server will eventually be closed as part of the wind-down process.

    Is there any possibility Linera relaunches or its technology continues elsewhere?

    The team said it still hopes to finish the protocol and launch applications but offered no timeline. The microchain-based design will not reach mainnet under the current team, though the research could inform future projects.

  • Ripple XRP: $2 Billion Whale Buy Tests Make-or-Break Resistance Wall

    Ripple XRP: $2 Billion Whale Buy Tests Make-or-Break Resistance Wall

    Key Highlights

    • Large wallet addresses accumulated approximately 1.54 billion XRP worth $2.2 billion in four days, while a major short position on Hyperliquid was reduced by nearly half.
    • Institutional adoption advances as CoinShares increased its XRP holdings to 148.66 million tokens, Franklin Templeton clients added $1.5 million, and Ondo Finance launched the OUSG tokenized U.S. Treasury fund on the XRP Ledger using Ripple’s RLUSD stablecoin.
    • XRP faces a critical technical test at the $1.49–$1.54 resistance zone that has rejected price multiple times; a sustained breakout could unlock further upside, while rejection risks a decline toward $1.30, $1.20, and $1.10 support levels.

    Whale Accumulation and Short Covering Signal Shifting Market Structure

    On-chain data reveals a concentrated buying campaign by large XRP holders over a compressed four-day window. Approximately 1.54 billion XRP, valued near $2.2 billion at current prices, moved into whale wallets. This pace of accumulation is notable for its speed and scale, often preceding significant price volatility according to market analysts tracking wallet clustering behavior.

    Simultaneously, derivative market positioning shifted. A prominent short seller operating on the decentralized perpetual exchange Hyperliquid began unwinding a bearish bet, repurchasing 450,000 XRP and reducing the short exposure by nearly 50%. Short covering of this magnitude can create upward price pressure as buy orders execute to close positions, potentially amplifying any spot-driven rally.

    Institutional Flows Deepen Despite Price Consolidation

    Institutional appetite persists even as XRP trades in a range. CoinShares disclosed in a fresh SEC filing that its Physical XRP ETP now holds 148.66 million tokens, an increase from 129.75 million reported in December 2024. The asset manager continued purchasing during the recent price pullback, signaling conviction in the asset’s longer-term trajectory.

    Franklin Templeton, through its OnChain U.S. Government Money Fund (FOBXX), added roughly $1.5 million worth of XRP to client allocations. While modest in absolute terms, the participation of a traditional asset management giant managing over $1.6 trillion underscores growing comfort with digital asset integration in regulated fund structures.

    Product pipeline developments remain active. Volatility Shares postponed the launch of its 3x Long XRP Daily Target ETF to October 18, 2025. The registration statement remains effective with the SEC, indicating a scheduling adjustment rather than a withdrawal. If approved, the fund would provide leveraged exposure to XRP daily returns through a traditional exchange-traded wrapper.

    South Korea Emerges as Epicenter of Retail XRP Activity

    Upbit, South Korea’s largest cryptocurrency exchange by volume, reported XRP as its single most-traded asset. Daily XRP volume reached $183.8 million, accounting for more than 10% of the exchange’s total trading activity and exceeding Bitcoin’s volume on the platform by more than double. The disparity highlights a pronounced regional preference for XRP among Korean retail participants, a dynamic that has historically preceded outsized price moves during local trading hours.

    Real-World Asset Tokenization Reaches XRP Ledger

    Ondo Finance deployed its OUSG fund—a tokenized representation of short-term U.S. Treasury securities—directly on the XRP Ledger. The fund utilizes Ripple’s RLUSD stablecoin for subscription and redemption mechanics, marking the first instance of government debt settling natively on the XRP Ledger. This deployment runs in parallel with existing Ethereum and Mantle integrations, expanding the interoperability footprint of tokenized Treasuries.

    The move aligns with a broader industry push to bring traditional financial instruments on-chain. By leveraging the XRP Ledger’s built-in decentralized exchange and native token standards, Ondo aims to offer institutional investors settlement finality in seconds with minimal transaction costs.

    Protocol Governance Nears Milestone Upgrade

    The XRP Ledger’s Permission Delegation amendment (XLS-43) advanced significantly, securing 15 new validator votes in ten days. The proposal now sits three votes shy of the 80% supermajority threshold required for activation. The amendment introduces granular access controls, allowing account holders to delegate specific permissions—such as signing payment transactions or managing trust lines—without surrendering full master key authority.

    Wormhole, the cross-chain messaging protocol, is positioned as an early adopter, seeking limited access to Ripple’s RLUSD issuer account to facilitate bridging to Flare and other ecosystems. Simultaneously, compliance teams at regulated entities have advocated for the feature to satisfy internal control requirements that currently prevent them from operating on the ledger.

    Independent Audit Confirms Energy Efficiency Claims

    An external energy audit commissioned through Bitvavo, a European exchange, verified XRP’s environmental profile. The XRP Ledger’s consensus protocol consumes approximately 0.00002 kilowatt-hours per transaction, with effectively zero direct carbon emissions. The findings reinforce XRP’s positioning among the most energy-efficient settlement layers, a differentiator as institutional allocators increasingly weigh sustainability criteria.

    Why This Matters

    The convergence of whale accumulation, institutional fund flows, derivative positioning shifts, and protocol-level upgrades creates a multi-layered catalyst stack for XRP. Unlike prior cycles driven predominantly by retail speculation, the current backdrop includes regulated product launches (CoinShares, potential Volatility Shares ETF), real-world asset tokenization (Ondo OUSG), and infrastructure maturation (Permission Delegation). South Korea’s outsized retail volume adds a localized demand accelerator that has historically amplified global price discovery.

    However, the $1.49–$1.54 resistance zone represents a well-defined liquidity cluster where sellers have previously absorbed buying pressure. A weekly close above this band would technically confirm a higher-high structure and likely trigger algorithmic trend-following flows. Failure to breach would maintain the range-bound paradigm established since the 2024 peak, with the $1.30, $1.20, and $1.10 levels serving as progressive downside magnets. The October 18 ETF launch deadline and the Permission Delegation vote outcome represent near-term binary events that could tip the balance.

    Frequently Asked Questions

    How much XRP have large wallets accumulated recently?
    Approximately 1.54 billion XRP, worth roughly $2.2 billion, were acquired by large wallet addresses over a four-day period according to on-chain analytics.
    What is the significance of Ondo Finance launching OUSG on the XRP Ledger?
    It marks the first time tokenized U.S. Treasury securities have settled natively on the XRP Ledger, using Ripple’s RLUSD stablecoin for subscriptions and redemptions, bridging traditional government debt markets with blockchain settlement.
    What are the key price levels to watch for XRP?
    The immediate resistance zone spans $1.49 to $1.54. A sustained breakout above this area could open the path to higher prices, while rejection risks a decline toward support at $1.30, $1.20, and $1.10.
  • Hacker Steals $2 Million From Fetch.ai, NuNet in Single Attack

    Hacker Steals $2 Million From Fetch.ai, NuNet in Single Attack

    Key Highlights

    • Security firms Blockaid and PeckShield confirm a single attacker exploited both Fetch.ai and NuNet on September 19, stealing a combined total of nearly $2 million.
    • The exploiter drained 8.7 million FET tokens ($1.53 million) from a Fetch.ai converter contract, then used the same wallet to mint 408.5 million unauthorized NTX tokens ($463,000) via NuNet’s deployer account.
    • NuNet’s NTX token plummeted 65–70% while FET fell roughly 10%; the attacker quickly converted most proceeds into 546 ETH (~$1.44 million) to obscure the trail.

    Coordinated Exploit Hits Two AI-Crypto Projects Within Hours

    Blockchain security firms Blockaid and PeckShield have identified a single threat actor responsible for back-to-back exploits targeting Fetch.ai and NuNet on September 19. The combined haul approaches $2 million, underscoring a recurring vulnerability in the permission structures of AI- and compute-focused crypto protocols. Researchers say the same wallet address received funds from both incidents, providing a clear on-chain link between the two attacks.

    Fetch.ai Converter Contract Drained First

    The attack sequence began with the exploitation of a token converter contract belonging to Fetch.ai. According to Blockaid’s analysis, the attacker siphoned approximately 8.7 million FET tokens, valued at roughly $1.53 million at the time. The stolen assets were transferred to a wallet that would later serve as the bridge to the second exploit.

    Same Wallet Used to Mint Unauthorized NuNet Tokens

    Using the identical wallet that received the FET proceeds, the exploiter then interacted with NuNet’s deployer account to mint 408.5 million NTX tokens without authorization, netting an additional $463,000. Blockaid has published the exploiter’s wallet addresses and a sample transaction, enabling exchanges, bridge operators, and other projects to flag and block further movement from those addresses.

    Market Reaction and Attacker Obfuscation

    The market impact was immediate and asymmetric. NuNet’s NTX token crashed between 65% and 70% across various trackers, while Fetch.ai’s FET token declined approximately 10%. The attacker moved swiftly to launder proceeds, converting a large portion of the stolen funds into 546 ETH (roughly $1.44 million)—a standard tactic to complicate tracing and reduce the risk of asset freezes by centralized platforms.

    No Official Statements; Researchers Urge Caution

    As of publication, neither Fetch.ai nor NuNet has issued an official statement addressing the exploits or confirming the status of their smart contracts. Security researchers monitoring the incident are advising all holders and active users of FET and NTX tokens to exercise caution until the development teams provide clarity on the root cause and whether their platforms are safe to resume normal operations.

    Why This Matters

    The dual exploit highlights a systemic weak point across AI- and compute-oriented crypto projects: misconfigured or overly permissive smart contract access controls. In this case, a single compromised key or permission set allowed the attacker to drain liquidity from one protocol and leverage the same credentials to mint unauthorized supply on a completely separate, unrelated protocol. The incident reinforces the need for stricter role separation, multi-signature governance for deployer accounts, and continuous permission auditing—especially for projects that share infrastructure patterns or developer tooling across the AI-crypto intersection.

    Frequently Asked Questions

    Which projects were exploited and how much was stolen?

    Fetch.ai lost approximately 8.7 million FET tokens ($1.53 million) from a converter contract, and NuNet had 408.5 million NTX tokens ($463,000) minted without authorization via its deployer account. The combined value is nearly $2 million.

    How do we know the same attacker hit both projects?

    Blockaid and PeckShield traced the on-chain flow and found that the wallet receiving the stolen FET tokens was the exact same wallet used to execute the unauthorized NTX mint on NuNet. Blockaid has published the wallet addresses and a sample transaction as evidence.

    Have Fetch.ai or NuNet responded officially?

    As of this report, neither project has released an official statement. Security researchers recommend token holders and users remain cautious until the teams confirm the root cause and platform safety.

  • Altcoin Market Cap Surpasses $1.07T as Bitcoin Dominance Weakens, Fueling Altseason Speculation

    Altcoin Market Cap Surpasses $1.07T as Bitcoin Dominance Weakens, Fueling Altseason Speculation

    Key Highlights

    • The total altcoin market capitalization, including Ethereum, has broken above the critical $1.07 trillion resistance level, marking the midpoint of a long-term trading range with a ceiling near $1.71 trillion.
    • Market sentiment has shifted decisively bullish: the Crypto Fear & Greed Index has held above 60 since August 20, and 70% of altcoins on Binance now trade above their 200-day moving average, confirming sustained upward momentum.
    • Despite the strength, the Altcoin Season Index sits at just 54—well below the 80 threshold that historically signals a true altseason—while analysts warn that rising social-media-driven leverage could trigger a near-term pullback.

    Altcoin Market Cap Breaks Key Resistance, Signaling Broad-Based Strength

    The cryptocurrency market has entered a pronounced greed phase, with the Crypto Fear & Greed Index climbing above 60 on August 20 and remaining at elevated levels since. This sentiment shift coincides with a sharp Bitcoin recovery that lifted BTC from roughly $76,000 back above the $80,000 mark, rekindling risk appetite across the digital-asset spectrum. Crucially, the aggregate altcoin market capitalization—including Ethereum—has mirrored Bitcoin’s gains, clearing the pivotal $1.07 trillion level that represents the midpoint of a multi-year range whose upper boundary sits near $1.71 trillion.

    Technical Milestones and On-Chain Confirmation

    Glassnode, in a post on X, observed that altcoin open interest as a share of Bitcoin’s open interest has not yet reached risk thresholds, suggesting the current rally is not overextended on a leverage basis. The research firm added that “A resurgent Ethereum also helped make the case that the altcoin strength would continue in the coming days and weeks.” Supporting this view, crypto analyst Darkfost noted that “70% of the altcoins on Binance have moved back above their 200-day moving average.” He emphasized that “This confirmed that a majority of them were experiencing strong, sustained bullish momentum in recent weeks to clear this key MA.” Meanwhile, Bitcoin itself is eyeing the next major hurdle at the $82,000 resistance zone, a break of which could further amplify capital rotation into alternative assets.

    Why Altseason Has Not Yet Arrived Despite Bullish Metrics

    While price action and breadth indicators are flashing green, the dedicated Altcoin Season Index remains at only 54. Historical precedent shows that true altseason extremes typically occur when this index surpasses 80—a level last seen in September 2025, just weeks before Bitcoin printed its all-time high. The source analysis states plainly: “It is not yet altseason.” It adds that “Rising altcoin market cap and falling Bitcoin dominance trends, if they come true in the coming weeks, will serve as confirmation of hefty capital flow into the altcoin market.” In other words, the necessary rotation from Bitcoin dominance into a broad altcoin rally is still in its early innings.

    Social Hype and Leverage: The Double-Edged Sword

    Alphractal, writing on X, highlighted a surge in social-media activity accompanying the price rally: “The sudden price rally across the market resulted in a surge in social media posts. This can lead to more discussion, more FOMO, and more speculation.” The same analysis cautioned that “Heightened leverage could be a factor to watch out for, as it would increase the risk of a pullback.” Nevertheless, the firm concluded that “As things stand, the conditions support further gains for the altcoin market.”

    Why This Matters

    The breach of the $1.07 trillion altcoin market-cap midpoint is a structurally significant development. It suggests that capital is beginning to diversify beyond Bitcoin in a sustained manner, a prerequisite for any genuine altseason. However, the sub-80 Altcoin Season Index reading indicates that leadership remains concentrated in a subset of large-cap assets—likely Ethereum and a handful of major layer-1s—rather than the broad-based speculative frenzy that characterizes mature alt cycles. Traders and investors should monitor two key confirmation signals: a decisive decline in Bitcoin dominance below its recent range and a sustained push of the Altcoin Season Index toward the 80 threshold. Simultaneously, the rapid rise in social-media chatter and potential leverage buildup warrants caution; history shows that excessive retail FOMO often precedes sharp, short-lived corrections even within longer-term uptrends.

    Frequently Asked Questions

    Has altseason officially started according to the Altcoin Season Index?

    No. The Altcoin Season Index currently sits at 54, well below the 80 level that historically marks the beginning of a true altseason. The last time the index exceeded 80 was in September 2025, shortly before Bitcoin reached its all-time high.

    What technical level did the total altcoin market cap just clear, and what is the next target?

    The aggregate altcoin market capitalization (including Ethereum) broke above the $1.07 trillion midpoint of a long-term range. The next major resistance is the range high near $1.71 trillion.

    What are the primary risks to the current altcoin rally?

    Analysts flag two main risks: (1) a rapid increase in leverage driven by social-media-fueled FOMO, which could amplify any pullback, and (2) the absence of a confirmed downtrend in Bitcoin dominance, which is needed to validate broad-based capital rotation into altcoins.

  • NEAR Hits New ‘All-Time High’ in TVL, But What About Its Price?

    NEAR Hits New ‘All-Time High’ in TVL, But What About Its Price?

    Key Highlights

    • NEAR Protocol surges over 10% in 48 hours, breaking the $3.2–$3.4 supply zone to print a new local swing high at $3.9 while trading above all key Exponential Moving Averages.
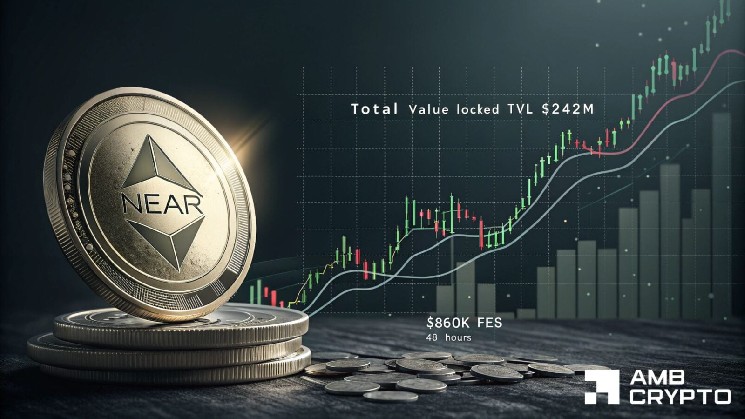
    • Network fundamentals hit record strength: Total Value Locked (TVL) reaches an all-time high of $242 million and protocol fees climb to $860,000 over the same period, per DefiLlama data.
    • NEAR satisfies all criteria for its anticipated milestone airdrop as of September 19, with TVL having crossed $70 million and price clearing $3.3, adding a fundamental catalyst to the technical breakout.

    NEAR Protocol Leads Crypto Market Rebound with Double-Digit Gains

    NEAR emerged as one of the cryptocurrency market’s biggest beneficiaries over the last 48 hours as the wider sector flashed green. The token recorded gains exceeding 10%, propelled by improving network activity that provided fundamental backing for the rally. This explosive bullish push cleared NEAR’s supply zone between $3.2 and $3.4 and printed a new local swing high at $3.9. With the token now trading above all key Exponential Moving Averages, market participants are assessing whether network bulls can sustain the momentum.

    On-Chain Fundamentals Underpin Price Surge

    Latest on-chain metrics reveal that fundamentals for NEAR Protocol have been robust over time. To be specific, the blockchain’s Total Value Locked set another record high of $242 million while network fees soared over the last 48 hours. This hike may be evidence that more capital is pouring into NEAR’s ecosystem. Additionally, NEAR protocol’s fees hit the $860,000-mark over the same period. Cumulatively, the hike in capital inflows into the network and fee generation may be a sign of growing activity across the ecosystem, according to data sourced from DefiLlama.

    Airdrop Milestone Adds Catalyst to Bullish Narrative

    Still, it is worth noting that 19th September marks the first day since NEAR ticked all the boxes for the anticipated milestone airdrop. The token’s TVL crossed the $70 million-mark two days ago while yesterday’s rally pushed the token’s price above $3.3. This convergence of technical breakout, record on-chain activity, and airdrop eligibility creates a multi-layered bullish case that distinguishes NEAR from peers relying solely on speculative momentum.

    Technical Outlook: Bulls Face Profit-Taking Test

    NEAR’s ability to maintain the prevailing momentum will depend on whether buyers continue to support the token after its 10% daily hike. A sustained rally alongside further growth in TVL and network fees would keep the bullish structure intact and could bring higher price levels into focus. Conversely, a rise in profit-taking could force NEAR to consolidate and retest nearby support. As it stands, the network’s long-term on-chain sentiments point to a potential bullish continuation. However, a short-term correction from the anticipated profit-taking cannot be ignored completely.

    Why This Matters

    The NEAR Protocol rally exemplifies a growing market trend where price action is increasingly tied to verifiable on-chain fundamentals rather than pure speculation. The simultaneous achievement of an all-time high in TVL ($242 million), a surge in protocol revenue ($860,000 in 48 hours), and the satisfaction of airdrop criteria signals genuine ecosystem adoption. For investors and developers, this suggests NEAR’s sharded proof-of-stake architecture is attracting meaningful capital and usage—critical for long-term viability in the competitive Layer-1 landscape. The upcoming days will test whether the protocol can convert speculative inflows into sticky liquidity, a key determinant of whether the $3.9 high becomes a launchpad or a local top.

    Frequently Asked Questions

    What triggered NEAR’s recent price surge above $3.9?
    The surge was driven by a combination of broad crypto market recovery, NEAR clearing a key $3.2–$3.4 supply zone, and strong on-chain fundamentals including record TVL of $242 million and $860,000 in protocol fees over 48 hours.
    Has NEAR qualified for its anticipated milestone airdrop?
    Yes, as of September 19, NEAR met all criteria for the milestone airdrop after TVL crossed $70 million and the token price surpassed $3.3.
    What are the key levels to watch for NEAR’s next move?
    Immediate resistance lies at the $3.9 local high, while support zones to watch on any pullback include the cleared supply area at $3.2–$3.4 and key Exponential Moving Averages now acting as dynamic support.
  • XRP $2 Dream Returns: Whales Absorb $2.2 Billion Tokens in 96-Hour Spree

    XRP $2 Dream Returns: Whales Absorb $2.2 Billion Tokens in 96-Hour Spree

    Key Highlights

    • XRP whale addresses accumulated approximately 1.54 billion tokens worth $2.2 billion in a 96-hour window, pushing total whale holdings to 9.81 billion tokens according to Santiment data tracked by Ali Martinez.
    • A bullish inverse head and shoulders pattern has formed on the daily XRP/USD chart with key support established at $1.33, current price holding at $1.40, and critical neckline resistance at $1.55.
    • Despite significant XRP inflows to Binance that typically signal selling pressure, aggressive buying demand is absorbing supply and withdrawing tokens to cold wallets, reducing immediate sell-off risk.

    Whale Accumulation Reaches Historic Pace in Second Half of 2026

    One of the most significant XRP buying campaigns of the second half of 2026 is currently unfolding across cryptocurrency markets. Over a compressed 96-hour period, large-scale investors—commonly referred to as whales—have absorbed approximately 1.54 billion XRP tokens from circulating supply. At prevailing exchange rates, this accumulation represents roughly $2.2 billion in notional value, signaling conviction among high-net-worth participants. The surge has propelled the $2.00 per token price target back into realistic territory for the first time in months.

    On-chain analytics platform Santiment has documented a sharp shift in sentiment among key network participants. According to data shared by analyst Ali Martinez, the supply distribution chart displays a near-vertical surge in whale address holdings. Combined balances have broken out of a prolonged consolidation phase in a matter of days, climbing toward peak levels and reaching a collective 9.81 billion XRP tokens held by whale entities. This rapid expansion of concentrated holdings suggests coordinated accumulation rather than organic retail-driven demand.

    Inverse Head and Shoulders Pattern Defines Technical Battlefield

    Pattern Anatomy: Support, Base, and Resistance

    The buying spree coincides with the formation of a rare and closely watched technical structure on the daily XRP/USD chart: an inverse head and shoulders pattern. This bullish reversal formation comprises three critical price zones that are currently dictating market dynamics. Large investors have established a robust defense zone around $1.33, forming a solid right shoulder that has thus far rejected multiple downside probes. The token’s price is currently consolidating around $1.40, demonstrating firm stability above this support base. However, the primary obstacle for buyers remains the pattern’s neckline at $1.55—a level that has capped previous recovery attempts.

    Exchange Inflows Absorbed, Cold Wallet Withdrawals Accelerate

    Adding complexity to the technical picture, on-chain trackers have recorded a large inflow of XRP to the Binance exchange. Under typical market conditions, such deposit volumes would trigger panic selling and price depreciation as traders anticipate liquidation. The current environment, however, is defying this convention. Aggressive buying demand is fully absorbing the incoming supply, with tokens being rapidly withdrawn from exchange custody into cold wallets for long-term holding. This migration significantly reduces available selling pressure and limits the risk of sudden, cascading sell-offs that could derail the emerging uptrend.

    Why This Matters

    The convergence of historic whale accumulation, a textbook bullish chart pattern, and exchange supply absorption creates a high-probability setup for a sustained XRP rally. The $1.55 neckline represents the linchpin: a confirmed daily close above this level would validate the inverse head and shoulders formation and technically project a measured move toward the psychological $2.00 threshold. For market participants, the critical variable is whether the current 96-hour momentum can be sustained through the resistance test. The behavior of whale addresses—specifically whether they continue withdrawing to cold storage rather than redistributing to exchanges—will serve as the most reliable on-chain confirmation of trend durability. With Ripple’s ongoing legal clarity and expanding institutional partnerships providing fundamental tailwinds, a breakout could attract substantial follow-through from both algorithmic and discretionary capital.

    Frequently Asked Questions

    What is the significance of the 9.81 billion XRP whale holding figure?

    This figure, sourced from Santiment data via analyst Ali Martinez, represents the combined XRP balance across all identified whale addresses. The rapid increase from a prolonged plateau to this peak level in just days indicates coordinated, high-conviction accumulation by the largest non-exchange entities on the network.

    Why are XRP inflows to Binance not causing price declines?

    Typically, large exchange deposits signal intent to sell. In this case, on-chain data shows the deposited tokens are being rapidly purchased and withdrawn to cold wallets. This absorption indicates demand exceeds the new supply, neutralizing selling pressure and suggesting accumulation rather than distribution.

    What confirms the inverse head and shoulders pattern?

    The pattern requires a confirmed daily candle close above the $1.55 neckline resistance. Until that occurs, the formation remains incomplete and subject to failure. A successful breakout would technically target the $2.00 level based on the pattern’s measured move projection.

  • Altcoins Surge Again, but a Key Metric Indicates Altseason Is Still Absent

    Altcoins Surge Again, but a Key Metric Indicates Altseason Is Still Absent

    Key Highlights

    • Altcoin market capitalization surged to $222 billion for the first time in eight months, yet futures leverage remains well below historical risk thresholds.
    • Major assets remain far from all-time highs: Bitcoin down 36%, Ethereum down 47%, Solana down 61%, and the broad altcoin market cap down 54%.
    • The Altcoin Season Index sits at 54—firmly between Bitcoin Season and Altcoin Season—and has repeatedly failed to sustain the 75+ level required for a confirmed altseason.

    Altcoin Market Cap Surges to $222 Billion but Leverage Remains Subdued

    The broader cryptocurrency market rally has lifted the altcoin complex, pushing total altcoin market capitalization to $222 billion—a level not seen in eight months. Despite this notable expansion, on-chain and derivatives data suggest the advance lacks the speculative intensity that historically precedes a full-blown altseason. According to Glassnode, altcoin leverage is still below the major risk threshold that typically signals overheated conditions. “Altcoin traders need to put in more work,” the data implies, as futures open interest for altcoins relative to Bitcoin (BTC) hovers around -10% to -15%, well beneath the red risk-threshold line near parity. Historically, spikes toward or above that parity line have coincided with stretched leverage and elevated liquidation risk. The current reading indicates the derivatives market remains relatively uncrowded, leaving room for additional speculative capital to flow in before leverage reaches historically dangerous levels.

    Distance from All-Time Highs and Bitcoin Dominance Shape Market Dynamics

    Contextualizing the rally requires examining the gap to previous peaks. Bitcoin continues to trade roughly 36% below its all-time high, while Ethereum (ETH) sits approximately 47% below its peak. Solana (SOL) remains about 61% off its high, and the aggregate altcoin market capitalization is still 54% below its former summit, per data from TradingView. At the same time, Bitcoin dominance held at a healthy 59.19% at press time, underscoring that the largest cryptocurrency still commands the majority of total crypto market capitalization. This dominance metric, combined with the deep drawdowns across major altcoins, suggests the current bounce is occurring within a broader structural downtrend rather than a fresh bull market expansion.

    Altcoin Season Index Stalls at 54, Failing to Confirm Broad Rotation

    The Altcoin Season Index, tracked by Coinglass, registered a reading of 54 at press time—squarely in the neutral zone between Bitcoin Season (below 25) and Altcoin Season (above 75). While the index has periodically climbed toward the 75+ threshold, it has consistently failed to sustain those levels. This pattern confirms that the market has not yet achieved the breadth or consistency required for a genuine altseason. A recent report by AMBCrypto reinforced this view, highlighting that although altcoins may finally be breaking out after nearly two years of stagnation, a broad, self-sustaining altcoin season has not yet arrived.

    Why This Matters

    The divergence between rising spot prices and subdued derivatives leverage presents a nuanced picture for market participants. On one hand, the low leverage ratio reduces the immediate risk of cascading liquidations that can abruptly end rallies. On the other, it signals a lack of conviction among speculative traders, who typically pile into futures during confirmed altseasons. The persistent Bitcoin dominance above 59% and the failure of the Altcoin Season Index to breach 75 suggest capital rotation remains tentative. For investors, this environment favors selectivity over broad beta exposure: assets with strong fundamentals, upcoming catalysts, or clear technical breakouts may outperform, while a indiscriminate “altcoin rally” remains contingent on a sustained shift in market structure—specifically, a decline in Bitcoin dominance toward the low-50s and a decisive close of the Altcoin Season Index above 75.

    Frequently Asked Questions

    What does the current altcoin futures open interest relative to Bitcoin indicate?

    The metric sits at -10% to -15%, below the parity risk threshold. This means altcoin derivatives positioning is not yet stretched, implying there is capacity for further speculative inflows before leverage reaches historically elevated, high-risk levels.

    Why hasn’t an altcoin season been confirmed despite the market cap recovery?

    The Altcoin Season Index at 54 has repeatedly failed to hold above 75, Bitcoin dominance remains high at 59.19%, and major altcoins are still 47–61% below their all-time highs. These factors indicate insufficient breadth and momentum for a broad-based altseason.

    How far are major cryptocurrencies from their all-time highs?

    As of the latest data: Bitcoin is ~36% below its ATH, Ethereum ~47%, Solana ~61%, and the total altcoin market cap ~54% below its peak.

  • Tom Lee Identifies Key Signs of Crypto Winter Dynamics

    Tom Lee Identifies Key Signs of Crypto Winter Dynamics

    Key Highlights

    • BitMine Chairman Tom Lee identifies ‘rage quitting’ as a defining investor behavior during crypto winters, alongside sharp price declines and leverage liquidations.
    • Bitcoin is testing the pivotal $64,000–$65,000 resistance zone, with buyers struggling to overcome dominant selling pressure.
    • Lee’s cyclical framework suggests current skepticism and forced exits historically align with potential market bottoms, offering a roadmap for traders navigating volatility.

    Tom Lee Maps the Anatomy of a Crypto Winter

    During a recent interview with Wealthion, Tom Lee, Chairman of BitMine, laid out a framework for understanding the recurring phenomenon known as the crypto winter. Lee emphasized that these downturns are not random collapses but structured cycles characterized by three distinct features: steep price declines, widespread leverage liquidation, and a behavioral pattern he explicitly labels ‘rage quitting’ among investors. According to Lee, this capitulation event—where participants abandon positions in frustration—typically clusters near the bottom of the cycle, making it a critical signal for market observers rather than a reason for panic.

    Bitcoin Tests Critical $64K–$65K Battleground

    The theoretical framework meets real-time market action as Bitcoin contends with the $64,000 to $65,000 range, a level that has repeatedly acted as both support and resistance in recent sessions. Current order-flow data shows aggressive selling defending this ceiling, while buying attempts have so far lacked the volume to sustain a decisive breakout. Lee’s observation that ‘rage quitting’ intensifies as sentiment sours aligns with on-chain metrics showing a spike in realized losses and short-term holder exits. Traders interpreting this confluence of technical resistance and behavioral capitulation are weighing whether the zone represents a distribution top or the final shakeout before a new leg higher.

    Sentiment Signals and Historical Rhymes

    Lee’s analysis draws a direct line between public skepticism—often amplified by high-profile critics—and the psychological trough of the cycle. The current wave of cautious commentary from financial media and institutional voices mirrors patterns observed in prior bear markets, where maximum pessimism preceded sustained recoveries. By framing ‘rage quitting’ as a feature of the bottoming process rather than a bug, Lee reframes the narrative: the absence of retail euphoria and the prevalence of forced selling may, paradoxically, reduce the supply overhang required for the next uptrend.

    Why This Matters

    Understanding the cyclical mechanics of crypto winters is essential for risk management and position sizing in an asset class defined by boom-bust dynamics. Lee’s framework provides a mental model that separates structural market forces—leverage flushes, miner capitulation, holder base rotation—from emotional decision-making. For institutional allocators and active traders alike, recognizing that ‘rage quitting’ signals exhaustion of weak hands rather than fundamental failure can prevent premature exits at the point of maximum financial opportunity. As Bitcoin’s price action hinges on the $64K–$65K pivot, the interplay between technical structure and behavioral extremes will likely dictate the near-term trajectory for the broader digital asset complex.

    Frequently Asked Questions

    What does Tom Lee mean by ‘rage quitting’ in crypto markets?

    ‘Rage quitting’ refers to the phenomenon where investors, frustrated by sustained losses and volatility, abruptly exit their positions near the bottom of a market cycle. Lee identifies this as a behavioral hallmark of crypto winters that historically coincides with maximum pessimism and the exhaustion of selling pressure.

    Why is the $64,000–$65,000 range so critical for Bitcoin right now?

    This price zone has acted as a key pivot point in recent trading, representing a confluence of technical resistance, psychological round numbers, and options market open interest. A decisive break above could signal renewed bullish momentum, while failure may invite a deeper correction toward lower support levels.

    How can traders use Lee’s crypto winter framework practically?

    Traders can monitor on-chain metrics such as realized loss spikes, short-term holder MVRV ratios, and funding rates to quantify ‘rage quitting’ intensity. When these indicators peak alongside extreme negative sentiment and price testing of major support, the framework suggests elevated probability of a cyclical bottom forming.