Author: Evan Mercer

  • Ethereum Users Gain Another Private Payment Option as zk.money Returns After Three Years

    Ethereum Users Gain Another Private Payment Option as zk.money Returns After Three Years

    Key Highlights

    • Aztec Labs has relaunched its zk.money wallet for private payments on the Aztec network.
    • The wallet uses $DAI initially, while deposits from Ethereum still publicly reveal the sender and amount.
    • Deposits, payments and withdrawals are capped at $2,500, with a shared $50,000 daily deposit allowance.

    Aztec Labs Relaunches zk.money for Private Payments

    Aztec Labs is bringing back its zk.money wallet, allowing users to make payments on the Aztec network with greater privacy than ordinary Ethereum transactions provide. Once funds are inside the system, zk.money hides payment activity from public view.

    “Onchain transactions between two individuals shouldn’t mean publishing your financial history to the world,” Joe Andrews, CEO of Aztec Labs, said in a statement.

    Aztec Labs selected $DAI for the wallet’s relaunch because it considers it “the most decentralized of the mass-market stablecoins used today on Ethereum.” Andrews said the wallet could support additional assets in the future.

    How zk.money Privacy Works

    Ethereum already supports applications designed to hide payments, but transactions made from a standard Ethereum wallet remain publicly visible. Aztec’s zk.money is designed to conceal payments after funds have entered its system, providing users with a private payment environment on the Aztec network.

    Privacy does not begin at the point of deposit, however. Aztec’s documentation states that moving funds from Ethereum into the system publicly reveals both the sender and the amount deposited. The recipient on Aztec can remain private, meaning the deposit itself creates a public record even when subsequent activity is concealed.

    The relaunch also includes transaction and usage restrictions. Every deposit, payment and withdrawal must be below $2,500. In addition, all users share a $50,000 daily deposit allowance, which replenishes over time. Aztec’s documentation describes these limits as a safeguard while the system is new and says that increasing them would require a new contract.

    Ethereum Privacy Proposals Remain Under Consideration

    The return of zk.money comes as Ethereum developers consider broader changes to privacy-related infrastructure. Proposals for the planned 2027 Hegotá upgrade could allow privacy applications to manage transaction approvals and fees with less reliance on external services.

    Those Ethereum proposals have not been finalized. While the network’s developers continue to evaluate the changes, Aztec Labs is making a wallet available for use directly on its own network.

    Why This Matters

    The relaunch highlights the difference between private activity within a dedicated system and the public visibility of Ethereum’s base layer. Users can receive privacy for payments conducted on Aztec, but transferring funds into the system still exposes the originating wallet and deposit amount.

    The initial $2,500 transaction cap and shared $50,000 daily deposit allowance also show that Aztec Labs is limiting the wallet’s early use while the system is new. Any expansion of those limits would require a new contract, according to the project’s documentation. Broader Ethereum changes that could make privacy applications more self-sufficient remain under consideration for the planned 2027 upgrade.

    Frequently Asked Questions

    What is zk.money?

    zk.money is an Aztec wallet designed to hide payments after funds enter the Aztec network.

    What does a deposit into zk.money reveal?

    A deposit from Ethereum publicly reveals the sender and the amount deposited. The recipient on Aztec can remain private.

    What are the zk.money transaction limits?

    Each deposit, payment and withdrawal must be below $2,500. Users share a $50,000 daily deposit allowance that replenishes over time.


  • Coinbase and Wintermute Release Key Analyses: “The Balance is Shifting in the Bitcoin-Gold Equation! This Week’s Focus Will Be This Level!”

    Coinbase and Wintermute Release Key Analyses: “The Balance is Shifting in the Bitcoin-Gold Equation! This Week’s Focus Will Be This Level!”

    Key Highlights:

    • Bitcoin has risen over the past month while gold has declined, despite their 90-day correlation approaching a record high.
    • Coinbase Institutional said marginal investment demand is favoring Bitcoin even as interest rates remain elevated.
    • Wintermute identified $82,500 as Bitcoin’s critical level this week after the cryptocurrency closed above its 50-week moving average for the first time since November 2025.

    Bitcoin Outperforms Gold Despite Near-Record Correlation

    Bitcoin is diverging from gold in recent performance, according to an analysis by Coinbase Institutional. The 90-day correlation between Bitcoin ($BTC) and gold is nearing a record high, indicating that the two assets have recently tended to move in similar directions. However, the analysis emphasized that a stronger correlation does not necessarily produce similar returns.

    Bitcoin rose over the past month, while gold declined during the same period. The divergence highlights how closely correlated assets can still deliver significantly different price movements over shorter time frames.

    Coinbase Institutional also pointed to the effect of higher interest rates on investment demand. According to the firm, new marginal demand has shifted toward Bitcoin in an environment of rising rates, with Bitcoin favored despite the higher cost of capital.

    “Bitcoin > altın. $BTC’nin altınla korelasyonu rekor düzeye yakın. Ama benzer korelasyonlar benzer getiriler anlamına gelmez. Son bir ayda $BTC yükseldi, altın ise düştü.
    The lesson we learned: Marginal demand favors bitcoin despite higher interest rates.

    Wintermute Identifies $82,500 as Bitcoin’s First Major Test

    Wintermute, a cryptocurrency market maker, has also assessed Bitcoin’s latest move. In its most recent market analysis, the company said Bitcoin closed above its 50-week moving average last week for the first time since November 2025.

    Following that advance, market attention has shifted to the $82,500 level. Wintermute described the level as critical for Bitcoin this week because it marks the upper boundary of the cryptocurrency’s previous consolidation range.

    Wintermute said that holding above $82,500 would be important for sustaining Bitcoin’s recent rally. The price has struggled to break through this area for weeks, and sustained trading above it could suggest that the first weekly close above the 50-week moving average represents a more lasting price formation rather than a temporary move.

    However, Wintermute expects Bitcoin to test $82,500 several times in the short term. A weekly close below the level could raise questions about the validity of the upward breakout, according to the market maker.

    Risk Assets Stay Strong Despite Higher Treasury Yields

    Wintermute also noted that risk assets remained strong last week even as the U.S. 10-year Treasury yield climbed above 5%, reaching its highest level since 2007. The observation places Bitcoin’s latest technical test against a backdrop of elevated bond yields and continued strength across risk-oriented markets.

    Why This Matters

    The developments show that Bitcoin and gold can maintain a high correlation while producing sharply different short-term returns. For Bitcoin, the $82,500 level now represents an important technical marker: holding above it would support the sustainability of the recent rally, while a close below it could weaken confidence in the breakout.

    Bitcoin’s position above its 50-week moving average and the continued strength of risk assets are central to Wintermute’s assessment. At the same time, Coinbase Institutional’s analysis indicates that marginal demand is currently favoring Bitcoin despite higher interest rates.

    Frequently Asked Questions

    Did Bitcoin outperform gold over the past month?

    Yes. Bitcoin rose during the last month, while gold declined, even though their 90-day correlation is nearing a record high.

    Why is $82,500 important for Bitcoin?

    Wintermute identified $82,500 as the upper limit of Bitcoin’s previous consolidation range and said that holding above it is important for sustaining the recent rally.

    What could happen if Bitcoin closes below $82,500?

    According to Wintermute, a close below $82,500 could raise questions about whether Bitcoin’s upward breakout is valid.

    This is not investment advice.

  • Shiba Inu Trendline Break Opens the Door to a Potential 26% Move: Key Targets

    Shiba Inu Trendline Break Opens the Door to a Potential 26% Move: Key Targets

    Key Highlights

    • Shiba Inu ($SHIB) rose 3.17% to $0.00000589 after finding support at $0.00000550.
    • A break above the descending trendline could support a 26% move toward $0.00000720–$0.00000730, although a drop to $0.00000575 remains possible.
    • Spot trading activity in altcoins has risen to nearly four times Bitcoin’s volume, while 87% of Binance-listed altcoins now trade above their 200-day moving averages.

    Shiba Inu Price Outlook: $SHIB Needs Support and a Trendline Break

    Shiba Inu ($SHIB) is showing early signs of recovery after finding support at $0.00000550 following the previous day’s decline. At the time of writing, $SHIB was up 3.17% over the past 24 hours at $0.00000589.

    Despite the rebound, the possibility of a further decline to $0.00000575 remains before Shiba Inu resumes a higher move, according to the chart setup. A breakout above the descending trendline could then create room for a 26% advance toward the $0.00000720 to $0.00000730 range.

    For that bullish scenario to develop, Shiba Inu must first maintain its critical support level and then break through the descending trendline. If both conditions are met, “things can move fast.”

    Altcoin Spot Volume Signals Rising Risk Appetite

    Market data from Glassnode indicates that spot traders are increasingly shifting toward altcoins, a category that includes Shiba Inu. Total spot volume for altcoins is now close to four times Bitcoin’s spot volume, marking the highest level since September 2025.

    Historically, stronger demand for higher-risk crypto assets such as altcoins has often coincided with local tops in Bitcoin. This relationship means the current increase in altcoin activity may reflect both improving risk appetite and a market phase that requires caution.

    On-Chain Data Shows a Broader Altcoin Rotation

    CryptoQuant said on-chain data suggests altcoins may be entering a more critical phase after attracting a significant share of market capital. Since June 2026, Total2—which represents the total altcoin market capitalization, including Ethereum—has absorbed more than $371 billion, a 45% increase over only a few months.

    The wider altcoin recovery is also visible among assets listed on Binance. The number of Binance-listed altcoins trading above their 200-day moving average, a widely followed long-term trend indicator, has increased sharply. In August, 80% of these altcoins were below the indicator; today, only 13% remain below it.

    Why This Matters

    Shiba Inu’s next major technical test is whether it can hold support at $0.00000550 and break above its descending trendline. At the same time, the sharp rise in altcoin volume and market capitalization suggests that capital is moving beyond Bitcoin into higher-risk assets. While that rotation could support a move toward the projected $0.00000720–$0.00000730 area for $SHIB, the historical link between heavy altcoin demand and local Bitcoin tops makes the broader market backdrop important to monitor.

    Frequently Asked Questions

    What is the current Shiba Inu price?

    At the time of writing, Shiba Inu ($SHIB) was trading at $0.00000589, up 3.17% over the previous 24 hours.

    What price levels are important for $SHIB?

    Shiba Inu found support at $0.00000550, while a possible downside move to $0.00000575 remains on the chart. A breakout above the descending trendline could target $0.00000720 to $0.00000730.

    Why are altcoins receiving increased attention?

    Glassnode reported that total altcoin spot volume is close to four times Bitcoin’s volume. CryptoQuant also said Total2 has risen by 45% since June 2026, while the share of Binance-listed altcoins trading below their 200-day moving average has fallen from 80% in August to 13% today.

  • El Salvador Launches Stablecoin App Five Years After Making Bitcoin Legal Tender

    El Salvador Launches Stablecoin App Five Years After Making Bitcoin Legal Tender

    Key Highlights

    • Sivar is built on Modveon’s Verified Operating System, combining identity verification, trusted connections, communities, payments and AI-powered services.
    • Eligible US residents can send money to verified recipients in El Salvador for a flat $2 fee, regardless of the transfer amount.
    • The platform was refined through a pre-launch rollout involving more than 25,000 Salvadorans.

    Sivar Combines Identity Verification, Communities and Payments

    Sivar is built around Modveon’s Verified Operating System, a platform that brings together verified identity, trusted connections, communities, payments and AI-powered services. In El Salvador, users can verify their accounts with their national identity card, helping establish verified profiles within the service.

    The platform also allows Salvadoran users to join communities based on geography or interests. Users can follow official government announcements and take part in live discussions and town halls, giving Sivar a community and public-information role alongside its payment services.

    Sivar Offers $2 Transfers to Verified Recipients in El Salvador

    Sivar offers eligible US residents a flat $2 fee for sending money to verified recipients in El Salvador, regardless of the transfer amount. The company said the service is designed to support transfers between the United States and El Salvador through a verified recipient network.

    The service is integrated with Coinbase. Users can fund transfers through Coinbase Onramp using US bank accounts or debit cards, while the transfers settle in stablecoins on Base. This links Sivar’s remittance offering with Coinbase’s funding infrastructure and the Base blockchain network.

    Platform Tested With More Than 25,000 Salvadorans

    Modveon said Sivar was refined through a pre-launch rollout involving more than 25,000 Salvadorans. The rollout provided a testing phase for the platform’s identity, community, government-information and payment features before broader use.

    Why This Matters

    Sivar’s model brings several digital services into one verified platform: identity confirmation, community participation, access to official announcements and cross-border payments. Its $2 flat-fee transfer option, Coinbase integration and stablecoin settlement on Base are central elements of the service’s approach to sending money to verified recipients in El Salvador.

    The pre-launch participation of more than 25,000 Salvadorans indicates that the platform was developed and refined with substantial input from users in its target market. The next stage described in the source is the continued use of Sivar’s integrated services following that pre-launch rollout.

    Frequently Asked Questions

    What is Sivar?

    Sivar is a platform built around Modveon’s Verified Operating System. It combines verified identity, trusted connections, communities, payments and AI-powered services.

    How much does Sivar charge for eligible US-to-El Salvador transfers?

    Sivar offers a $2 flat fee for eligible US residents sending money to verified recipients in El Salvador, regardless of the transfer amount.

    How are Sivar transfers funded and settled?

    Users can fund transfers through Coinbase Onramp from US bank accounts or debit cards. The transfers settle in stablecoins on Base.

  • Analyst Warns U.S. Midterm Elections Could Trigger ‘Bitcoin dump’

    Analyst Warns U.S. Midterm Elections Could Trigger ‘Bitcoin dump’

    Key Highlights

    • Bitcoin fell after the 2010, 2014, 2018 and 2022 US elections, with declines ranging from 27% to 72%.
    • Bitcoin was trading at $84,180 on September 29, 2026, after a 0.55% 24-hour gain.
    • Ali Martinez identified $73,000 as a potential support zone if the historical post-midterm pattern repeats.

    Bitcoin’s Historical Post-Election Performance Draws Attention

    Bitcoin investors are assessing whether historical price movements following US midterm elections could offer clues about market conditions ahead of November 3, 2026. The cryptocurrency declined by 72% after the 2010 election, 65% after 2014, 52% after 2018 and 27% after 2022.

    Ali Martinez highlighted the pattern while cautioning that historical correlation does not establish that elections caused the declines. “Following the 2010, 2014, 2018, and 2022 elections, $BTC fell 72%, 65%, 52%, and 27%, respectively. That does not prove elections caused the declines, but the pattern is worth watching ahead of November 3, 2026,” Martinez wrote.

    The US midterm elections are just over a month away, adding a potential source of uncertainty for Bitcoin traders. At press time on September 29, Bitcoin was trading at $84,180, up 0.55% over the previous 24 hours.

    Bitcoin price 24-hour chart. Source: Finbold

    Bitcoin’s Fourth-Quarter Record Is Mixed

    Historical fourth-quarter performance adds complexity to the outlook. Bitcoin surged 391% in the fourth quarter of 2010, but declined 16.70% in Q4 2014, 42.16% in Q4 2018 and 14.75% in Q4 2022.

    Based on the combination of prior post-midterm declines and uneven fourth-quarter performance, Martinez warned that the beginning of Q4 could bring increased volatility for Bitcoin investors. The analyst said a repeat of the historical post-midterm pattern could make the $73,000 level an important area to monitor.

    “If this post-midterm pattern repeats, Bitcoin’s short-term holder cost basis near $73,000 could become the key support zone. During confirmed bull markets, this level has often held through major corrections, potentially creating a buying opportunity if $BTC pulls back,” he wrote.

    The $73,000 area represents Bitcoin’s short-term holder cost basis and has historically acted as support during confirmed bull markets. However, Martinez had also offered a more positive medium-term outlook a day earlier, predicting a possible move toward $100,000 if Bitcoin holds above the $82,000 neckline.

    Why This Matters

    The historical data gives Bitcoin traders specific levels and time periods to watch, but it does not establish a direct causal link between elections and cryptocurrency sell-offs. Bitcoin’s fourth-quarter record has varied substantially across election cycles, meaning broader market conditions and price structure remain important factors in evaluating the outlook.

    For now, the $82,000 neckline, the potential $73,000 support zone and the November 3, 2026, election date are the key reference points identified in the analysis. A sustained hold above $82,000 would support the medium-term scenario toward $100,000, while a pullback could test the short-term holder cost basis near $73,000.

    Frequently Asked Questions

    How did Bitcoin perform after previous US midterm elections?

    Bitcoin fell 72% after the 2010 election, 65% after 2014, 52% after 2018 and 27% after 2022.

    What Bitcoin price level is being watched as potential support?

    Ali Martinez identified approximately $73,000 as a potentially important support zone because it represents Bitcoin’s short-term holder cost basis.

    What level could support a move toward $100,000?

    Martinez previously predicted a potential medium-term move toward $100,000 if Bitcoin holds above the $82,000 neckline.

  • Democrats Killed the Clarity Act

    Democrats Killed the Clarity Act

    Key Highlights:

    • No Senate Democrat voted last week to advance the Clarity Act, according to the source.
    • The legislation would have created rules for digital assets and aimed to reduce transaction costs for everyday Americans.
    • The source argues that Democratic tax proposals would increase costs for overtime, tips and Social Security recipients.

    Clarity Act stalls after Senate Democrats oppose advancement

    The Clarity Act failed to move forward last week after not a single Senate Democrat voted to advance the digital-asset legislation, according to the source. The bill was designed to establish clearer rules for digital assets and help lower transaction costs for everyday Americans.

    The vote came amid continued Democratic rhetoric about household costs and affordability. The source argues that Democrats’ opposition to the Clarity Act conflicted with those priorities and prevented the legislation from progressing.

    Read more: How months of work on the Clarity Act all fell apart

    Debate centers on household costs and taxes

    The source frames the policy debate through the impact that legislation could have on working families. It asks, Will this help single moms like the one who raised me? The argument is that policies affecting digital-asset transactions and taxes should be assessed by their effect on Americans trying to retain more of their income.

    According to the source, Democrats have long said they aim to support Americans in these circumstances, but their votes in Washington have repeatedly been portrayed as taking money from hardworking families. It specifically claims that Democrats voted to raise taxes on overtime, tips and Social Security.

    The source further states that, if Democrats’ proposals prevailed, Americans could pay hundreds of dollars more per month in taxes. Those claims are presented as part of a broader argument that voters want to keep more of their own money and that lawmakers should prioritize affordability in decisions involving taxation and digital-asset regulation.

    Why This Matters

    The Clarity Act vote highlights the continuing political dispute over how digital assets should be regulated and whether clearer rules could reduce transaction costs for consumers. The legislation’s failure to advance also shows that disagreements over taxes, affordability and financial regulation remain central to the Senate debate.

    Frequently Asked Questions

    What is the Clarity Act?

    The Clarity Act is legislation intended to establish rules for digital assets and help reduce transaction costs for everyday Americans.

    What happened to the bill in the Senate?

    According to the source, not a single Senate Democrat voted to advance the Clarity Act last week, and the bill did not move forward.

    Which tax areas does the source say are affected?

    The source says Democrats voted to raise taxes on overtime, tips and Social Security, and argues that Americans could pay hundreds of dollars more each month if Democrats’ proposals prevailed.

  • AI Predicts XRP Price as Ripple Completes Its 2026 Token Unlocks

    AI Predicts XRP Price as Ripple Completes Its 2026 Token Unlocks

    Key Highlights

    • ChatGPT’s XRP outlook ranges from a bearish $1.20–$1.35 scenario to a bullish $2.20–$2.80 outcome.
    • Ripple could return approximately 2.1 billion of the expected 3 billion XRP gross release to escrow, leaving about 900 million XRP as net new supply.
    • XRP was trading at $1.52, above its 50-day and 200-day simple moving averages, while its RSI indicated neutral momentum.

    ChatGPT’s XRP Price Prediction Covers Bearish, Base-Case and Bullish Scenarios

    ChatGPT outlined a three-part price outlook for XRP, with a bearish scenario placing the token between $1.20 and $1.35. Its base-case forecast sets a range of $1.60 to $1.90, while the bullish scenario projects XRP could reach between $2.20 and $2.80.

    The forecast assumes Ripple continues its current re-escrow strategy, in which most unlocked XRP is returned to escrow instead of entering circulation. Based on recent trends, approximately 2.1 billion XRP of the expected 3 billion XRP gross release could be re-escrowed. That would leave roughly 900 million XRP as net new supply after the final 2026 unlock cycle is completed.

    The projected net supply increase of approximately 900 million XRP would represent less than 1% of XRP’s total 100 billion-token supply. The forecast also assumes that institutional demand, XRP investment products and continued whale accumulation will help absorb the additional tokens entering the market.

    Ripple’s XRP Escrow Schedule Could Extend Through 2035

    Ripple locked 55 billion XRP into escrow in 2017 and established a schedule allowing the release of up to 1 billion XRP each month. However, Ripple generally re-escrows most of the tokens released under that schedule.

    In recent months, Ripple has re-locked approximately 700 million to 800 million XRP per month while retaining between 200 million and 300 million XRP for operational and liquidity purposes. This approach has significantly extended the original timeline for releasing the escrowed supply.

    An estimated 32 billion XRP remains in escrow. With net releases averaging approximately 300 million XRP per month, the remaining balance could take roughly nine years to deplete, potentially extending Ripple’s escrow program until 2035.

    XRP Price Analysis and Technical Levels

    At press time, XRP was trading at $1.52, down 1.69% over the previous seven days, although broader market sentiment remained bullish.

    XRP continued to trade above its key moving averages. The token’s 50-day simple moving average stood at $1.34, while its 200-day simple moving average was at $1.28. XRP’s relative strength index was 56.64, pointing to neutral momentum and leaving room for further gains.

    With the technical indicators holding firm and overall sentiment remaining positive, traders will be watching whether XRP can build enough momentum to reclaim the $1.60 level in the coming days.

    Why This Matters

    Ripple’s re-escrow activity is central to the XRP supply outlook because it limits the amount of unlocked XRP that enters circulation each month. If the company continues returning most released tokens to escrow, the net increase in circulating supply could remain relatively small compared with XRP’s total supply.

    The price scenarios also depend on whether institutional demand, XRP investment products and whale accumulation can absorb the additional tokens that do reach the market. The projected continuation of the escrow program until potentially 2035 means future XRP supply conditions may remain closely tied to Ripple’s monthly release and re-locking decisions.

    Frequently Asked Questions

    What is ChatGPT’s XRP price prediction?

    ChatGPT outlined a bearish XRP range of $1.20 to $1.35, a base-case range of $1.60 to $1.90, and a bullish range of $2.20 to $2.80.

    How much XRP could enter circulation after the final 2026 unlock cycle?

    Approximately 900 million XRP could enter circulation as net new supply if Ripple re-escrows about 2.1 billion XRP from the expected 3 billion XRP gross release.

    How long could Ripple’s XRP escrow program continue?

    With an estimated 32 billion XRP remaining in escrow and net releases averaging about 300 million XRP per month, the balance could take roughly nine years to deplete, potentially extending the program until 2035.

  • Is a New Bitcoin Rally Imminent? Binance Research Analyzes Historic Signal That Appeared After 293 Days

    Is a New Bitcoin Rally Imminent? Binance Research Analyzes Historic Signal That Appeared After 293 Days

    Key Highlights

    • Bitcoin formed a “golden cross” on September 8, when its 50-day moving average moved above its 200-day moving average.
    • Historical cases following at least 150 days below the 200-day average recorded peak gains of approximately 100% to 600% during the subsequent year.
    • Binance Research cautions that historical patterns are not guarantees, while elevated US Treasury yields and macroeconomic data remain important risks.

    Bitcoin’s September Golden Cross Echoes Earlier Recovery Periods

    Bitcoin’s latest “golden cross” has drawn attention from Binance Research because the technical formation resembles patterns seen during several previous recovery periods. Bitcoin, the highest-volume asset in the cryptocurrency market, recorded the signal on September 8, when its 50-day moving average crossed above its 200-day moving average.

    The crossover followed an extended period of weakness. Before the golden cross emerged, Bitcoin had spent 293 days below its 200-day moving average. Binance Research examined 12 previous examples of similar crossovers to assess how Bitcoin performed after prolonged periods beneath the longer-term trend indicator.

    According to the report, golden crosses that formed after Bitcoin remained below its 200-day moving average for at least 150 days were followed by peak gains ranging from approximately 100% to 600% during the next year. Binance Research stressed, however, that these figures represent the maximum gains reached during the period rather than the return generated by holding Bitcoin for exactly one year.

    The historical results were less pronounced when Bitcoin had spent a comparatively shorter period below its 200-day average. Binance Research noted that in four of the other six cases, Bitcoin’s maximum gain within one year remained below 100%. The comparison suggests that the length of the preceding period of weakness may be relevant when assessing the historical performance of a golden cross.

    Bitcoin Pattern Shows Similarities to October 2015

    Binance Research identified the current setup as particularly similar to the golden cross recorded in October 2015. Following that formation, Bitcoin surged by 150%. During the 2015 period, Bitcoin produced the technical signal after a prolonged correction, recovered from an extended period of weakness and subsequently entered its next major bull cycle.

    Despite the comparison, Binance Research emphasized that historical similarities do not guarantee future price movements. The report also highlighted the limited size of the sample and the possibility that some of the analyzed periods overlap. For those reasons, historical performance alone should not be treated as a bullish indicator for Bitcoin.

    Macroeconomic Conditions Remain Critical for Bitcoin

    Bitcoin’s improved technical picture is developing alongside continued macroeconomic pressure. Binance Research reported that the US 10-year Treasury yield had risen to 5.17%, its highest level since 2007. Higher yields and changing interest-rate expectations can weigh on Bitcoin and other risk-sensitive assets.

    The report said market participants will closely monitor both technical signals and economic data in the coming period. Inflation and employment figures will be particularly important in assessing whether Bitcoin can sustain its upward trend. The analysis does not constitute investment advice.

    Why This Matters

    The golden cross gives traders a widely followed technical signal indicating that Bitcoin’s medium-term price momentum has strengthened relative to its longer-term trend. However, the historical examples cited by Binance Research also show that the outcome has varied, and the sample does not establish a reliable forecast.

    The broader market backdrop may determine whether the signal develops into a sustained recovery. Elevated Treasury yields, interest-rate expectations, inflation and employment data could all influence demand for Bitcoin in the period ahead. Investors will therefore be watching whether the technical improvement persists while macroeconomic pressures remain in place.

    Frequently Asked Questions

    What is Bitcoin’s golden cross?

    A golden cross occurs when an asset’s 50-day moving average rises above its 200-day moving average. Bitcoin formed this pattern on September 8.

    What did Binance Research find about previous golden crosses?

    In cases where Bitcoin had remained below its 200-day moving average for at least 150 days, peak gains during the following year ranged from approximately 100% to 600%. These were maximum gains during the period, not one-year holding returns.

    What could affect Bitcoin’s performance after the signal?

    Binance Research said inflation data, employment figures, interest-rate expectations and the US 10-year Treasury yield will be important factors alongside Bitcoin’s technical signals.

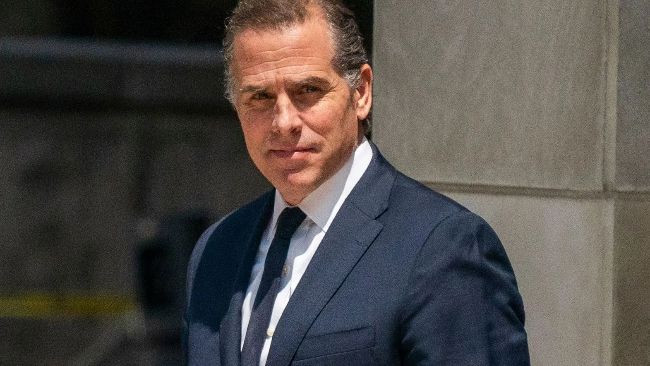
  • Hunter Biden Discusses Bitcoin, Operation Chokepoint 2.0, and $LAPTOP

    Hunter Biden Discusses Bitcoin, Operation Chokepoint 2.0, and $LAPTOP

    Key Highlights:

    • Hunter Biden’s $LAPTOP token fell more than 98% within minutes of its launch.
    • Hunter Biden attributed the crash to a failed transition from a planned centralized-exchange listing to a decentralized exchange and a missed market-maker liquidity commitment.
    • He also discussed Bitcoin adoption, crypto regulation, Michael Saylor’s Strategy, and his prediction for Bitcoin’s price in 2028.

    Hunter Biden Explains the $LAPTOP Token Crash

    Hunter Biden’s $LAPTOP cryptocurrency token dropped more than 98% within minutes of its launch, prompting him to explain the circumstances behind the sharp market collapse. In the interview, Biden discussed why the token was named $LAPTOP, how the launch plan changed, and the liquidity problems he says contributed to the crash.

    The original plan was reportedly to list $LAPTOP on a centralized cryptocurrency exchange. That approach was later replaced by a launch on a decentralized exchange. Biden said the change was accompanied by a market-maker liquidity shortfall, which he identified as a central factor in the token’s rapid decline.

    $LAPTOP Compared With the Trump Token

    The interview also examined how $LAPTOP compared with the Trump token, with discussion focused on tokenomics and transparency. The conversation placed the launch within the wider political and cryptocurrency debate, including questions about how politically associated tokens are structured, marketed, and introduced to the market.

    Biden further addressed Operation Choke Point 2.0 and lobbying involving his father. He discussed whether Democrats might eventually support Bitcoin and cryptocurrency, reflecting on the political divisions surrounding digital assets and the changing relationship between crypto and U.S. politics.

    Hunter Biden on Bitcoin, Michael Saylor and Crypto Adoption

    Beyond the $LAPTOP launch, Biden spoke about Michael Saylor and Strategy, as well as the potential use of Bitcoin payments for art. The interview also considered global Bitcoin adoption and the role digital currencies could play in transactions beyond traditional financial systems.

    Other topics included whether fiat currency is a sham, the relationship between banks, Wall Street, and Bitcoin, and the history of Silk Road and bad actors in the crypto industry. Biden also discussed what he described as crypto’s partisan shift, linking the industry’s political identity to its broader public and institutional acceptance.

    Hunter Biden’s 2028 Bitcoin Price Prediction

    The interview concluded with Hunter Biden’s prediction for Bitcoin’s price in 2028. The discussion placed that forecast alongside broader issues affecting Bitcoin’s future, including adoption, political support, financial-sector involvement, and the continuing debate over cryptocurrency regulation.

    Why This Matters

    The $LAPTOP launch highlights the risks associated with cryptocurrency token launches, particularly when a planned centralized-exchange listing changes to a decentralized-exchange release and expected liquidity is not available. A price decline of more than 98% within minutes demonstrates how quickly trading conditions can deteriorate in a newly launched token.

    The episode also connects a failed token launch with larger debates over crypto transparency, political branding, market structure, Bitcoin adoption, and the involvement of banks and Wall Street. Hunter Biden’s comments provide a broader look at how digital assets are being discussed across political and financial communities.

    Frequently Asked Questions

    What happened to Hunter Biden’s $LAPTOP token?

    Hunter Biden’s $LAPTOP token dropped more than 98% within minutes of its launch. Biden blamed the collapse on a change from a planned centralized-exchange listing to a decentralized-exchange launch and a missed market-maker liquidity commitment.

    What topics did Hunter Biden discuss in the interview?

    The interview covered the naming and launch of $LAPTOP, comparisons with the Trump token, tokenomics, transparency, Operation Choke Point 2.0, crypto lobbying, Democratic support for Bitcoin, Michael Saylor and Strategy, Bitcoin payments for art, global adoption, fiat currency, banks, Wall Street, Silk Road, and crypto’s partisan shift.

    What did Hunter Biden say about Bitcoin’s future?

    Hunter Biden shared a prediction for Bitcoin’s price in 2028 and discussed the cryptocurrency’s potential adoption, political support, and role in the global financial system.

  • Solana (SOL) ETF Beats XRP by an Unexpected 300%

    Solana (SOL) ETF Beats XRP by an Unexpected 300%

    Solana ETF Funds Surpass XRP in Net Assets

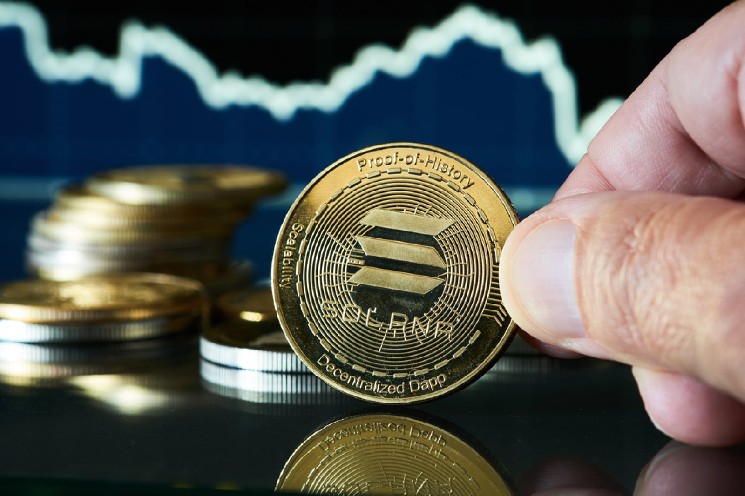
    Solana’s institutional investment products are gaining ground against XRP, with Solana funds now holding $1.93 billion in net assets compared with $1.68 billion for $XRP. Solana also has nine ETFs available, while $XRP has five.

    The shift is notable because XRP still has the larger market capitalization. $XRP is valued at $95.47 billion, compared with $70.69 billion for $SOL. However, Solana products account for 2.72% of the token’s market capitalization, significantly above XRP’s 1.76%. Daily value traded also favors Solana, at $90.43 million versus $39.37 million for $XRP.

    Solana Price Action Signals Continued Strength

    Market demand is also reflected in Solana’s price performance. $SOL moved decisively above its 200-day moving average near $95 after climbing from the $75 area in early August to approximately $119.81. The token recorded higher highs in September, reaching a local peak near $125.

    Solana’s 50-day moving average is pulling away from its 200-day moving average. Both averages are rising and arranged in a bullish stack, a technical pattern that indicates sustained upward momentum. However, the latest candles show some cooling after the move toward $125, accompanied by declining volume.

    Solana Is Strong but Not Heavily Overbought

    The relative strength index remains comfortably near 60 rather than in an extreme overbought range. This suggests that Solana has room for additional gains without immediately entering heavily overbought territory. The recent pullback from $125 provides further evidence that momentum has moderated without eliminating the broader bullish trend.

    Recent ETF Momentum Favors Solana

    Institutional appetite is currently leaning toward Solana, and ETF flows are often used as a proxy for institutional demand. XRP continues to lead in cumulative inflows, but the more recent momentum has clearly shifted toward $SOL.

    The gap in assets under management and market share could widen if $SOL holds support at $110 and inflows continue at the current rate. Solana’s ETF footprint remains modest compared with Bitcoin’s $107.82 billion and Ethereum’s $17.69 billion, but its trajectory is the more important factor in this comparison.

    Why This Matters

    Solana’s higher ETF net assets, larger number of available funds and stronger recent trading momentum indicate growing institutional participation in the network’s investment products. Although XRP retains the lead in cumulative inflows and has a larger market capitalization, Solana is currently gaining ground in the measures tied to product adoption and recent demand.

    The next indicators to watch are whether $SOL can maintain support at $110, whether ETF inflows remain elevated and whether the token’s bullish moving-average structure persists. These factors will determine whether Solana’s recent advantage develops into a broader and sustained shift in institutional demand.

    Frequently Asked Questions

    How much do Solana and XRP funds hold?

    Solana funds hold $1.93 billion in net assets, while $XRP funds hold $1.68 billion.

    How many ETFs are available for Solana and XRP?

    Solana has nine ETFs available, compared with five for $XRP.

    Is Solana currently overbought?

    Solana’s RSI is near 60, which is below an extreme overbought level. Recent price action has shown a pullback from about $125 and fading volume, leaving room for further upside according to the reported technical indicators.