Tag: Spot Bitcoin ETFs

  • Analytics Firm Says “Early Bull Run Has Begun” for Bitcoin, Shares What It Expects Next

    Analytics Firm Says “Early Bull Run Has Begun” for Bitcoin, Shares What It Expects Next

    Key Highlights

    • The DeFi Report signals Bitcoin is transitioning into the “early bull” phase, with the 50-week moving average near $80,000 serving as the critical support level to confirm the cycle shift.
    • The platform’s four-phase model projects a 9-to-12-month early bull period before a “wealth creation” phase marked by mainstream media attention, accelerated on-chain activity, and a potential tenfold surge in Solana DEX volumes.
    • Structural tailwinds—including improved liquidity conditions, deeper TradFi integration, and mobile infrastructure maturation—could propel the coming cycle beyond the previous peak, though on-chain data warns speculative assets may top out months before Bitcoin.

    The DeFi Report’s Four-Phase Cycle Framework

    In its latest market outlook, The DeFi Report argues that Bitcoin may be entering the initial stage of a new bull cycle. The analytics platform structures the market cycle into four distinct phases: “early bull,” “wealth creation,” “wealth distribution,” and “wealth destruction.” According to the analysis, current market structure is signaling a transition into the first phase, setting the stage for a multi-year expansion period that historically lasts nearly three years before a roughly one-year bearish contraction.

    Early Bull Phase Indicators and the $80,000 Support Level

    The report identifies a decisive technical threshold for confirming the early bull phase: Bitcoin must establish support around its 50-week moving average, currently sitting at approximately $80,000. This period typically spans 9 to 12 months, during which crypto-native investors begin detecting speculative activity ahead of the broader market. Complementary signals to monitor include rising Bitcoin dominance from cycle lows, the return of new users, increased DeFi incentives and marketing spend, and the launch of fresh projects—all hallmarks of early-cycle capital rotation.

    Wealth Creation Phase Dynamics and Solana’s Historical Performance

    Should the early bull phase hold, The DeFi Report anticipates a more pronounced Bitcoin rally in the subsequent “wealth creation” period. This phase is characterized by heightened mainstream media coverage, an accelerated influx of retail and institutional investors, and a measurable expansion in DeFi borrowing, leverage utilization, stablecoin supply, and on-chain transaction volumes. The platform highlights that during the prior cycle, trading volume on Solana decentralized exchanges increased approximately tenfold in this window, while Bitcoin futures funding rates and open interest also climbed sharply.

    Risk Factors in Distribution and Destruction Phases

    The analysis cautions that risks compound in the cycle’s later stages. The DeFi Report specifically notes that high-yielding speculative assets have historically peaked months before Bitcoin reaches its own top, prompting capital rotation across sectors. In the “wealth distribution” phase, a structural dynamic emerges where early-cycle investors realize profits while new entrants provide exit liquidity—a pattern that precedes the final “wealth destruction” phase and the onset of the bear market.

    On-Chain Analytics as Market Cycle Compass

    Central to The DeFi Report’s methodology is the use of on-chain data, which the platform argues differentiates crypto from traditional asset classes. By tracking investor cost bases, coin movements, and leverage accumulation across wallet cohorts, analysts can observe how supply changes hands between groups with different acquisition prices. This flow—specifically which cohort is accumulating or distributing—serves as a leading indicator for identifying the prevailing market phase.

    Structural Tailwinds for a Stronger Cycle Ahead

    The report contends that the upcoming bull cycle could surpass the magnitude of the 2020–2021 run. The previous expansion was constrained by the Federal Reserve’s balance sheet reduction, persistently elevated interest rates, capital diversion toward AI equities, and gold outperforming Bitcoin. In contrast, the current backdrop features more accommodative liquidity conditions, deeper integration of Bitcoin into the traditional financial system via spot ETFs and custody infrastructure, accelerating global crypto adoption, and the maturation of mobile application layers that lower barriers to entry for retail participants.

    Perpetual DEX Evolution: Lighter and Robinhood Integration

    On-chain perpetual trading infrastructure is singled out as a key growth vertical. The DeFi Report highlights Lighter, a perpetuals platform built within the Ethereum ecosystem, noting its product architecture and reliance on Ethereum’s security model. The platform has reportedly begun routing a significant share of its perpetual trading volume through Robinhood, signaling a convergence between decentralized trading venues and mainstream brokerage distribution channels.

    Why This Matters

    The DeFi Report’s framework offers a structured lens for navigating crypto’s cyclical volatility. By anchoring phase transitions to quantifiable on-chain metrics—such as the 50-week moving average reclaim, cohort-based cost-basis analysis, and stablecoin supply growth—the analysis moves beyond narrative-driven speculation. For market participants, the distinction between early-cycle accumulation and late-cycle distribution carries direct implications for position sizing, sector allocation, and risk management. Moreover, the identification of structural improvements—TradFi rails, mobile UX, and regulatory clarity—suggests the asset class may be maturing into a more resilient, institutionally accessible market, potentially altering the amplitude and duration of future cycles.

    Frequently Asked Questions

    What is the key technical level confirming Bitcoin’s early bull phase according to The DeFi Report?
    The critical indicator is Bitcoin establishing support around the 50-week moving average at approximately $80,000.
    How long does the early bull phase typically last, and what follows it?
    The early bull phase historically lasts 9 to 12 months and is followed by the “wealth creation” phase, marked by mainstream media attention, accelerated on-chain activity, and significant volume expansion on platforms like Solana DEXs.
    Why does The DeFi Report believe the next cycle could be stronger than the last one?
    The report cites more supportive liquidity conditions, Bitcoin’s deeper integration into traditional finance (e.g., spot ETFs), rising global crypto adoption, and mature mobile infrastructure as tailwinds absent during the previous cycle, which was hampered by Fed tightening, high rates, AI capital competition, and gold outperformance.

  • Clarity Law Fails, Bitcoin and Altcoins Drop; Analysts Say “Don’t Worry About It,” Outline Recovery Needs

    Clarity Law Fails, Bitcoin and Altcoins Drop; Analysts Say “Don’t Worry About It,” Outline Recovery Needs

    The Digital Asset Market Clarity Act failed to advance in the U.S. Senate on Tuesday, falling short of the 60-vote threshold required to proceed. The procedural vote tally stood at 49 in favor and 50 against, effectively stalling the comprehensive regulatory framework for digital assets.

    The outcome triggered immediate sell-offs across Bitcoin and altcoin markets. However, analysts speaking to The Block characterized the legislative setback as a delay rather than a structural shift for the crypto sector, emphasizing that macroeconomic forces—particularly Federal Reserve monetary policy—remain the primary driver of medium-to-long-term market direction.

    “The Failure of the Law to Pass is Not a Structural Problem”

    Arctic Digital Research President Justin d’Anethan told The Block that while the CLARITY Act’s failure was disappointing, it does not signal a fundamental market problem.

    d’Anethan pointed out that current Bitcoin price levels and previous all-time highs were achieved before the Clarity Act was in effect. He noted that institutional investors view the development not as a complete failure of the regulatory framework, but rather as a delay in the regulatory timeline. According to the analyst, interest rates and the overall monetary policy environment may be more decisive than regulatory clarity in determining the direction of the crypto market.

    Regulation Not a Key Determinant in Current Cycle

    BTC Markets crypto analyst Rachael Lucas offered a parallel assessment, stating that regulatory efforts are not a key determinant in the current crypto market cycle and that the market is more sensitive to interest rates.

    Lucas identified three critical areas for investors to monitor in the coming period:

    “1) Whether the Fed’s expected interest rate hikes will mark the beginning of a longer period of tightening, 2) Whether capital inflows into spot Bitcoin ETFs will accelerate again, 3) Whether an alternative regulatory path will emerge that can proceed without requiring 60 Senate votes.”

    Lucas added that capital is not exiting the market but concentrating in specific assets. While Congress is not strictly necessary for a fourth-quarter recovery, the analyst stressed that a prerequisite for such a rebound is for interest rates not to worsen further.

    “All Eyes Are on the FED Today!”

    Market attention has now pivoted squarely to the Federal Reserve. The U.S. central bank is expected to raise its benchmark interest rate for the first time since 2023 at today’s FOMC meeting, with a 25-basis-point increase widely anticipated. Futures markets are pricing in a higher than 90% probability of a hike at this session, with an additional increase projected before year-end.

    This is not investment advice.

  • Bitcoin Holds Firm as Ethereum Attracts Inflows: Crypto Positioning Analysis

    Bitcoin Holds Firm as Ethereum Attracts Inflows: Crypto Positioning Analysis

    Bitcoin briefly dipped to $76,700 following the release of fresh inflation data before recovering toward the $78,000 level. According to QCP Capital, this “contained” reaction signals that markets have largely priced in the prospect of a 25-basis-point rate hike.

    Technical Setup Remains Constructive

    The firm explained that $BTC‘s technical setup remains constructive at current levels, although conviction is still dependent on the broader market response to this week’s events.

    Two Very Different Bets: Bitcoin vs. Ethereum Flows

    Bitcoin is trading above a major support zone between $75,000 and $76,000, while resistance sits at $80,000 to $82,000. Ethereum, however, is showing a significantly different flow picture.

    Spot Bitcoin ETFs See Outflows Slow

    Spot $BTC ETFs recorded $462.7 million in net outflows during the holiday-shortened week. Notably, Friday’s withdrawal slowed sharply to $13.2 million compared with $282.7 million on Thursday, suggesting selling pressure may be exhausting.

    Ethereum ETFs Attract Strong Inflows

    Ethereum ETFs, meanwhile, recorded nearly $197 million in net inflows for the week. Friday’s $216.4 million influx helped drive the weekly total higher despite earlier outflows. QCP Capital said that the divergence indicated differentiated positioning between the two crypto assets. Ethereum is facing resistance at $2,500 to $2,550, while support sits at $2,400 to $2,425, with a secondary support zone located at $2,300 to $2,350.

    Low Volatility Points to Hedged Positioning

    Bitcoin volatility also remains relatively low. QCP Capital stated that the volatility curve is still upward sloping while the 25-delta risk reversal is around negative 3 volatility points. Puts are therefore moderately more expensive than calls, even as positioning remains well below stressed levels. The firm added that traders are staying hedged rather than taking a strong directional position.

    Bitcoin’s Resilience Against Tech Rout

    Several factors could influence risk appetite for crypto assets. Oil prices have moved higher following a drone attack that temporarily shut Saudi Arabia’s East-West pipeline. A prolonged disruption could add pressure to risk assets through higher energy costs and tighter financial conditions.

    At the same time, artificial intelligence-linked equities have come under pressure following public discussions about slowing AI development over safety concerns. QCP Capital said that Bitcoin’s relative resilience compared with the sharper declines across technology and semiconductor stocks is a constructive sign for its “uncorrelated positioning.” However, a deeper unwind in crowded technology trades could still spill into crypto through weaker overall risk appetite and tighter liquidity.

    Regulatory Catalyst: CLARITY Act Senate Vote

    Crypto markets also have a separate regulatory catalyst in Washington. Tuesday’s expected Senate procedural vote on the updated CLARITY Act could clarify the respective roles of the SEC and CFTC. This is expected to strengthen the medium-term case for institutional adoption by reducing regulatory uncertainty, though procedural progress would not guarantee final passage.

    More on the crypto market’s state and the upcoming key events can be found in our video below.

  • Bitcoin Rises as Markets Digest Inflation Data Ahead of Fed Rate Decision

    Bitcoin Rises as Markets Digest Inflation Data Ahead of Fed Rate Decision

    U.S. Inflation Data Delivers Mixed Signals as Core CPI Runs Hot

    The latest Consumer Price Index (CPI) report from the Bureau of Labor Statistics gave markets a mixed bag on Friday. Headline inflation rose 3.4% year-over-year and 0.4% month-over-month, both matching consensus estimates and matching July’s annual pace. However, core CPI—which excludes food and energy—told a more nuanced story. The annual core rate cooled to 2.4% from 2.5%, its lowest level since 2021, but the monthly core reading came in at 0.3%, exceeding the 0.2% analysts had forecast. That hotter-than-expected monthly core figure is the detail markets zeroed in on as the Federal Reserve approaches its September 15-16 policy meeting.

    Fed Rate Hike Probabilities Tick Up

    The report lands five days before the Fed’s next decision, the last major data point Chair Kevin Warsh’s committee will see before voting. Warsh used his first Jackson Hole keynote to say the Fed still has “work to do” on inflation. Three regional Fed presidents already dissented in favor of a hike at the July meeting, so a move would not be entirely unexpected. CME FedWatch, which tracks probabilities implied by 30-day Fed funds futures, puts the odds of a 25-basis-point hike at roughly 69%. Prediction markets are slightly more cautious: Polymarket prices the same outcome at 62%, and Myriad—the platform run by Decrypt’s parent company Dastan—has it at 61%.

    Crypto Market Rallies Despite Initial Dip

    Bitcoin initially dipped on the news but quickly reversed, climbing back toward $79,000 as the broader market digested the implications for interest rates. Ethereum led major assets higher, surging 7.48% on the day to reclaim $2,611, while Solana rose 4.53% back above $100. Zcash stood out across the top 10, gaining 23.09% over the past week alongside a 4.71% daily gain. Total crypto market capitalization climbed back near $2.7 trillion.

    Sentiment swung hard with the price action. The Crypto Fear & Greed Index, which had slipped to 56 after Thursday’s hot producer-price report, jumped back to 73—firmly in “greed” territory—while the Altcoin Season Index sits at 38, indicating Bitcoin still dominates the ecosystem as traders lack enough risk appetite for a full altcoin rotation. Spot Bitcoin ETFs continue to show a net outflow of roughly $330.5 million on the day, a reminder that this rally hasn’t yet pulled fresh institutional money off the sidelines.

    Derivatives activity climbed alongside the rally. Open interest across crypto futures rose 1.52% to $429.99 billion, with 24-hour trading volume up 2.27% to $877.11 billion. The volatile session triggered $897.09 million in liquidations, split between $493.85 million in long positions and $403.24 million in shorts.

    Bitcoin Price Analysis: Golden Cross Forms on Daily Chart

    Bitcoin opened Friday at $76,529 and briefly dipped toward the day’s $76,040 low in the minutes after the CPI print—an initial hawkish reaction before the market reversed hard. Bulls have since taken over, pushing BTC as high as $79,837 through the session. The asset now trades near $79,007, a 3.24% gain on the day and nearing the psychologically significant $80K mark.

    Bitcoin price data. Image: Tradingview

    Golden Cross Signals Medium-Term Trend Shift

    The chart’s biggest structural shift is the exponential moving average (EMA) crossover. Bitcoin’s 50-day EMA has now crossed above its 200-day EMA, forming a golden cross—a setup traders read as confirmation that the medium-term trend has flipped bullish rather than a warning of a coming reversal, which the opposite death cross would signal. The crossover just happened, meaning it is not technically confirmed yet; there isn’t yet a significant gap between both averages, so traders would be wise to keep their champagne in the refrigerator for a couple of days.

    Momentum Indicators Support Upside

    The Relative Strength Index (RSI) sits at 59.7—bullish territory and well below the 70 reading that would flag the move as overbought. The Average Directional Index (ADX), which measures trend strength regardless of direction, reads in the 40s, comfortably above the 25 threshold that separates a real trend from noise, with the DI+ line above DI- confirming buyers remain in control.

    Key Levels to Watch Ahead of Fed Decision

    The key zone to watch sits below current prices: a Fibonacci retracement drawn off the summer’s $68,858 low to the $82,281 high hit in late August places Bitcoin’s golden zone—the retracement band bulls need to defend—between $73,986 and $75,569. Above that, the $82,281 high from late August remains the level that needs to break for the rally to extend before the Fed’s rate decision on Wednesday at 2:00 PM ET.

    Myriad: $BTC next move: Pump to $84K or Dump to $55K? Click to make your prediction.

    Disclaimer: The views and opinions expressed by the author are for informational purposes only and do not constitute financial, investment, or other advice.

  • Crypto Falls Amid $386M Liquidation Wave, Rate-Hike Fears

    Crypto Falls Amid $386M Liquidation Wave, Rate-Hike Fears

    Bitcoin Volatility Spikes as Price Drops 2.5% in 14 Hours

    Bitcoin ($BTC) and the broader cryptocurrency market saw heightened volatility on September 9. The flagship asset rallied to an intraday high of $79,760 before reversing sharply, shedding 2.49% over roughly 14 hours to trade near $77,770.

    Liquidations Surge as Long Positions Unwind

    The pullback forced $BTC to retest a local support zone around $77,900. That move triggered the largest single-day liquidation total in nearly a week, with $269.96 million in long positions and $116.62 million in shorts forcibly closed, according to market data.

    Spot Bitcoin ETF Flows Show Demand Slowdown

    Institutional appetite appeared to cool. Over the prior two trading sessions, U.S. spot Bitcoin ETFs recorded a combined net outflow of $166.8 million, based on figures from Farside Investors.

    Long-Term Holders Take Profits

    On-chain analysis indicates that long-term holders have been realizing gains. Selling pressure from this cohort likely contributed to the short-term correction. However, the $76,000 demand zone held firm, preserving the bullish case for a recovery bounce.

    Key Supply Zone Remains Contested

    Between $76,000 and $82,000 lies a critical battleground. Approximately 35% of the total Bitcoin supply was accumulated at or above this range, making it a pivotal area for both bulls and bears in the longer-term outlook.

    Macro Headwinds Intensify

    The cryptocurrency retreat coincided with a broader risk-off shift. Rising oil prices reignited concerns over accelerating inflation, pushing the probability of a U.S. Federal Reserve rate hike to 60.2%.

    Technical Outlook: Bullish Structure Intact but Tested

    4-Hour Chart Holds Key Demand

    On the 4-hour timeframe, Bitcoin maintains a bullish market structure. Last week’s surge to $82,300 confirmed trend continuation. Despite the deep retracement, price remains above the $77,000 demand zone (marked in cyan on TradingView charts).

    A decisive break below $76,264 would be required to invalidate the bullish 4-hour structure and flip the bias bearish.

    Liquidation Heatmap Highlights Magnetic Levels

    CoinGlass’s 1-week liquidation heatmap identifies the nearest high-density liquidity cluster at $77,400. Volatility could pull price toward this level before a potential move higher.

    To the upside, notable magnetic zones sit at $79,700, $80,500, and $82,000 — levels traders should monitor for resistance or breakout confirmation.

    Summary

    • Negative spot ETF flows and long-term holder profit-taking drove the 24-hour retracement.
    • Over $200 million in long liquidations amplified the downside move.
    • Macro pressure persists: higher oil prices fuel inflation fears, with Fed rate-hike odds at 60.2%.
    • Short-term bias remains bullish provided the $76,000–$77,000 zone holds.
  • Missed Bitcoin Rally? Wintermute Outlines Scenarios to Catch Next Move

    Missed Bitcoin Rally? Wintermute Outlines Scenarios to Catch Next Move

    While most investors remain fixated on the U.S. Federal Reserve’s hawkish stance and count equity-market losses, institutional capital is quietly rotating into cryptocurrency. A new report from market maker Wintermute warns that traders waiting for a deeper pullback after Bitcoin’s recent breakout may miss the start of a fresh bull cycle entirely. The firm’s analysts characterize the current consolidation not as a terminus but as preparation for the next leg higher.

    Crypto Defies Macro Headwinds

    The past week delivered a stress test for risk assets. Unexpectedly strong U.S. labor data pushed the probability of another Federal Reserve rate hike to 60%, sending gold, government bonds, and technology stocks lower. Bitcoin initially followed suit, plunging from $82,400 to below $80,000, yet recovered all losses within minutes and closed the week up 3.45%. A weekly cross-asset performance ranking from Wintermute shows crypto outperforming both equities and gold during Week 36.

    Divergence From Equities Drives Resilience

    Wintermute attributes this decoupling to exhaustion in the stock market after the prolonged AI-driven rally. Investors are taking profits in equities and redeploying capital into Bitcoin and Ethereum. According to the market maker, crypto is rising for the first time in a long while not alongside stocks, but because of their decline.

    Why a 75% Crash Looks Unlikely This Cycle

    The primary bearish argument remains: We are too high. Let’s wait for a crash. Wintermute’s data, however, suggests this cycle is fundamentally different. Nearly 340 days have passed since the all-time high. In the 2018 and 2022 bear markets, Bitcoin had already shed more than 75% of its value by this stage and languished near the bottom for years. This time, the maximum drawdown has been only around 50%, and the floor of each new cycle is becoming progressively shallower.

    The catalyst is institutional participation. Major funds no longer wait for arbitrary price levels such as $20,000; they buy aggressively through spot ETFs much earlier. Nearly $1 billion has flowed into these vehicles over the past three weeks, with last Thursday recording the largest single-day inflows since January.

    Rotation Into Altcoins and AI Tokens

    The report indicates the market has entered a young cycle phase, where capital gradually migrates from the largest cryptocurrencies into riskier assets. Bitcoin and Ether provided the initial momentum, and attention is now shifting to altcoins. UNI and ARB surged nearly 40% over the week, while activity is picking up in the artificial intelligence sector—including TAO and RENDER—ahead of key December events.

    Two Critical Price Levels to Watch

    Wintermute distills the near-term outlook into two decisive zones:

    • $82,000 — A confident break above this level could trigger FOMO among cash-heavy funds, forcing them to chase the rally and propel prices higher.
    • $72,000 — This is the scenario-invalidation zone. A sustained move below it, accompanied by heavy spot ETF outflows, would put the bullish trend on hold, analysts warn.

    September CPI: The Month’s Main Test

    The next pivotal macro event arrives on September 11 with the release of the U.S. Consumer Price Index. Wintermute notes this inflation report will determine whether smart money continues rotating from equities into crypto or whether a broad-based sell-off takes hold.

  • Bitcoin ETFs Still $1 Billion Short of Breaking Even in 2026

    Bitcoin ETFs Still $1 Billion Short of Breaking Even in 2026

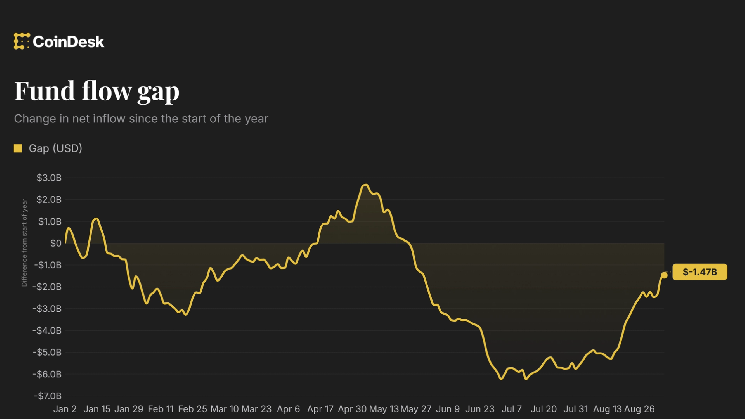
    Investor appetite for U.S.-listed spot bitcoin exchange-traded funds (ETFs) has surged in recent weeks, yet cumulative flows for 2024 remain deeply negative.

    Strong Summer Inflows Fail to Offset Spring Selloff

    Data from SoSoValue shows a dramatic turnaround in August, which attracted a massive $3.52 billion in fresh capital. Momentum carried into September, adding another $770.15 million through the early part of the month. While the winning streak signals that the worst of the mid-year market doldrums may be over, the broader arithmetic reveals a persistent deficit.

    Despite the recent rally, the funds are still down roughly $1 billion on a year-to-date basis. The primary driver of this lingering shortfall is the brutal two-month stretch in May and June, when institutional capital exited the funds at an alarming pace. June alone wiped out a staggering $4.51 billion, completely erasing the gains accumulated during March and April. Consequently, bulls still have significant ground to cover before ETF flows break even for the year.

    Macro Catalysts Loom as Critical Test

    Market participants are now focused on whether the positive momentum can withstand upcoming macroeconomic events. “The key test now is whether those inflows survive this week’s CPI and Treasury buyback,” analysts at crypto exchange Bitfinex said in a note to CoinDesk.

  • Bitcoin Price Holds Firm at $78,623 Despite Iran Strikes and Fed’s Hawkish Pivot

    Bitcoin Price Holds Firm at $78,623 Despite Iran Strikes and Fed’s Hawkish Pivot

    Bitcoin remained resilient near $78,623 on Monday despite escalating violence in the Middle East and a sharply hawkish shift in Federal Reserve policy expectations. The cryptocurrency fell just 0.7% over 24 hours as fresh U.S. military strikes on Iran pushed oil prices higher and weighed on U.S. equities.

    Bitcoin’s relatively stable performance is drawing increased attention because risk assets would typically face heavier selling under similar geopolitical and monetary pressure. The cryptocurrency was on track to finish August with a gain of more than 24%, potentially marking its strongest monthly performance since 2017.

    Bitcoin Holds Near $78,623 as August Gain Tops 24%

    According to CoinGecko data cited by Decrypt, Bitcoin fell to an intraday low near $77,162 before recovering to trade around $78,623. The daily decline was modest compared with the scale of the weekend’s geopolitical developments and the market’s reaction to the Federal Reserve’s latest policy signals.

    Holding above $78,000 while geopolitical tensions and rising interest-rate expectations weigh on markets could indicate underlying demand rather than momentum-driven buying alone. However, derivatives activity suggests traders are adjusting existing positions instead of committing significant new capital.

    Ethereum Gains Nearly 30% Despite Fund Outflows

    Ethereum traded near $2,448 on Monday. Although Ether was slightly lower on the day, it was still approaching a monthly gain of 30%.

    Ethereum’s price strength contrasted with continued cash outflows from Ethereum investment funds. The divergence between Ether’s price and fund flows may indicate that investors are taking profits or shifting capital elsewhere even as the cryptocurrency’s market performance remains strong.

    U.S. Strikes on Iran Push Oil Higher and Stocks Lower

    The latest exchange of strikes between the United States and Iran was the first since late July. The developments renewed concerns about potential shipping disruptions in the Strait of Hormuz, a critical energy chokepoint whose closure could affect global oil supplies.

    West Texas Intermediate crude futures rose 2.6% to approximately $85.60 a barrel. Higher oil prices can intensify inflation expectations, adding pressure to central banks that are already considering whether further interest-rate increases may be necessary.

    U.S. stocks also declined. The S&P 500 fell 0.5% to about 7,673, while the Nasdaq Composite dropped 0.4%. Bitcoin’s limited decline stood out because the cryptocurrency has historically followed, and at times amplified, movements in technology-heavy indexes such as the Nasdaq.

    Hawkish Federal Reserve Remarks Lift September Rate-Hike Odds

    Geopolitical tensions were not the only factor affecting markets. Federal Reserve Chair Kevin Warsh delivered hawkish remarks at Jackson Hole, prompting investors to quickly reassess the likelihood of a September rate increase.

    The probability of a September hike rose to roughly 58%, up from about 35% before Warsh’s comments. The change represented a significant shift from the more accommodative policy outlook previously priced into markets.

    The stronger rate outlook also affected gold. The traditional safe-haven asset fell to near $4,440, as the impact of higher interest-rate expectations outweighed demand linked to rising geopolitical risk.

    Bitcoin Rally Slows as Spot ETF Inflows End

    Bitcoin’s August rally began losing momentum late last week after Warsh’s remarks. Spot Bitcoin exchange-traded funds also ended a nine-day streak of net inflows, reversing a period of sustained institutional buying.

    The shift is consistent with a broader reduction in risk exposure as investors prepare for the possibility of another Federal Reserve rate increase. Ethereum ETFs continued to experience cash outflows, extending a trend that began before the Jackson Hole event.

    Derivatives Volume Points to Trader Repositioning

    Iliya Kalchev, an analyst at Nexo Dispatch, viewed Bitcoin’s stability as the week’s more important development, potentially more significant than its monthly gain. He noted that it is unusual for an aggressive Federal Reserve stance and an active geopolitical conflict to pressure risk assets during the same week while Bitcoin continues to hold its ground.

    Derivatives data showed that 24-hour trading volume more than doubled to $183 billion, while open interest remained broadly unchanged. The combination suggests traders were repositioning existing bets rather than bringing substantial new capital into the market.

    That distinction is important when assessing Bitcoin’s market direction. Rising volume alongside flat open interest generally indicates that capital is rotating between positions rather than entering through a wave of new buying. The data points to a market recalibrating in real time, rather than one developing clear conviction in either direction.

    Jobs Data and CPI Are Next Tests for Bitcoin

    Gold’s decline toward $4,440 highlights the extent to which interest-rate expectations have changed market sentiment. Oil typically rises and stocks often fall during geopolitical shocks, while gold usually benefits from safe-haven demand. In this case, the increased probability of a Federal Reserve rate hike outweighed that traditional pattern.

    The next major catalysts for Bitcoin are the U.S. jobs report due Friday and the August Consumer Price Index reading scheduled for September 11. The data will help determine whether the Federal Reserve proceeds with a September rate increase and whether Bitcoin’s recent resilience continues.

    Because Bitcoin’s recent price movements have closely followed changes in rate expectations, the two economic reports could provide an important test of whether August’s gains represent a temporary rally or the foundation for a sustained advance.

    Frequently Asked Questions

    How did Bitcoin perform in August 2026?

    Bitcoin traded near $78,623 and was on track to finish August up more than 24%. That would make it the cryptocurrency’s strongest month since 2017, despite geopolitical tensions and shifting Federal Reserve policy expectations.

    How did the U.S. strikes on Iran affect traditional markets?

    The strikes pushed West Texas Intermediate crude prices up 2.6% to approximately $85.60 a barrel. The S&P 500 fell 0.5%, while the Nasdaq Composite declined 0.4%.

    How did Kevin Warsh’s Jackson Hole remarks affect markets?

    Warsh’s hawkish comments increased the estimated probability of a September Federal Reserve rate hike to roughly 58%, up from about 35%. Bitcoin’s rally subsequently slowed, and spot Bitcoin ETFs ended a nine-day inflow streak.

    What does derivatives data reveal about Bitcoin trading?

    Derivatives volume more than doubled to $183 billion over 24 hours, while open interest remained broadly flat. The pattern indicates that traders were repositioning existing positions rather than adding significant new capital.

  • Bitcoin Holds Steady as US Strikes on Iran Rattle Stocks and Send Oil Prices Higher

    Bitcoin Holds Steady as US Strikes on Iran Rattle Stocks and Send Oil Prices Higher

    Bitcoin remained above $78,000 on Monday despite fresh U.S. strikes on Iran, higher oil prices and losses across major stock indexes. The cryptocurrency traded near $78,623, down 0.7% over 24 hours, after falling to an intraday low of about $77,162, according to CoinGecko.

    Despite the daily decline, Bitcoin is on track to finish August more than 24% higher. That would make it the cryptocurrency’s strongest monthly performance since 2017.

    Bitcoin holds steady as geopolitical risks rise

    The weekend saw the first exchange of U.S.-Iran strikes since late July, renewing concerns about shipping through the Strait of Hormuz and driving crude oil prices higher.

    West Texas Intermediate futures rose 2.6% to approximately $85.60 a barrel. U.S. equities moved lower, with the S&P 500 down 0.5% at around 7,673 and the Nasdaq Composite falling 0.4% to about 26,289.

    Iliya Kalchev, an analyst at Nexo Dispatch, said Bitcoin’s resilience was more significant than its August gain. Kalchev noted that a hawkish Federal Reserve and an active geopolitical escalation rarely affect risk assets in the same week, making Bitcoin’s ability to hold its ground against both pressures a notable signal.

    Kalchev also pointed to derivatives data indicating that traders may be repositioning rather than adding significant new capital. Twenty-four-hour trading volume more than doubled to $183 billion, while open interest remained broadly unchanged.

    Fed policy weighs on crypto markets

    Bitcoin also faced pressure from Fed Chair Kevin Warsh’s hawkish address at Jackson Hole. Expectations for a September rate hike climbed to approximately 58%, compared with about 35% before his remarks.

    Gold also declined, slipping to nearly $4,440 as the stronger interest-rate outlook outweighed its typical safe-haven appeal.

    Bitcoin’s August rally lost momentum late last week following Warsh’s comments. Spot Bitcoin ETFs ended a nine-day streak of inflows, while Ethereum funds continued to attract investor money.

    Ethereum traded near $2,448 on Monday, registering a modest decline while remaining on course for an August gain approaching 30%.

    Market attention now shifts to Friday’s U.S. jobs report and the August consumer price index reading scheduled for September 11.

  • Bitcoin Barely Moves as U.S. Hits Iran, Sending Oil Prices Higher and Stocks Lower

    Bitcoin Barely Moves as U.S. Hits Iran, Sending Oil Prices Higher and Stocks Lower

    Geopolitical tensions have returned to financial markets, pushing oil prices higher. Bitcoin, however, remained steady during Asian trading hours, demonstrating resilience and continuing to outperform gold and equities—a trend that has persisted throughout August.

    Oil prices climbed on both sides of the Atlantic after the United States attacked an Iranian island in the Strait of Hormuz, a major oil-tanker route that has faced disruption since the conflict began six months ago. Iran responded with retaliatory action.

    Oil rises as markets react to Strait of Hormuz tensions

    WTI crude futures jumped nearly 2% to $85.10, while Brent crude rose 1.9% to $92.39, according to TradingView. Gold fell 0.8% to $4,418 per ounce, and Nasdaq futures slipped 0.5% amid declines across Asian equity markets.

    Bitcoin outperforms gold and stocks

    Bitcoin traded near $77,580, remaining largely unchanged since midnight UTC, according to CoinDesk. $BTC’s price has risen 23% this month, compared with a 9% gain for gold and a 4% increase for the Nasdaq.

    Other major cryptocurrencies traded slightly lower. Payments-focused $XRP ($XRP) declined 0.8%, while Solana (SOL) fell 0.6%.

    Bitcoin’s continued outperformance may be linked to strong inflows into spot exchange-traded funds and expectations of aggressive Federal Reserve intervention following the Treasury’s bond buyback program.