
Tag: CryptoQuant

  • Unprecedented Bitcoin Event Occurs on Binance for First Time Since 2023

    Unprecedented Bitcoin Event Occurs on Binance for First Time Since 2023

    Key Highlights

    • Binance recorded its highest single-day net Bitcoin outflow since 2023, exceeding 13,800 BTC, while exchange reserves dropped by roughly 20,000 BTC in four days.
    • Bitcoin has surged approximately 45% since July, holding above $82,000 for consecutive sessions and clearing key technical resistance levels.
    • CryptoQuant analyst Darkforth suggests the outflows signal a shift toward long-term holding and potential FOMO-driven re-entry, reducing available supply and limiting near-term selling pressure.

    Binance Sees Record Bitcoin Outflows as Price Surges Past $82,000

    Bitcoin’s sustained rally above the $82,000 threshold has triggered a historic withdrawal wave from Binance, the world’s largest cryptocurrency exchange by volume. According to on-chain data highlighted by CryptoQuant analyst Darkforth, the platform recorded a single-day net outflow surpassing 13,800 BTC, marking the largest such movement since 2023. Over the preceding week, Binance averaged roughly 2,000 BTC in daily net outflows, but the recent spike suggests a notable acceleration in investor behavior as the asset consolidates gains of approximately 45% from its July lows.

    Exchange Reserves Drop 20,000 BTC in Four Days, Tightening Market Supply

    The outflow surge has directly depleted Binance’s Bitcoin reserves, which fell from approximately 705,000 BTC to 685,000 BTC in just four days—a reduction of 20,000 BTC. Given that Binance holds an estimated 30% of all Bitcoin custodied on centralized exchanges accessible to retail investors, this drawdown represents a meaningful contraction in the immediately available supply. Darkforth notes that the persistent movement of coins off exchanges typically indicates a preference for long-term cold storage over active trading, a dynamic that structurally reduces the liquid supply available to meet potential sell orders.

    Analyst Flags FOMO Re-Entry as Potential Driver Behind Sudden Withdrawal Spike

    While the broader trend supports a bullish accumulation narrative, Darkforth cautions that the sudden magnitude of the latest outflows may also reflect a psychological shift. The analyst observes that investors who remained sidelined during prior bear-market declines—anticipating further drops—may now be re-entering the market driven by fear of missing out (FOMO) as prices break out. This behavior could amplify volatility if new holders lack conviction, but the net effect remains a reduction in exchange-held coins, which historically correlates with upward price pressure when demand remains steady.

    Why This Matters

    The confluence of technical breakout, declining exchange reserves, and record outflows from the industry’s dominant trading venue underscores a potential supply shock in the making. With Binance commanding nearly a third of centralized exchange Bitcoin holdings, its reserve trends serve as a bellwether for broader market liquidity. A sustained decline in exchange balances typically precedes periods of reduced sell-side pressure, as fewer coins are readily accessible for immediate liquidation. However, the mixed signals—genuine accumulation versus speculative FOMO inflows—warrant close monitoring of on-chain metrics such as coin days destroyed and holder unrealized profit/loss ratios to gauge the durability of the current holder base. The next critical test will be whether Bitcoin can maintain its footing above $82,000 during inevitable profit-taking episodes, or if the recent outflow spike proves to be a local peak in conviction.

    Frequently Asked Questions

    What caused the record Bitcoin outflow from Binance?
    The outflow coincided with Bitcoin’s rally above $82,000 and a 45% gain since July. Analysts attribute the movement to a combination of long-term accumulation (moving coins to cold storage) and potential FOMO-driven buying from investors re-entering the market after missing earlier lows.
    How much Bitcoin does Binance hold compared to other exchanges?
    Binance holds approximately 30% of all Bitcoin custodied on centralized exchanges accessible to investors, making its reserve levels a significant indicator of overall market liquidity.
    Does the outflow guarantee Bitcoin’s price will keep rising?
    Not necessarily. While declining exchange reserves reduce immediate selling pressure and are historically bullish, price direction depends on sustained demand. The analyst notes that some outflows may stem from speculative FOMO buying, which could reverse quickly if sentiment shifts.

    This is not investment advice.
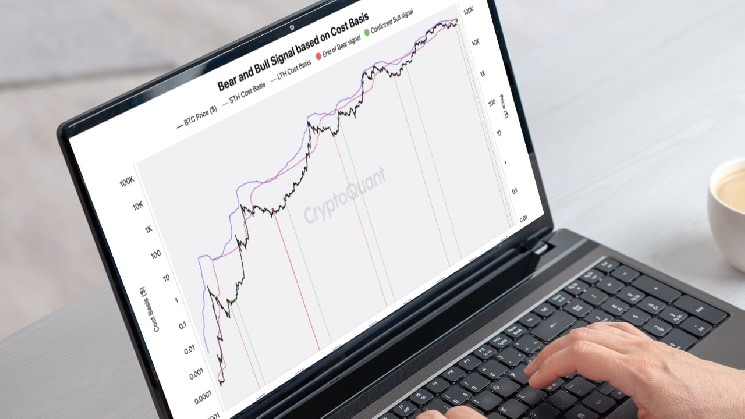
  • ‘Bull Market Confirmed’: Analyst Identifies Bitcoin’s Fifth Historic Signal

    ‘Bull Market Confirmed’: Analyst Identifies Bitcoin’s Fifth Historic Signal

    Key Highlights

    • Cryptoquant contributor Darkfost identifies a fifth historical bull market signal for Bitcoin on September 24, marking the first such crossover since 2023 and joining prior signals in 2012, 2015, 2019, and 2023.
    • The signal triggers when the short-term holder cost basis rises above the active long-term holder cost basis, using a seven-year activity filter that excludes over 3.5 million dormant BTC untouched for a decade or more.
    • U.S. spot Bitcoin ETFs recorded $2.06 billion in net inflows over three consecutive days (Sept. 21–23), led by a record $999 million single-day inflow on Sept. 21, coinciding with the signal’s confirmation.

    Fifth Cost-Basis Crossover Confirms Bull Market Structure

    A new on-chain metric flashed a bullish confirmation for Bitcoin on September 24, marking the fifth time in the asset’s history that the average acquisition cost of short-term holders has surpassed that of active long-term holders. The analysis, published by Cryptoquant contributor Darkfost, identifies the crossover as a recurring structural signal that has preceded sustained upward moves in each of the four prior cycles.

    In a post on X, the analyst stated: “Bull Market Confirmed … This is the 5th occurrence, which gives a bit more credibility to the dynamic bitcoin is putting in place, though there’s always a margin for error, and I prefer to point that out.” The comment underscores both the statistical weight of the pattern and the inherent uncertainty in any single indicator.

    The metric compares two distinct cost bases: the average price paid by short-term holders versus the average price paid by active long-term holders. Crucially, the long-term cohort is filtered to include only coins that have moved at least once in the past seven years. This design excludes deeply dormant supply—estimated at more than 3.5 million BTC older than ten years—which the analyst argues would otherwise distort the measure of genuine holder conviction.

    Defining Active Long-Term Holders: The Seven-Year Filter

    The seven-year activity threshold serves a different analytical purpose than the standard 155-day holding period used by firms such as Glassnode to separate short-term from long-term supply. While Glassnode’s definition classifies any coin held longer than roughly five months as long-term, Darkfost’s additional filter asks whether that long-term coin has shown any on-chain life in the last seven years. Coins that have not are treated as effectively lost or permanently dormant and removed from the active cost-basis calculation.

    The analyst acknowledges the cutoff is arbitrary but notes its practical relevance. The dormant pile grows by an estimated 8,000 to 30,000 BTC each month, and its monthly change has turned negative only once since 2019—when an early miner moved approximately 100,000 BTC. Notably, coins inactive for five to 15 years resumed movement in 2026, demonstrating that even decade-old supply can re-enter circulation and validating the decision to track active versus dormant segments separately.

    ETF Inflows Provide Liquidity Backdrop for the Signal

    The cost-basis crossover arrived alongside a surge of institutional demand via U.S. spot Bitcoin exchange-traded funds. According to daily flow data from Farside, the funds attracted $2.06 billion in net inflows across the three sessions from September 21 through September 23. Every session printed positive flows, though the pace decelerated sharply after the opening day.

    September 21 saw the largest single-day inflow of 2026 at $999 million. The following day added $714.7 million, and September 23 contributed $346.9 million. The three-day sequence coincides with the period in which the on-chain signal confirmed, lending circumstantial support to the argument that fresh ETF liquidity is reinforcing the shift in holder economics. The analyst cautions, however, that the flow data establishes correlation during the signal window, not causation of the crossover itself.

    Spot Bitcoin ETFs allow investors to gain exposure through brokerage-traded shares backed by actual BTC held by the fund, lowering the operational barrier for institutional allocators and wealth managers who cannot or prefer not to custody digital assets directly.

    Cycle Outlook: Tempered Volatility, Multi-Fold Returns

    The bullish signal and ETF momentum are being framed within a broader cycle thesis. In a separate assessment published September 22, Cryptoquant founder and CEO Ki Young Ju argued that the market’s expanding size and deepening institutional ownership could dampen the extreme boom-bust amplitude characteristic of earlier cycles. His base-case forecast projects threefold to fivefold returns for Bitcoin this cycle, followed by a milder bear market drawdown than historical norms.

    Why This Matters

    The fifth cost-basis crossover matters because it represents a rare confluence of on-chain holder behavior and institutional capital flows. Prior occurrences in 2012, 2015, 2019, and 2023 each preceded significant bull-market legs, suggesting the metric captures a fundamental shift in the marginal buyer—from long-term accumulators to newer participants willing to pay higher average prices. The seven-year activity filter refines this insight by focusing on economically active long-term holders, filtering out supply that behaves more like lost coins than invested capital. Meanwhile, the $2.06 billion in ETF inflows over three days—anchored by a record $999 million session—signals that traditional financial infrastructure is now a primary vector for Bitcoin demand. If Ki Young Ju’s cycle thesis holds, the combination of structural on-chain signals and sustained institutional flows could produce a cycle defined by steadier appreciation and shallower corrections, reshaping risk expectations for both retail and institutional participants.

    Frequently Asked Questions

    What exactly is the “fifth bull market signal” identified by Cryptoquant?

    It is the fifth historical occurrence where the short-term holder realized price (average acquisition cost of coins held less than ~155 days) crosses above the active long-term holder realized price (average cost of coins held longer than 155 days that have also moved at least once in the past seven years). Previous crossovers appeared in 2012, 2015, 2019, and 2023.

    Why does the analysis exclude Bitcoin that hasn’t moved in over seven years?

    The analyst treats coins untouched for seven-plus years as dormant or effectively lost supply. Including them in the long-term holder cost basis would dilute the measure of active holder conviction. Over 3.5 million BTC fall into this category, growing by 8,000–30,000 BTC monthly, with only one monthly decline since 2019.

    Did the ETF inflows cause the bullish crossover?

    The data shows the $2.06 billion in net ETF inflows (Sept. 21–23) coincided with the signal’s confirmation, but the analyst explicitly states the flows “do not establish that ETF buying caused the crossover.” The inflows provide liquidity context, not proof of causation.

  • CryptoQuant CEO Ki Young Ju Predicts Bitcoin Could Surge 3-5x This Cycle

    CryptoQuant CEO Ki Young Ju Predicts Bitcoin Could Surge 3-5x This Cycle

    Key Highlights

    • CryptoQuant CEO Ki Young Ju forecasts Bitcoin appreciation of 3–5x in the current bull cycle, significantly below the 10x+ gains seen in prior cycles.
    • Growing institutional participation and market maturation are reducing both upside volatility and downside crash risk, potentially making future bear markets milder.
    • Ki argues this structural shift positions Bitcoin as a long-term capital preservation asset rather than a short-term speculative vehicle, with transformative implications for the global financial system if adoption as a functional currency accelerates.

    CryptoQuant CEO Projects Tempered Bitcoin Returns Amid Market Maturation

    CryptoQuant founder and chief executive Ki Young Ju has revised expectations for Bitcoin’s current bull cycle, suggesting the asset may climb only three to five times its present value rather than repeating the tenfold or greater surges characteristic of earlier market phases. In a post published on X, Ki attributed the moderated outlook to the cryptocurrency’s expanding market capitalization and the rising dominance of institutional investors, factors he says are fundamentally altering Bitcoin’s volatility profile.

    Institutional Growth Dampens Speculative Extremes

    Ki explained that during Bitcoin’s earlier stages, a comparatively small market cap and heavy reliance on retail participants left prices acutely sensitive to short-term speculative flows. That structure, he noted, routinely produced parabolic rallies followed by drawdowns as deep as 80 percent. As institutional capital assumes a larger share of ownership, the analyst argues, the market’s depth increases, compressing volatility in both directions and lowering the probability of both explosive melt-ups and catastrophic crashes.

    Shift Toward Long-Term Store of Value

    The CryptoQuant chief framed this evolution as a positive development for the asset class, contending that reduced cyclicality makes Bitcoin better suited for long-term capital allocation rather than short-term trading. He further speculated that should Bitcoin eventually achieve sufficient stability and gain widespread adoption as a functional medium of exchange, the resulting transformation of the global financial architecture could extend well beyond anything currently anticipated by market observers.

    Why This Matters

    Ki Young Ju’s assessment reflects a growing consensus among on-chain analysts that Bitcoin’s risk-return profile is normalizing as the asset graduates from a niche speculative instrument to an institutional-grade treasury reserve. The increasing presence of spot Bitcoin ETFs, corporate treasuries, and sovereign wealth fund allocations deepens liquidity and lengthens holder time horizons, structurally suppressing the boom-bust cycles that defined the 2013, 2017, and 2021 peaks. For investors, this implies a recalibration of expectations: lower maximum upside per cycle in exchange for shallower drawdowns and a higher probability of multi-year compounding. At a macro level, a Bitcoin that behaves more like a low-volatility monetary asset than a high-beta tech stock could accelerate its integration into global payment rails, central bank reserves, and cross-border settlement layers—a transition that would indeed reshape financial infrastructure in ways current models struggle to capture.

    Frequently Asked Questions

    What specific price multiple does Ki Young Ju expect for Bitcoin in this bull cycle?

    Ki Young Ju projects a 3–5x appreciation from current levels, contrasting with the 10x+ multiples observed in previous bull markets.

    Why does Ki believe future bear markets will be less severe?

    He cites the growing share of institutional investors and a larger market capitalization, which together deepen liquidity and reduce the influence of short-term speculative capital that historically amplified both rallies and crashes.

    Does Ki Young Ju’s analysis constitute investment advice?

    No. The original post explicitly includes a disclaimer stating “This is not investment advice.”

  • XRP Drains From Exchanges as Data Points to Potential Rally

    XRP Drains From Exchanges as Data Points to Potential Rally

    Key Highlights

    • Binance XRP reserves recorded a net negative flow of approximately 102,912 tokens as outflows dropped 25.96% versus a 20.37% decline in inflows, signaling holders are moving supply off-exchange during the price rally.
    • Whale inflows to Binance surged to 1.6 billion XRP over the prior 30 days—the highest since March—yet exchange reserves rose only 0.22% above the quarterly baseline, indicating high turnover and repositioning rather than distribution.
    • XRP’s fully diluted market cap remains elevated near $139 billion despite the pullback from $150 billion peak, while circulating-supply market cap holds around $94 billion, suggesting no fresh wave of exchange selling has materialized.

    Binance Exchange Reserves Signal Accumulation Over Distribution

    XRP traded at $1.5176 on September 22, consolidating within a daily range of $1.5062 to $1.5398 after retracing from a session high of $1.57. While the pullback may appear to signal fading momentum, on-chain exchange data from CryptoQuant paints a more constructive picture. Binance, the largest centralized venue for XRP, has seen its token reserves contract. Inflows to the exchange declined 20.37%, but outflows fell more sharply at 25.96%, producing a net outflow of roughly 102,912 XRP. Because tokens held on exchanges are immediately available for sale, this net reduction in exchange-held supply suggests a cohort of holders is withdrawing tokens to private wallets rather than liquidating into the recent recovery.

    Whale Activity Shows High Turnover, Not Selling Pressure

    Adding nuance to the reserve data, CryptoQuant contributor Arab Chain reported that large-wallet inflows to Binance reached approximately 1.6 billion XRP over the previous 30 days, marking the highest cumulative reading since March after a lull in May through July. Yet Binance’s total XRP reserve ended the week at 2,630,628,140 XRP—only 0.22% above its quarterly baseline and 0.34% higher week-over-week. The disconnect between massive whale inflows and minimal reserve growth points to elevated turnover: whales are actively moving large volumes, but the tokens are not accumulating on the exchange order books. This pattern aligns with repositioning or custodial rotation rather than a coordinated distribution campaign.

    Market Cap Resilience Supports Bullish Structure

    Broader capitalization metrics reinforce the absence of heavy selling pressure. XRP’s fully diluted market cap, which accounts for all tokens in existence, expanded from roughly $103 billion early in the rally to over $150 billion at the peak before settling near $138.97 billion. The circulating-supply market cap currently sits closer to $94 billion. Despite the price correction from the rally high, both measures remain elevated while net exchange flows stay negative. This combination indicates the pullback has not yet triggered a significant increase in exchange-available supply, preserving the underlying bullish structure.

    September Seasonality Presents Historical Headwind

    One countervailing risk factor is XRP’s September seasonal track record. In seven of the past eight years, September performance moved opposite to August’s direction. In the two instances where August closed positive—2020 and 2021—September delivered declines of 14% and 19.6%, respectively. This pattern is especially relevant in 2024 because XRP posted a 30% gain in August, its strongest August since 2021. While seasonal tendencies are not deterministic, the historical precedent adds a potential headwind as the month enters its final stretch.

    Why This Matters

    The divergence between surging whale inflows and flat exchange reserves highlights a critical analytical distinction for crypto market participants: large on-exchange movements do not automatically equate to selling intent. When reserves fail to grow despite heavy inflows, it often signals that sophisticated actors are rotating custody, rebalancing across venues, or positioning for future catalysts rather than exiting positions. For XRP specifically, the negative net flow during a price advance suggests conviction among holders who anticipate higher levels. However, the strong August performance combined with a historically bearish September seasonal profile creates a tactical tension. Traders and investors should monitor the $1.55 resistance for a breakout toward $1.68 and the $1.4860 support zone for structure validation, while weighing seasonal probability against the current on-chain evidence of accumulation.

    Frequently Asked Questions

    What does a net negative exchange flow mean for XRP price action?
    A net negative flow indicates more XRP is leaving Binance than entering, reducing the immediately sellable supply on the exchange. This typically reflects holder conviction and can support prices during rallies by limiting available liquidity for selling.
    Why are whale inflows rising while Binance reserves stay flat?
    The 1.6 billion XRP in whale inflows over 30 days has not translated into higher reserves because outflows are matching or exceeding inflows. This suggests whales are actively trading or moving tokens between custodial solutions rather than depositing to sell.
    How reliable is XRP’s September seasonal pattern as a trading signal?
    Seasonal patterns are statistical tendencies, not deterministic rules. While seven of the last eight Septembers moved opposite to August, and the two post-positive-August years saw double-digit declines, market structure, macro conditions, and token-specific catalysts can override historical seasonality.
  • What’s Driving Bitcoin’s Rise? Glassnode and CryptoQuant CEOs Explain

    What’s Driving Bitcoin’s Rise? Glassnode and CryptoQuant CEOs Explain

    Key Highlights

    • Bitcoin surged past $85,000 as short-position liquidations between $82,000 and $86,000 accelerated upward momentum, according to Glassnode on-chain data.
    • CryptoQuant CEO Ki Young Ju confirmed Bitcoin has reclaimed the critical 365-day moving average at approximately $83,000, a level widely watched to signal the end of the bear market.
    • Analysts suggest sustained trading above the 365-day MA could trigger increased buying pressure from trend-following and institutional investors driven by FOMO.

    Short-Position Liquidations Fuel Bitcoin’s Break Above $85,000

    Bitcoin opened the week with a decisive move above the $85,000 threshold, marking its highest level in months. On-chain analytics firm Glassnode attributes the acceleration to a cascade of short-position liquidations clustered between $82,000 and $86,000. According to Glassnode data, a significant volume of short liquidity had accumulated in this range over recent months. When Bitcoin failed to produce the sharp pullbacks many traders anticipated, those holding short positions were forced to buy back $BTC to cover, creating a feedback loop that propelled prices higher.

    Glassnode analysts described the dynamic in their latest assessment: “As expected, Bitcoin quickly broke through the short liquidation wall.” They elaborated that the rejection at this level proved insufficient to halt the advance: “Short positions accumulated between $82,000 and $86,000 over the months, but the rejection at that level was insufficient. Now these short positions have become fuel, because these traders need to buy back $BTC.” This short-covering rally has effectively turned prior bearish positioning into buying pressure.

    365-Day Moving Average Reclaimed: A Critical Bull-Market Signal

    Adding weight to the bullish narrative, CryptoQuant CEO Ki Young Ju posted on X that Bitcoin has reclaimed its 365-day moving average, currently situated near $83,000, with price action holding above $84,000. Ju emphasized that this long-term trend indicator is a primary reference point for market participants assessing whether the bear market has concluded. CryptoQuant has historically treated a sustained breakout above the 365-day MA as a confirmation signal for a new bull market cycle.

    Ju’s commentary underscored the psychological and structural importance of the level: “Bitcoin reclaimed the 365MA at the $83,000 level and is currently sitting above $84,000.” He further noted the potential for momentum-driven inflows: “This is the line everyone is watching for the end of the bear market. If it holds, momentum will start to drive traders and institutions crazy with FOMO. This is where things get fun.”

    Why This Matters

    The confluence of short-covering dynamics and a key long-term technical reclamation presents a noteworthy inflection point for Bitcoin. The $82,000–$86,000 zone had acted as a liquidity magnet for bearish bets; its clearance removes a structural overhang and may reduce near-term selling pressure from forced liquidations. Simultaneously, the 365-day moving average reclaim is widely regarded by quantitative analysts and institutional desks as a regime-change filter. A daily close above this level, if sustained, could unlock algorithmic trend-following strategies and encourage capital allocation from funds that mandate bull-market confirmation before deploying size. Market participants will now monitor whether Bitcoin can establish support above the 365-day MA and the $84,000–$85,000 band, which would strengthen the case for a durable uptrend.

    Frequently Asked Questions

    What caused Bitcoin’s rapid move above $85,000?

    The surge was driven by a cascade of short-position liquidations. Glassnode data shows a large concentration of short bets between $82,000 and $86,000. When price failed to reverse sharply in that zone, short sellers bought back $BTC to cover, creating a self-reinforcing upward spiral.

    Why is the 365-day moving average so important?

    The 365-day moving average (currently ~$83,000) is a widely watched long-term trend indicator. CryptoQuant and many institutional analysts treat a sustained break above this level as a primary signal that the bear market has ended and a new bull market may be underway.

    What needs to happen for the bullish case to strengthen?

    Analysts will look for Bitcoin to hold above the 365-day MA and the $84,000–$85,000 range on daily closes. Sustained support could trigger additional buying from trend-following algorithms and institutional investors, amplifying momentum.

  • Analysts Say Binance ETH Withdrawals Hit Highest Level Since 2023, Flag Bullish Signal

    Analysts Say Binance ETH Withdrawals Hit Highest Level Since 2023, Flag Bullish Signal

    Key Highlights

    • Binance Ethereum withdrawals hit a three-year high, with monthly averages exceeding 90,000 transactions—roughly double the rate seen at the start of 2024.
    • CryptoQuant analyst Darkfost links the surge to investors moving ETH into self-custody wallets, signaling a shift toward longer-term holding strategies rather than active exchange trading.
    • While exchange outflows suggest growing preference for personal custody, Darkfost cautions that withdrawal data alone does not conclusively prove long-term investment intent.

    Binance Ethereum Withdrawals Surge to Highest Level Since 2021

    On-chain analytics firm CryptoQuant has flagged a notable acceleration in Ethereum withdrawals from Binance, the world’s largest cryptocurrency exchange by volume. According to analyst Darkfost, the platform’s average monthly ETH withdrawal count has climbed above 90,000, marking the most elevated sustained level since 2021. The current pace is approximately twice the monthly average recorded in the opening months of 2024, underscoring a pronounced shift in how market participants are managing their Ethereum holdings.

    Analyst Interprets Outflows as Signal of Accumulation Behavior

    Darkfost’s analysis of on-chain data frames the withdrawal spike as a noteworthy behavioral indicator. The analyst stated that the large volume of ETH leaving exchange wallets could be linked to the transfer of purchased assets to personal wallets or other external addresses, suggesting a tendency towards longer-term holdings. This pattern aligns with a broader market narrative in which investors increasingly favor self-custody solutions—such as hardware wallets or non-custodial software wallets—over leaving assets on centralized platforms for short-term speculative trading.

    Self-Custody Preference Grows Amid Custody Landscape Evolution

    The movement of assets from exchange-controlled addresses to user-controlled addresses may indicate that investors prefer to store those assets in addresses under their own control rather than holding them on exchanges for short-term trading. This trend coincides with heightened regulatory scrutiny of centralized custodians, high-profile exchange failures in recent years, and the maturation of user-friendly self-custody tooling. However, Darkfost emphasized that exchange exits alone do not definitively prove that investors intend to hold assets long-term; funds could be rotated to other venues, deployed in decentralized finance protocols, or staged for over-the-counter transactions.

    Why This Matters

    Sustained high withdrawal volumes from a dominant venue like Binance serve as a real-time barometer of investor sentiment and custody preferences. If the elevated outflow rate persists, it would suggest a structural reduction in the exchange-resident ETH supply, potentially tightening available liquidity for short-term traders and altering market dynamics during periods of volatility. Conversely, a reversion to lower withdrawal levels could signal renewed comfort with exchange-based custody or a shift back toward active trading strategies. Market observers will likely monitor the weekly and monthly withdrawal trends closely as a leading indicator for medium- and long-term Ethereum market behavior.

    Frequently Asked Questions

    What is driving the surge in Ethereum withdrawals from Binance?

    CryptoQuant analyst Darkfost attributes the increase to investors transferring ETH to personal or external wallets, indicating a preference for self-custody and longer-term holding over keeping assets on the exchange for active trading.

    Does a high withdrawal count guarantee bullish long-term price action for ETH?

    Not necessarily. While outflows suggest reduced exchange supply, Darkfost cautions that withdrawals alone do not definitively prove long-term holding intent; funds may move to other exchanges, DeFi protocols, or OTC desks.

    How does the current withdrawal rate compare to historical levels?

    The monthly average of ETH withdrawals on Binance has reached its highest point since 2021 and is roughly double the rate observed at the beginning of 2024.

  • Binance ETH Withdrawals Hit Highest Level Since 2023, Analysts Report

    Binance ETH Withdrawals Hit Highest Level Since 2023, Analysts Report

    Key Highlights

    • Binance’s average monthly Ethereum withdrawal count has exceeded 90,000, reaching a three-year high and roughly doubling the pace seen at the start of the year.
    • CryptoQuant analyst Darkfost links the surge to investors moving $ETH to personal wallets, signaling a shift toward self-custody and potential long-term holding.
    • While exchange outflows suggest accumulation, Darkfost cautions that withdrawals alone do not definitively prove long-term holding intent.

    Binance Ethereum Withdrawals Hit Three-Year Peak Amid Accumulation Signals

    On-chain data from CryptoQuant reveals that Ethereum withdrawals from Binance have surged to their highest monthly average since 2023, with the exchange now processing more than 90,000 $ETH withdrawals per month on average. According to analyst Darkfost, this metric has approximately doubled compared to levels recorded at the beginning of the year, marking the most elevated accumulation activity in the last three years. The spike coincides with a broader trend of assets leaving centralized exchanges, a pattern often interpreted by market observers as a precursor to reduced sell-side pressure.

    Analyst Darkfost Highlights Shift Toward Self-Custody

    Darkfost stated that the large amount of $ETH being moved out of cryptocurrency exchanges is noteworthy in terms of investor behavior. The analyst noted that withdrawals from exchanges could be linked to the transfer of purchased Ethereum assets to personal wallets or other external addresses, suggesting a tendency towards longer-term holdings. The transfer of assets from exchanges to personal or external wallets may indicate that investors prefer to store those assets in addresses under their own control rather than holding them on exchanges for short-term trading.

    Custody Preferences Evolving But Intent Remains Nuanced

    Despite the compelling correlation between exchange outflows and accumulation narratives, Darkfost emphasizes a critical caveat: exchange exits alone do not definitively prove that investors intend to hold assets long-term. Funds withdrawn from Binance could be redirected to decentralized finance protocols, staking services, or over-the-counter desks rather than cold storage. This distinction matters for market structure analysis because the ultimate destination of the withdrawn $ETH determines whether selling pressure is genuinely removed or merely relocated.

    Why This Matters

    The sustained elevation of Ethereum withdrawals from Binance—the world’s largest cryptocurrency exchange by volume—serves as a real-time barometer of investor sentiment and custody preferences. Historically, prolonged periods of net exchange outflows have coincided with bullish market phases, as they reduce the immediately available supply for trading. However, the current macroeconomic backdrop, including evolving regulatory scrutiny of centralized platforms and the upcoming Ethereum network upgrades, adds layers of complexity. Market participants should monitor whether the 90,000-withdrawal monthly threshold holds in subsequent months, as a reversal could signal renewed trading appetite or profit-taking, while persistence would reinforce the accumulation thesis.

    Frequently Asked Questions

    Who is Darkfost and what is CryptoQuant?

    Darkfost is an analyst at CryptoQuant, a blockchain analytics firm that provides on-chain data and market insights for cryptocurrencies including Bitcoin and Ethereum.

    Does a high withdrawal count guarantee Ethereum’s price will rise?

    No. While large exchange outflows often correlate with accumulation and reduced sell-side supply, Darkfost explicitly notes that withdrawals alone do not definitively prove long-term holding intent. Price action depends on multiple factors including demand, macro conditions, and overall market sentiment.

    What does “self-custody” mean in this context?

    Self-custody refers to investors holding their Ethereum in personal wallets where they control the private keys, rather than leaving assets on a centralized exchange like Binance. This gives the holder full control but also full responsibility for security.

  • 144 Billion SHIB Netflow Signals Warning Amid 5% Price Rally

    144 Billion SHIB Netflow Signals Warning Amid 5% Price Rally

    Key Highlights

    • Shiba Inu (SHIB) surged over 5% in 24 hours, reclaiming the $0.0000055 level amid a broader crypto market recovery.
    • Onchain data from CryptoQuant shows a net inflow of approximately 144.87 billion SHIB to exchanges as of September 19, signaling seller dominance rather than buying pressure.
    • Analysts warn the rally may be short-lived due to a divergence between price action and exchange netflow, suggesting insufficient demand to sustain a breakout above $0.000006.

    SHIB Price Rally Masks Rising Exchange Inflows

    Shiba Inu has posted a notable gain of more than 5% over the last 24 hours, riding a wave of renewed optimism across the digital asset market. The meme coin has successfully reclaimed its previous local high, pushing back above the psychological $0.0000055 threshold. While the price action suggests bullish momentum, underlying onchain metrics tell a more cautious story that contradicts the surface-level strength.

    CryptoQuant Data Reveals 144.87 Billion SHIB Net Inflow

    According to the latest figures published by crypto analytics platform CryptoQuant, Shiba Inu’s exchange netflow registered a modest but significant increase over the same 24-hour period. As of September 19, the netflow balance stood at roughly 144,869,700,000 SHIB. Typically, a price rally coincides with negative netflow—indicating tokens are leaving exchanges for cold storage or long-term holding. This time, however, the positive balance means more tokens are moving onto trading platforms than off them.

    Seller Dominance Undermines Breakout Hopes

    The positive netflow reading is a bearish divergence: it implies that the number of SHIB tokens deposited to exchanges for potential liquidation exceeds the volume withdrawn for accumulation by over 144 billion tokens. In practical terms, sellers are currently dictating market flow. Despite the price surge, the data suggests the rally lacks the sustained demand necessary to fuel a durable breakout toward the next major resistance level near $0.000006.

    Why This Matters

    Exchange netflow is a widely watched leading indicator for short-term price direction. A rising netflow during a price increase often precedes a correction, as it reflects profit-taking or pre-positioning for a sell-off by holders who anticipate a pullback. For Shiba Inu, which has traded sideways around the $0.000005 mark for months amid persistent volatility, the current divergence raises the probability that the recent upside will be capped. Traders and investors should monitor whether netflow reverses to negative territory—a signal that conviction buying is returning—before committing to long positions targeting higher resistance zones.

    Frequently Asked Questions

    What does a positive exchange netflow mean for SHIB?
    A positive netflow indicates more SHIB tokens are being deposited to exchanges than withdrawn. This typically signals selling pressure or profit-taking, suggesting the current price rally may not be supported by strong buying demand.
    How much SHIB flowed into exchanges in the last 24 hours?
    According to CryptoQuant data as of September 19, the net inflow was approximately 144,869,700,000 SHIB (roughly 144.87 billion tokens).
    Can SHIB still reach $0.000006 despite the netflow data?
    While technically possible if broader market momentum accelerates, analysts consider a sustained breakout above $0.000006 unlikely without a shift to negative netflow, which would confirm genuine accumulation rather than distribution.
  • Binance Altcoin Reserves Hit 6-Month Low

    Binance Altcoin Reserves Hit 6-Month Low

    Key Highlights

    • Binance STORJ reserves dropped to 12.08 million tokens, the lowest level in six months, representing a 71.8% decline versus the three-month average.
    • On-chain STORJ transfer volume surged 705% above the three-month average to 296.2 million tokens daily, while total outflow volume contracted 96.2% month-over-month.
    • Network activity spiked significantly with active addresses reaching 2,574 and daily transactions rising 518% to 4,179, indicating heightened on-chain utilization despite exchange reserve depletion.

    Binance STORJ Reserves Hit Six-Month Low Amid Shifting Exchange Dynamics

    According to on-chain analytics provider CryptoQuant, Binance’s Storj (STORJ) reserves have fallen to 12.08 million tokens, marking the lowest level recorded in the past six months. The data reveals a pronounced contraction in the exchange’s holdings of the decentralized cloud storage token, with reserves decreasing by 63.9% compared to the previous month and by 71.8% relative to the three-month average. This decline has occurred steadily across every trading day since September 15th, when the strongest negative net flow of the period was observed.

    Outflow Composition Suggests Structural Shift Rather Than Panic Selling

    Despite the sharp drop in reserves, CryptoQuant highlighted a critical nuance: the total outflow amount contracted by 96.2% on a monthly basis during the same period. The analytics firm stated that the decline in reserves was due to a shrinking reserve base rather than increasingly large withdrawal volumes. On September 15th, approximately 1.11 million STORJ tokens exited the exchange, resulting in a net flow of minus 1.09 million tokens, which represented the peak single-day outflow. Since that date, Binance’s STORJ reserve has continued to decline each trading day, but the diminishing absolute outflow volume suggests the exchange is not experiencing a high-velocity capital flight event.

    On-Chain Activity Surges as Network Utilization Intensifies

    In stark contrast to the exchange reserve drawdown, on-chain metrics indicate a significant uptick in network participation. The average daily volume of STORJ tokens transferred on-chain reached 296.2 million, a figure 705% higher than the three-month average. On September 16th, the number of active addresses climbed to 2,574 while recipient addresses reached 2,409. The average daily transaction count rose 518% above the three-month baseline to 4,179, and the median transaction size increased by 72.8% to 6,643 tokens. These figures point to substantially elevated economic activity on the Storj network, potentially reflecting increased storage demand, node operator settlements, or token redistribution among holders.

    Why This Matters

    The divergence between declining exchange reserves and surging on-chain activity presents a complex signal for market observers. Typically, falling exchange balances are interpreted as bullish, suggesting holders are moving assets to self-custody or staking, reducing immediate sell-side pressure. However, the simultaneous 705% spike in transfer volume and 518% rise in transaction counts indicates the tokens are not merely sitting idle in cold storage—they are actively circulating. For Storj, a utility token powering decentralized cloud storage, heightened transaction velocity and larger median transaction sizes may signal growing network utilization by storage node operators and clients. The 96.2% contraction in total outflow volume further complicates the narrative, implying that the reserve decline is increasingly a function of a diminishing base rather than accelerating withdrawals. Market participants should monitor whether Binance replenishes reserves from other wallets or if the trend reflects a structural migration of STORJ liquidity toward on-chain protocols and decentralized exchanges.

    Frequently Asked Questions

    What caused Binance’s STORJ reserves to drop to a six-month low?
    CryptoQuant attributes the reserve decline to a shrinking reserve base rather than large withdrawal volumes, noting that total outflow amounts actually contracted 96.2% month-over-month while reserves fell 71.8% versus the three-month average.
    How has on-chain STORJ activity changed during this period?
    On-chain metrics show a dramatic increase: daily transfer volume surged 705% to 296.2 million tokens, active addresses reached 2,574, daily transactions rose 518% to 4,179, and median transaction size grew 72.8% to 6,643 tokens.
    When did the most significant single-day outflow occur?
    The strongest negative net flow was recorded on September 15th, when approximately 1.11 million STORJ tokens left Binance, resulting in a net outflow of 1.09 million tokens. Reserves have declined every trading day since.
  • XRP $2 Roadmap: Weekly Close Could Trigger 35% Rally

    XRP $2 Roadmap: Weekly Close Could Trigger 35% Rally

    Key Highlights

    • XRP is forming a technically precise inverse head-and-shoulders pattern on the daily chart with a neckline at $1.55, projecting a 35% upside target near $2.00 upon confirmed breakout.
    • On-chain data shows 1.5–1.6 billion XRP moved to Binance over 30 days—a six-month high—yet price remains stable in the right shoulder range, signaling strong absorption by buyers.
    • A potential golden cross is developing as the 50-day EMA approaches the 200-day EMA, while Ripple advances XRP Ledger integration with Stripe and Tempo for AI-driven micropayments.

    Inverse Head-and-Shoulders Pattern Nears Completion on Daily Chart

    XRP is on the verge of confirming a major bullish reversal structure that has been developing throughout the summer. According to analysts, including well-known chart tracker Ali Martinez, the token has carved out a mathematically precise inverse head-and-shoulders formation on the daily timeframe. The pattern’s anatomy is clearly defined: the left shoulder formed during June’s consolidation phase, the head marked the absolute bottom at the August lows around $1.00, and the right shoulder is currently taking shape in a tight plateau between $1.32 and $1.36.

    The $1.55 Neckline Is the Critical Trigger

    The decisive level is the pattern’s neckline at $1.55. A daily candle close above this resistance would technically complete the formation and activate a measured move projection of approximately 35%, targeting the psychological $2.00 threshold. Martinez’s chart annotation, shared via X.com, displays the emerging structure with a price objective of $2.10. Adding confluence to the setup, the 50-day exponential moving average (EMA) has moved within 2% of the 200-day EMA, teasing a medium-term golden cross that would further validate the bullish bias.

    On-Chain Data Reveals Massive Whale Deposits Absorbed Without Panic

    While technical geometry paints an optimistic picture, on-chain metrics from CryptoQuant provide the fundamental underpinning. Over the past 30 days, large investors have transferred a six-month record of 1.5–1.6 billion XRP to Binance. In exchange operations, deposits of this magnitude typically serve as margin collateral, derivatives backing, or fuel for over-the-counter transactions rather than immediate spot selling. The critical observation is that this enormous liquidity influx has failed to trigger price collapse or panic; instead, XRP has held firmly within the right-shoulder boundaries. This resilience suggests buyers are aggressively absorbing supply, potentially creating a structural shortage once whale inflows subside.

    Regulatory Clarity and Utility Expansion Bolster Confidence

    Buyer conviction is further reinforced by a stabilizing regulatory and developmental backdrop. The U.S. Senate’s rejection of the CLARITY Act on September 15 delivered a short-term negative headline, yet the Commodity Futures Trading Commission (CFTC) continues to classify XRP as a digital commodity, largely insulating it from Securities and Exchange Commission (SEC) enforcement ambiguity. Simultaneously, Ripple is advancing the token’s core utility: beta testing of XRP Ledger integration into Stripe and Tempo infrastructure commenced on September 17, carving a dedicated niche for XRP in instant micropayments between autonomous AI agents—a rapidly emerging use case.

    Why This Matters

    The convergence of a textbook technical breakout, unprecedented on-chain absorption capacity, and expanding real-world utility positions XRP at a pivotal inflection point. For market participants, the $1.32–$1.33 right-shoulder support represents the line in the sand; a defense here keeps the $2.00 roadmap intact. A confirmed daily close above the $1.55 neckline would shift the burden of proof to bears and likely accelerate momentum as algorithmic and trend-following strategies engage. Beyond the immediate trade, the Stripe and Tempo integration signals a strategic pivot toward machine-to-machine economies, potentially unlocking a structural demand vector independent of speculative cycles. Traders and investors should monitor the neckline breakout, golden cross confirmation, and whale deposit trends as the primary validation signals for the next leg higher.

    Frequently Asked Questions

    What price level confirms the inverse head-and-shoulders breakout for XRP?

    A daily candle close above the $1.55 neckline resistance confirms the pattern completion and activates the measured move target toward $2.00.

    Why did 1.5–1.6 billion XRP move to Binance recently, and is it bearish?

    Large transfers to exchanges often serve as collateral for derivatives or OTC deals rather than spot selling. The fact that price held firm during this record inflow suggests strong buyer absorption, which is generally interpreted as bullish.

    How does the Stripe and Tempo integration affect XRP’s long-term outlook?

    The beta integration enables XRP Ledger to facilitate instant micropayments between autonomous AI programs, creating a fundamental utility driver in the emerging agent-to-agent economy that could sustain demand beyond speculative trading.