Tag: Bitcoin price

  • Polkadot Leads Rotation Into Older Layer-1s as Rate-Hike Odds Widen

    Polkadot Leads Rotation Into Older Layer-1s as Rate-Hike Odds Widen

    Pre-2018 Layer-1 Tokens Lead Tuesday Crypto Rally as Bitcoin, Ether Decline

    A cohort of layer-1 tokens launched before 2018 outperformed Tuesday while bitcoin and ether finished lower, and traders increased bets on a Federal Reserve rate hike next week. Only Polkadot among the group had a specific catalyst: holders are voting on a proposal to launch a native stablecoin, submitted to OpenGov on Monday and currently passing with 97.5% support. Cosmos Hub, Decred, and Ethereum Classic moved higher without any filings, releases, or governance actions during the window. The four tokens rallied together on a week when bitcoin gained 1.6%.

    Bitcoin and Ether Price Action

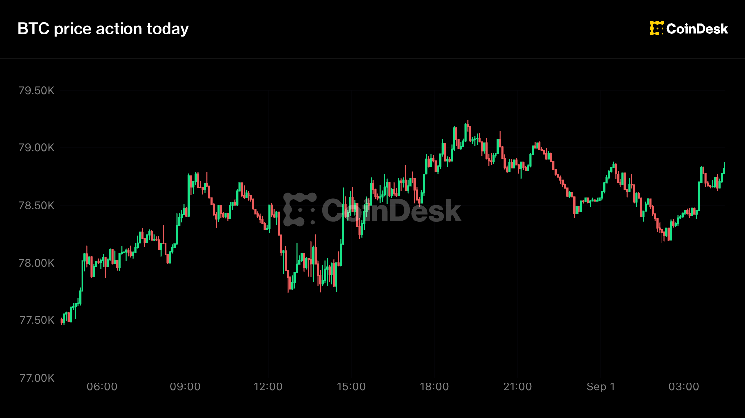
    Bitcoin last changed hands at $78,539, down 0.83% over 24 hours but up 1.6% over seven days, after trading between $77,666 and $79,432, according to CoinGecko data. Ether traded at $2,484.83, down 0.29% on the day and up 2.8% on the week. XRP rose 1.53% to $1.42; Solana fell 0.59% to $103.24; BNB gained 1.66% to $751.92, holding a 10.5% weekly advance. Total crypto market capitalization stood at $2.70 trillion on $91.54 billion of volume, with bitcoin dominance at 58.36%. Fifty-seven of the 125 largest non-stablecoin tokens rose and 66 fell.

    Bitcoin’s Round Trip

    Bitcoin peaked at $79,432 shortly after 10 p.m. ET Monday, during Tokyo’s morning, and sold off through the European session. The 24-hour low of $77,666 came in the 10 a.m. ET hour. It recovered to $78,833 by midday and gave that back through the afternoon, ending the U.S. session near where it opened. The token remains 37.7% below the $126,080 record set in October 2025.

    The Crypto Fear & Greed Index read 69 on Tuesday, down from 71 on Monday and 74 on Sept. 4, according to Alternative.me. It has remained above 60 every day since Aug. 29.

    Polkadot’s Stablecoin Proposal Drives 42.5% Weekly Gain

    Polkadot surged 16.7% to $1.25 and 42.5% over seven days, marking a second consecutive double-digit day after Monday’s 13.85% gain, on $420 million of volume against a $2.13 billion market value. It recorded the largest weekly gain among the 50 biggest tokens.

    The proposal went on-chain at 11:49 a.m. ET Monday. OpenGov Referendum 1944, “dotUSD: A Native Stablecoin for Polkadot,” sits on the Root track and is in its deciding period. “This proposal signals the intent of the DAO to introduce dotUSD, Polkadot’s native stablecoin, as the protocol’s primary stable-value instrument,” the text reads.

    The referendum lists seven actions, including creating the dotUSD asset “owned by the protocol,” opening a $DOT-dotUSD liquidity pool on Asset Hub, designating dotUSD a sufficient asset, and setting peg stability module parameters. It commits treasury funds: “$2.5M in $USDT will be used to mint dotUSD and $2.5M in $DOT will be allocated initially to the pool.”

    The Polkadot Community Foundation submitted the proposal and disclaims operational control. “dotUSD is a decentralized, protocol-native stablecoin project,” the text reads. “It would have no issuer and would instead operate autonomously via on-chain logic.”

    Voting stands at 2,343,074 $DOT in favor against 59,896 opposed, with 558,519 $DOT of support against an electorate of 1.67 billion $DOT. A second referendum, 1942, upgrading system chains to runtime 2.5, went on-chain Sept. 5 and is also deciding. No U.S. product filing accompanies the move. EDGAR full-text search returns one document mentioning Polkadot between Sept. 1 and Sept. 8, a Canary Staked TRX ETF prospectus that uses the word in passing. Polkadot’s own account has posted nothing about dotUSD.

    Cosmos Hub, Decred, and Ethereum Classic Rise Without Dated Catalysts

    Cosmos Hub, Decred, and Ethereum Classic rose alongside Polkadot without a specific catalyst. The Cosmos Hub’s most recent governance proposals, 1052 and 1053, were submitted Aug. 25 and finished voting Sept. 1. Decred’s last substantive release is the v2.1.6 consensus security patch from late August; its account’s most recent post, dated Sept. 7, is a marketing message. Ethereum Classic’s core-geth has not shipped a release since Hermes v1.12.22 on March 28, and the project’s repositories show no September activity. None of the three appears in Binance’s listing announcements for Sept. 4 through Sept. 8.

    VeChain added 10.6% to $0.008006 and 19.5% over seven days. Its Aug. 6 post on the Interstellar upgrade and its Aug. 24 statement that the VIP-255 vote passed give no mainnet activation date.

    Fed Rate-Hike Odds Climb to 54.5% on Polymarket

    Traders widened their bet on tightening for a third session. Polymarket put a quarter-point increase at 54.5% and no change at 45.5% on $104.6 million of volume. The same contracts read 52.5% and 45.5% at midday Tuesday, 50.5% and 49.5% on Monday, and 30.5% and 67.5% on Aug. 24. A quarter-point cut trades at 0.45%. The Federal Open Market Committee meets Sept. 15-16, one of the four meetings a year that carries a Summary of Economic Projections.

    Friday’s labor data set the direction. The Bureau of Labor Statistics reported that “total nonfarm payroll employment increased by 162,000 in August, and the unemployment rate was unchanged at 4.1 percent”, with June and July revised up by a combined 55,000. August producer prices publish Sept. 10 and consumer prices Sept. 11, both at 8:30 a.m. ET, the last two federal releases before the committee meets.

    Oil and Macro Markets

    Brent crude settled at $99.31 a barrel, up 3.15% from Friday and its highest close since July 23, when it ended at $100.69. West Texas Intermediate rose 3.03% to $94.25. The yen traded at 153.97 per dollar, its firmest since Feb. 18, and the dollar index fell 0.31% to 98.85.

    “Higher oil prices on the back of continued geopolitical escalations between the US and Iran and a rally in the Japanese yen to a 7-month high have taken the spotlight in the past 24 hours,” Thahbib Rahman, research analyst at Block Scholes, wrote in a note emailed to reporters on Tuesday. “Both events weighed on risk assets across US equity markets and crypto markets alike.”

    Rahman said options positioning has not followed spot lower. “While not near the highs of mid-August and early September, after the US Treasury’s bond interventions and Fed Governor Waller’s dovish speech, short-dated $BTC put-call skew remains tilted towards call options,” he wrote. “This means investors are leaning more bullish than bearish and is an indication that traders are willing to pay more for upside exposure to spot price than downside protection.”

    U.S. equities closed lower. The S&P 500 fell 0.58% to 7,673.52 and the Nasdaq Composite 0.32% to 26,421.41. The 10-year Treasury yield rose to 4.81% and the 30-year to 5.26%. Gold futures fell 0.67% to $4,400 an ounce.

    Zcash Gains After Options Listing Announcement

    Zcash rose 0.82% to $1,166.37 and 39.2% over seven days after touching $1,210.35, holding tenth place at a $19.73 billion market value, above Hyperliquid at $18.79 billion and Dogecoin at $14.01 billion. It remains 63.4% below the $3,191.93 record set on Oct. 28, 2016.

    Grayscale said on Tuesday that “$ZCSH, the world’s first Zcash fund, is now available for options trading on @NYSE.” The post links to the fund’s prospectus and does not name the options venue; the shares list on NYSE Arca, and NYSE American Options and NYSE Arca Options are separate venues. No exchange listing notice or SEC rule filing corroborating the options listing was retrievable, and the most recent document under the trust’s EDGAR record is the Aug. 25 prospectus.

    The fund completed its uplisting from OTCQX to NYSE Arca on Aug. 25 under the ticker ZCSH, registering the shares through a Form 8-A12B filed Aug. 24 and changing its name to The Zcash ETF the same day. Grayscale’s fund account said on Sept. 4 that ZCSH “just crossed $400,000,000 in AUM.” The Defiant covered the original conversion filing in November 2025.

    Monero fell 4.3% to $497.42 after trading as high as $525.33, and is down 0.7% over seven days against Zcash’s 39.2%. Monero’s official blog has published nothing since the July 21 GUI release, and no Monero item appeared on the announcement pages of Binance, Kraken, OKX or Bithumb on Monday or Tuesday. The token has no U.S. listed vehicle.

    Injective Rallies on Triple Catalyst

    Injective rose 5.25% to $6.45 and 33.8% over seven days after trading 12.7% higher at midday, on $190 million of volume against a $650 million market value. Three dated announcements sit behind it. Injective said on Tuesday that “native USDC on Injective is now live on @krakenfx,” allowing deposits and withdrawals of the stablecoin directly between the exchange and the chain. On Monday it said that “$INJ is now live on @RobinhoodCrypto”; Robinhood’s own asset page lists the token as tradable without stating a date. Also on Monday, the project said that “over 58.8 Million $INJ tokens are now staked onchain,” which it called a record. Injective’s public node reported 58,461,008 $INJ bonded against a total supply of 122,781,894, or 47.6%, slightly below the figure the project gave. $INJ trades 87.7% below the $52.62 record it set in March 2024. The chain’s most recent blog post, dated Sept. 4, says Pineapple Financial has moved more than $1 billion in residential mortgage records onto Injective.

    Useless Coin Surges on Korean Exchange Listings

    Useless Coin gained 24% to $0.2791 on $174 million of volume, against a $279 million market value, after two Korean exchanges opened trading in it on Tuesday. Bithumb’s market list carries a KRW-$USELESS pair whose hourly candles begin at 1 a.m. ET. Upbit’s market list carries $BTC and $USDT pairs whose candles begin at 8 a.m. ET, with the $USDT pair flagged for price volatility and cross-venue price gaps; Upbit did not open a won pair. The listings account for Tuesday’s move. The 138.5% seven-day gain predates both, and no project statement covering that period is available.

    Venice Token Leads Daily Gainers

    Venice Token led the day at 30.2%, reaching a record $25.49 before easing to $24.18 and a $1.15 billion market value on $177 million of volume. The most recent post on the Venice blog is dated July 17, carrying an Aug. 5 update that cuts $VVV emissions to 2.5 million a year on Sept. 1 and to 2 million on Oct. 1, and raises the DIEM supply target to 40,000 on Sept. 14. Those dates were set five weeks ago. The project’s changelog has not been updated since July 30.

    Other Notable Movers

    Falcon Finance rose 25.6% to $0.1495 and 51.9% over seven days. Its most recent blog post is dated Aug. 31 and its account’s Sept. 8 posts respond to the price rather than explain it. Pons added 17.7% to $0.8265 and 93.8% over seven days; Uniswap Labs bought $PONS tokens on Sept. 3.

    ETF Flows Pause for Holiday

    U.S. spot bitcoin and ether ETF flows for Tuesday had not published as of 5 p.m. ET. The last completed session is Friday, when bitcoin funds took in $174.6 million and ether funds $25.9 million, according to Farside Investors. BlackRock’s IBIT accounted for $117.4 million of the bitcoin total and Fidelity’s FBTC $57.2 million; among ether funds, BlackRock’s two products drew $74.2 million while Fidelity’s FETH lost $48.3 million. No row exists for Monday, when U.S. markets were closed for Labor Day, which means Monday’s altcoin advance ran with the ETF and equity markets shut.

    DeFi and Stablecoin Metrics

    DeFi total value locked stood at $87.94 billion, down 0.7% over 24 hours and up 1.57% over seven days, DefiLlama data shows. Stablecoin supply was $311.71 billion, down 0.1% on the day, up 0.49% over seven days and 1.35% over 30 days.

    Additional Market Moves

    Hyperliquid fell 0.79% to $84.50 and trades 5.7% below the $89.60 record it set on Sept. 6. Its account has posted nothing since Aug. 31. WhiteBIT Coin rose 6.16% to $81.35 and 14.3% over seven days after touching a record $81.98 at 12:40 p.m. ET; its blog has published nothing since July 28.

    Akedo traded 21% higher at midday before ending 8.6% lower. It holds a 76.7% weekly gain. Hedera was the largest token among the decliners at a $3.46 billion market value, and is still up 6.8% over seven days. Its most recent blog post, dated Sept. 4, covers new council partners, and its Tuesday statements concern an insurance consortium building on the network. Monero’s 4.3% decline falls just outside the table.

    Prices and market data as of 5:11 p.m. ET on Sept. 8, 2026.

  • Bitcoin Price Stalls Below $78K as ADX Falls to 12

    Bitcoin Price Stalls Below $78K as ADX Falls to 12

    Bitcoin price traded just below $78,000 on Sept. 1 after retreating from the $81,000 area. Fading trend strength, Federal Reserve rate concerns and nearby liquidation clusters kept BTC locked in a narrow range.

    Bitcoin price consolidates after a 25% August rally

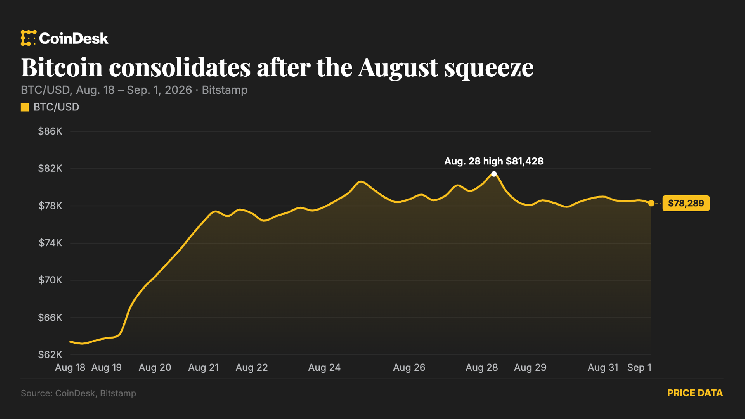
    According to data from crypto.news, Bitcoin ($BTC) was trading near $77,978 at press time, down about 0.8% on the day and roughly 1.9% over the past week. The cryptocurrency had pulled back from a local high near $81,300 while holding above the $77,700–$77,800 area.

    The decline followed an almost 25% advance in August, Bitcoin’s strongest monthly performance since November 2024. Profit-taking increased as buyers struggled to move the price through the $81,000–$82,000 resistance zone.

    Bitcoin’s daily chart shows the cryptocurrency holding most of its August breakout despite the recent pullback. The price remains well above Supertrend support at $72,310, while the indicator continues to show a bullish trend on the daily timeframe.

    Bitcoin price daily chart — Sep. 1 | Source: crypto.news

    However, Bitcoin has repeatedly failed to sustain moves above $80,000. These rejections have kept the price inside a short-term range, with neither buyers nor sellers showing enough strength to take control.

    The daily relative strength index stands at 68.02. Although the reading remains above the neutral 50 level, it has fallen below its moving average at 76.83, indicating that bullish momentum has cooled since the August surge.

    Fed concerns and ETF outflows limit Bitcoin demand

    The pullback coincided with a more cautious US macroeconomic backdrop. Federal Reserve Chair Kevin Warsh said at Jackson Hole that policymakers would have “work to do” if inflation failed to move toward the central bank’s 2% target at a sufficient pace.

    Warsh’s comments increased expectations that the Fed could consider another interest-rate increase. Higher rates can pressure Bitcoin by raising the return available on government debt and reducing investors’ willingness to hold risk assets that generate no cash flow.

    US spot Bitcoin exchange-traded funds recorded about $201.8 million in net outflows on Aug. 28, according to SoSoValue data. The withdrawal ended a nine-session inflow streak that had brought more than $3 billion into the funds.

    Institutional demand has not disappeared. Strategy disclosed that it purchased 4,603 $BTC for approximately $370 million between Aug. 24 and Aug. 30 at an average price of about $80,318.

    The US-listed company now holds 845,050 $BTC. However, its latest purchase has not been enough to push the market back above the company’s recent acquisition price.

    Bitcoin liquidity builds on both sides of the range

    CoinGlass’s one-week Bitcoin liquidation heatmap shows substantial leveraged positions building above and below the current price.

    Bitcoin liquidation heatmap | Source: CoinGlass

    The closest large upside clusters sit around $79,500, $80,500 and $81,500–$82,000. A move into those areas could force short sellers to close positions, adding buying pressure and potentially accelerating a breakout.

    The clearest downside liquidity is concentrated between approximately $76,500 and $77,000. Another pool extends toward $75,000, making the broader $75,000–$77,000 zone a possible target if Bitcoin loses its current floor.

    Pseudonymous analyst Eliz also identified $81,000–$82,000 and $75,000–$77,000 as the two main liquidity areas. The analyst said the market had not received a sufficiently strong liquidity influx to produce a reliable directional setup.

    The heatmap does not predict which cluster Bitcoin will reach first. Instead, it identifies areas where forced position closures could increase volatility once the price exits its present range.

    Weak ADX points to continued Bitcoin range trading

    Bitcoin’s 4-hour chart supports the consolidation outlook. The Bollinger Bands place their midpoint at $78,242, slightly above the current price.

    Bitcoin price 4-hour chart — Sep. 1 | Source: crypto.news

    The upper Bollinger Band stands at $79,062, while the lower band is near $77,422. Bitcoin is trading in the lower half of the channel but has not produced a confirmed close below its lower boundary.

    A break above $79,062 would put $80,000 back in focus, followed by the heavier liquidation zone around $81,000–$82,000. The daily chart places the next major resistance level near $82,842.

    A daily close above $82,842 would clear the recent high and could confirm that the August rally has resumed. Until then, repeated rejections below that level leave Bitcoin vulnerable to another range reversal.

    On the downside, a sustained break below $77,422 would expose the liquidity cluster near $76,500–$77,000. Losing the broader $75,000 level could open a deeper pullback toward daily Supertrend support at $72,310.

    The 4-hour average directional index has dropped to 12.26. Readings below 20 generally show that an asset lacks a strong trend, supporting the possibility of further sideways trading until Bitcoin breaks one of the range boundaries.

    For US investors, ETF flows and interest-rate expectations remain the main near-term catalysts. A return to sustained spot ETF inflows could help buyers challenge $82,000, while renewed outflows or stronger rate-hike expectations could increase pressure on the $75,000–$77,000 support area.

  • Bitcoin Holds Near $78,000 as Arbitrum Surges 30% on Robinhood Chain Revenue

    Bitcoin Holds Near $78,000 as Arbitrum Surges 30% on Robinhood Chain Revenue

    Bitcoin is trading near $78,000, down 0.4% since midnight UTC and about 0.7% over the past seven days as the market consolidates after a short squeeze lifted the price from below $63,000 to nearly $81,400 last week.

    Bitcoin’s relative strength has remained intact despite the calmer conditions. Nasdaq 100 futures are down 0.5% since midnight, meaning bitcoin is once again outperforming equities.

    Spot bitcoin exchange-traded funds recorded $3.04 billion in net inflows across nine consecutive sessions, their longest streak since April. The run ended Friday with a $202 million outflow before resuming Monday with $217 million in fresh inflows, according to SoSoValue data.

    Altcoins are mixed in the latest session. The Altcoin Season index has fallen to 26 out of 100 from 34 on Friday, its lowest reading in more than 90 days.

    Crypto derivatives positioning remains balanced

    Balanced positioning: The 24-hour taker buy-sell volume ratio in crypto futures markets has remained balanced for a second consecutive day. Open interest has held near $136 billion, while trading volume has declined 7%. The combination suggests traders are adding neither significant long nor short exposure and are waiting for a clearer market signal.

    Arbitrum leads gainers: Arbitrum’s $ARB is the best-performing token among the top 100 cryptocurrencies over the past 24 hours, gaining nearly 30%. The rally is supported by increased futures participation, with open interest rising more than 10%. The data points to a buildup of long positions as $ARB attempts to establish support above chart resistance at 11 cents. Annualized funding rates near 8% suggest the market is not overheated.

    Monero open interest continues to rise: Open interest in privacy-focused Monero futures has climbed to 640,000 tokens, the highest level since February 2024. The signals are mixed. Funding rates have dropped to 15% from more than 50%, suggesting bullish positions are no longer overcrowded. However, the 24-hour open-interest-adjusted cumulative volume delta is negative, indicating bearish leadership. XMR has already pulled back to around $525 from Monday’s high of $548.

    Demand for $TRX shorts: Tron’s $TRX stands out with funding rates at minus 80%, signaling crowded bearish positioning. Short sellers are accepting a high cost to maintain their positions. $TRX is trading near 33 cents after falling for a third consecutive day.

    Light positioning in bitcoin and ether: Open interest in $BTC and $ETH remains subdued, hovering near multi-week lows.

    Volatility cools: Bitcoin’s and ether’s 30-day implied volatility indexes, BVIV and EVIV, have reversed their mid-August spikes, pointing to calmer market conditions.

    Options flow turns bullish: In options listed on Deribit, the $80,000 bitcoin call expiring Sept. 25 was the most-traded position over the past 20 hours. A call represents a bullish bet on the underlying asset. For ether, the $2,500 call attracted the most activity.

    Arbitrum leads the altcoin market

    Arbitrum’s surge is the clearest standout across the altcoin sector. The rally is linked to Robinhood Chain, which operates as a dedicated Arbitrum chain and sends 10% of net protocol revenue to the Arbitrum ecosystem.

    Offchain Labs co-founder Steven Goldfeder said Monday that Robinhood Chain’s 24-hour transaction revenue had exceeded $2 million, up from approximately $1.22 million the previous day. At that pace, Arbitrum’s share would amount to roughly $73 million annually.

    ARK Invest’s Lorenzo Valente calculated that gross revenue on Robinhood Chain rose from $54,676 on Aug. 22 to $1.088 million on Aug. 30, an increase of nearly 20 times. Arbitrum’s share increased from $5,400 to $108,000 over the same period.

    Curve DAO’s CRV$0.3586 rose 14% over 24 hours to approximately 35.13 cents on $119 million in trading volume. The move forms part of the broader decentralized finance rally that has lifted lending and decentralized exchange tokens through the second half of August.

    Uniswap’s $UNI extended its gains, rising 8% since midnight to around $5.80 after advancing 12% over the previous 24 hours. The token is now up 34% over the past seven days on $519 million in volume.

    Among the day’s smaller movers, Aave’s AAVE$126.93 gained 1.9% to $126.54, while Morpho’s MORPHO$2.5549 rose 2%. The moves suggest decentralized finance assets are holding up better than the broader crypto market during Tuesday’s session.

  • Bitcoin Holds Above $78,000 as HYPE Leads While Major Cryptocurrencies Slip on Hawkish Fed Bets

    Bitcoin Holds Above $78,000 as HYPE Leads While Major Cryptocurrencies Slip on Hawkish Fed Bets

    Oil is increasingly driving the rates market, with the U.S. 10-year Treasury yield rising to 4.78%. Traders now see roughly 64% odds of an interest-rate hike at the Federal Reserve’s September 16 meeting, up from about 36% before Chair Kevin Warsh’s Jackson Hole address. Gold fell to approximately $4,435 an ounce after gaining 10% in August.

    Bitcoin has held near $78,000 following a 23% rally, a sign that may be more significant than the rally itself. “Holding around $78,000 after a 23% surge is more telling than the surge itself,” said Yusuf Fakhro, partner at ARP Digital, in an email. He added that perpetual open interest is at its lowest level since May, while U.S. spot bitcoin ETFs recorded their strongest week of demand since October 2025. Together, those trends suggest the August advance was driven by spot demand rather than crowded leveraged positions that could trigger further selling.

    Bitcoin ETF flows have since weakened. Trading firm Wintermute recorded $924 million in bitcoin ETF inflows during nine consecutive positive sessions before a $202 million outflow ended the run on Friday. Bitcoin has been rejected at the $82,000 level each time since.

    “Market’s on edge but lacks directional conviction in the short term,” said Jasper De Maere, OTC trader at Wintermute, in an email.

    U.S. jobs data could set bitcoin’s next move

    Friday’s August payrolls report will be the final major labor-market indicator released before the September Federal Open Market Committee meeting. With interest-rate hike expectations already close to two-thirds, a stronger-than-expected jobs report could push Treasury yields higher and send bitcoin back toward the overnight low of $77,200.

  • Cantor Fitzgerald Raises Coinbase Price Target to $212 as Crypto Market Recovers

    Cantor Fitzgerald Raises Coinbase Price Target to $212 as Crypto Market Recovers

    Cantor Fitzgerald has raised its price target for Coinbase Global Inc. to $212 from $184 while maintaining an overweight rating on the cryptocurrency exchange. The Wall Street investment bank said the increase reflects a broader recovery in digital assets, with Bitcoin recently reaching $80,000, according to a research note.

    Why Cantor Fitzgerald Raised Coinbase’s Price Target

    The revised Coinbase price target points to stronger institutional confidence in the company as a regulated gateway to the cryptocurrency market. Coinbase operates in compliance with U.S. regulations and has become a key investment vehicle for institutional investors seeking exposure to digital assets.

    Cantor Fitzgerald analysts indicated that continued Bitcoin strength could encourage greater investor risk appetite and provide further support for Coinbase’s valuation.

    Coinbase shares have historically been sensitive to cryptocurrency price movements because the company’s trading volumes and transaction revenue are closely linked to market activity. The exchange has expanded into additional revenue streams, including subscription services and stablecoin partnerships, although trading remains its core business.

    Crypto Market Recovery Supports Coinbase Outlook

    The cryptocurrency market has rebounded in recent weeks, with Bitcoin moving above $80,000 for the first time in months. The rally has been supported by improved regulatory clarity in the United States, increased institutional adoption and a favorable macroeconomic environment.

    Cantor Fitzgerald’s overweight rating reflects a broader trend among analysts who view Coinbase as a bellwether for the cryptocurrency industry. Some analysts remain cautious, however, citing possible regulatory headwinds and continued market volatility.

    The $212 price target represents modest upside from current levels and reflects a balanced assessment of Coinbase’s growth prospects and risks.

    What the Coinbase Price Target Means for Investors

    The updated price target gives investors another reference point when evaluating Coinbase stock. It also highlights the importance of monitoring Bitcoin’s performance, as the exchange’s trading activity and valuation are closely correlated with cryptocurrency market sentiment.

    Coinbase’s regulatory compliance may strengthen its position among institutional investors, but it also leaves the company exposed to regulatory changes that could affect its operations.

    Cantor Fitzgerald’s commentary suggests that Coinbase is positioned to benefit from a sustained cryptocurrency recovery. Investors should nevertheless remain aware of the significant volatility associated with digital assets. Diversification and risk management remain important for anyone considering exposure to the crypto sector.

    Bottom Line

    Cantor Fitzgerald’s decision to raise its Coinbase price target to $212 from $184 reflects increased optimism about the cryptocurrency market’s recovery and Bitcoin’s rally to $80,000. The continued overweight rating signals confidence in Coinbase’s role as a regulated crypto exchange, while also leaving investors to weigh potential gains against market volatility and regulatory uncertainty.

    The coming months will help determine whether the current cryptocurrency market momentum can continue.

    Frequently Asked Questions

    What is Cantor Fitzgerald’s new price target for Coinbase?

    Cantor Fitzgerald raised its price target for Coinbase to $212 from $184 while maintaining an overweight rating.

    Why did Cantor Fitzgerald raise the Coinbase price target?

    The bank cited a broader recovery in the cryptocurrency ecosystem, including Bitcoin’s rise to $80,000, and identified Coinbase as a key regulated exchange for institutional investors.

    How does Bitcoin’s price affect Coinbase stock?

    Coinbase’s trading volumes and revenue are closely tied to cryptocurrency market activity. A stronger Bitcoin price typically improves investor sentiment and can support the company’s valuation.

    Related Reading

    • Bitcoin Holds $78K as Arbitrum and Curve DAO Lead Altcoin Gains
    • Crypto Futures See $82M in Liquidations as Bitcoin and Ethereum Shorts Get Squeezed
    • CZ: Crypto Has Survived Its Harshest Winter, Fundamentals Remain Solid
    • Bitcoin Core v32 to Enhance Block Processing Speed and Fee Estimation
    • Bitfinex: Spot Bitcoin Demand Holds Firm Despite Fed’s Hawkish Stance
  • Bitcoin Holds Above $79K Despite Pressure After Nearly 25% August Rally

    Bitcoin Holds Above $79K Despite Pressure After Nearly 25% August Rally

    Bitcoin posted a cumulative gain of nearly 25% in August as the cryptocurrency began its monthly close above $79,020, despite continued pressure and several sessions of high volatility across major trading venues.

    The largest cryptocurrency by market capitalization held the $78,200-$78,700 range during the past 48 hours. The technical support came as liquidity continued to increase across regulated spot trading platforms.

    Data from CoinGlass showed that short-position liquidations on major exchanges exceeded $180 million over the past week. Market analysts said the liquidations triggered automatic buybacks on the open market, adding bullish momentum while programmed institutional selling continued.

    Bitcoin’s daily spot trading volume surpassed $34 billion on the last business day. Data from CoinMarketCap and CoinGecko indicated that the level was 14% above the moving average recorded in the middle of the month.

    Meanwhile, the funding rate for Bitcoin perpetual contracts remained moderate at approximately 0.008% over the past 24 hours. Market analysts said the figures suggest that the latest move is being driven primarily by spot buying rather than excessive speculative leverage in derivatives.

    Bitcoin Derivatives and Institutional Demand

    Spot Bitcoin exchange-traded funds (ETFs) in the United States recorded net inflows of $420 million over the past five trading sessions.

    Official issuer data showed that the cumulative net inflows offset outflows recorded earlier in the third quarter. Analysts at Bloomberg Intelligence said steady demand from institutional asset managers had helped reduce the amount of Bitcoin available on over-the-counter (OTC) desks.

    Bitcoin’s mining difficulty reached a record 102 trillion hashes in the latest biweekly adjustment. Technical documentation from the protocol showed that the network’s average computing power, or hashrate, stood at 730 EH/s at the end of August, reflecting continued expansion of mining infrastructure.

    Long-term Bitcoin holders also showed signs of stability after the latest price increase. Metrics from analytics firm Glassnode indicated that more than 65% of the total circulating supply had remained dormant for over a year. The firm’s technical report said slower distribution by these holders has historically been associated with structural consolidation phases before new volatility cycles.

    The next major economic event for Bitcoin markets is scheduled for the first week of September, when the United States Bureau of Labor Statistics is due to release its official nonfarm payrolls and employment report. The data could directly influence expectations for Federal Reserve monetary policy.

  • Bitcoin Remains Unfazed by Trump’s Iran Threats

    Bitcoin Remains Unfazed by Trump’s Iran Threats

    Bitcoin remained largely unchanged despite escalating tensions in the Middle East and U.S. President Donald Trump’s vow on Monday to hit Iran hard.

    The price of Bitcoin, the world’s largest cryptocurrency, recently stood at $79,076, showing no movement over 24 hours. The asset was also virtually unchanged from its level seven days earlier.

    Bitcoin gains nearly 30% in a month

    Bitcoin began a powerful rally two weeks ago, marking its strongest performance in three years. The cryptocurrency is now up nearly 30% over the past month.

    Bitcoin’s price began rising after the U.S. Treasury announced that it would at least double the size of its liquidity-support buyback operations. The announcement weakened the dollar, while non-yielding assets such as Bitcoin and gold benefited.

    Positive cryptocurrency regulation developments have also supported Bitcoin this month. Last week, President Donald Trump described the long-awaited crypto Clarity Act as a “very, very powerful” piece of legislation and urged lawmakers to pass it.

    The Clarity Act is intended to establish a framework for determining whether digital assets should be classified as securities, commodities or payment stablecoins. The cryptocurrency industry has long called for such legislation.

    Crypto ETF inflows support Bitcoin

    Investors have also returned to exchange-traded funds linked to cryptocurrencies, providing further support for Bitcoin’s price. Between August 17 and August 27, investors put more than $2.8 billion into the funds, the highest total since October.

    JUST IN: Crypto ETFs attracted $3.2 billion in inflows last week, “their largest weekly intake since October 2025”, The Kobeissi Letter reports. BlackRock’s IBIT led with $928 million last week, adding to their $1.3 billion from the prior week, and marking the biggest 2-week…

    — Bitcoin Magazine (@BitcoinMagazine), August 31, 2026

    Bitcoin reached a weekly high of $81,281 before declining again on Friday.

    Geopolitical conflict has weighed on Bitcoin’s price this year. The cryptocurrency has typically come under pressure following news of war and rallied when investors saw prospects for a ceasefire.

    When the United States and Israel first attacked Iran in February, Bitcoin’s price plunged. The cryptocurrency also remained volatile after reports of war in March and April.

    However, analysts say Bitcoin’s volatility has eased in recent months. Monday followed that pattern: Trump threatened to strike Iran again, but the digital asset showed little reaction.

    The United States and Iran resumed strikes on Sunday, marking the first such action in more than one month.

    “We’re going to hit them hard,” President Trump was quoted telling a Fox News reporter on Monday.

    Source: cryptonews.net

  • Bitcoin Price Holds Firm at $78,623 Despite Iran Strikes and Fed’s Hawkish Pivot

    Bitcoin Price Holds Firm at $78,623 Despite Iran Strikes and Fed’s Hawkish Pivot

    Bitcoin remained resilient near $78,623 on Monday despite escalating violence in the Middle East and a sharply hawkish shift in Federal Reserve policy expectations. The cryptocurrency fell just 0.7% over 24 hours as fresh U.S. military strikes on Iran pushed oil prices higher and weighed on U.S. equities.

    Bitcoin’s relatively stable performance is drawing increased attention because risk assets would typically face heavier selling under similar geopolitical and monetary pressure. The cryptocurrency was on track to finish August with a gain of more than 24%, potentially marking its strongest monthly performance since 2017.

    Bitcoin Holds Near $78,623 as August Gain Tops 24%

    According to CoinGecko data cited by Decrypt, Bitcoin fell to an intraday low near $77,162 before recovering to trade around $78,623. The daily decline was modest compared with the scale of the weekend’s geopolitical developments and the market’s reaction to the Federal Reserve’s latest policy signals.

    Holding above $78,000 while geopolitical tensions and rising interest-rate expectations weigh on markets could indicate underlying demand rather than momentum-driven buying alone. However, derivatives activity suggests traders are adjusting existing positions instead of committing significant new capital.

    Ethereum Gains Nearly 30% Despite Fund Outflows

    Ethereum traded near $2,448 on Monday. Although Ether was slightly lower on the day, it was still approaching a monthly gain of 30%.

    Ethereum’s price strength contrasted with continued cash outflows from Ethereum investment funds. The divergence between Ether’s price and fund flows may indicate that investors are taking profits or shifting capital elsewhere even as the cryptocurrency’s market performance remains strong.

    U.S. Strikes on Iran Push Oil Higher and Stocks Lower

    The latest exchange of strikes between the United States and Iran was the first since late July. The developments renewed concerns about potential shipping disruptions in the Strait of Hormuz, a critical energy chokepoint whose closure could affect global oil supplies.

    West Texas Intermediate crude futures rose 2.6% to approximately $85.60 a barrel. Higher oil prices can intensify inflation expectations, adding pressure to central banks that are already considering whether further interest-rate increases may be necessary.

    U.S. stocks also declined. The S&P 500 fell 0.5% to about 7,673, while the Nasdaq Composite dropped 0.4%. Bitcoin’s limited decline stood out because the cryptocurrency has historically followed, and at times amplified, movements in technology-heavy indexes such as the Nasdaq.

    Hawkish Federal Reserve Remarks Lift September Rate-Hike Odds

    Geopolitical tensions were not the only factor affecting markets. Federal Reserve Chair Kevin Warsh delivered hawkish remarks at Jackson Hole, prompting investors to quickly reassess the likelihood of a September rate increase.

    The probability of a September hike rose to roughly 58%, up from about 35% before Warsh’s comments. The change represented a significant shift from the more accommodative policy outlook previously priced into markets.

    The stronger rate outlook also affected gold. The traditional safe-haven asset fell to near $4,440, as the impact of higher interest-rate expectations outweighed demand linked to rising geopolitical risk.

    Bitcoin Rally Slows as Spot ETF Inflows End

    Bitcoin’s August rally began losing momentum late last week after Warsh’s remarks. Spot Bitcoin exchange-traded funds also ended a nine-day streak of net inflows, reversing a period of sustained institutional buying.

    The shift is consistent with a broader reduction in risk exposure as investors prepare for the possibility of another Federal Reserve rate increase. Ethereum ETFs continued to experience cash outflows, extending a trend that began before the Jackson Hole event.

    Derivatives Volume Points to Trader Repositioning

    Iliya Kalchev, an analyst at Nexo Dispatch, viewed Bitcoin’s stability as the week’s more important development, potentially more significant than its monthly gain. He noted that it is unusual for an aggressive Federal Reserve stance and an active geopolitical conflict to pressure risk assets during the same week while Bitcoin continues to hold its ground.

    Derivatives data showed that 24-hour trading volume more than doubled to $183 billion, while open interest remained broadly unchanged. The combination suggests traders were repositioning existing bets rather than bringing substantial new capital into the market.

    That distinction is important when assessing Bitcoin’s market direction. Rising volume alongside flat open interest generally indicates that capital is rotating between positions rather than entering through a wave of new buying. The data points to a market recalibrating in real time, rather than one developing clear conviction in either direction.

    Jobs Data and CPI Are Next Tests for Bitcoin

    Gold’s decline toward $4,440 highlights the extent to which interest-rate expectations have changed market sentiment. Oil typically rises and stocks often fall during geopolitical shocks, while gold usually benefits from safe-haven demand. In this case, the increased probability of a Federal Reserve rate hike outweighed that traditional pattern.

    The next major catalysts for Bitcoin are the U.S. jobs report due Friday and the August Consumer Price Index reading scheduled for September 11. The data will help determine whether the Federal Reserve proceeds with a September rate increase and whether Bitcoin’s recent resilience continues.

    Because Bitcoin’s recent price movements have closely followed changes in rate expectations, the two economic reports could provide an important test of whether August’s gains represent a temporary rally or the foundation for a sustained advance.

    Frequently Asked Questions

    How did Bitcoin perform in August 2026?

    Bitcoin traded near $78,623 and was on track to finish August up more than 24%. That would make it the cryptocurrency’s strongest month since 2017, despite geopolitical tensions and shifting Federal Reserve policy expectations.

    How did the U.S. strikes on Iran affect traditional markets?

    The strikes pushed West Texas Intermediate crude prices up 2.6% to approximately $85.60 a barrel. The S&P 500 fell 0.5%, while the Nasdaq Composite declined 0.4%.

    How did Kevin Warsh’s Jackson Hole remarks affect markets?

    Warsh’s hawkish comments increased the estimated probability of a September Federal Reserve rate hike to roughly 58%, up from about 35%. Bitcoin’s rally subsequently slowed, and spot Bitcoin ETFs ended a nine-day inflow streak.

    What does derivatives data reveal about Bitcoin trading?

    Derivatives volume more than doubled to $183 billion over 24 hours, while open interest remained broadly flat. The pattern indicates that traders were repositioning existing positions rather than adding significant new capital.

  • Bitcoin Holds Steady as US Strikes on Iran Rattle Stocks and Send Oil Prices Higher

    Bitcoin Holds Steady as US Strikes on Iran Rattle Stocks and Send Oil Prices Higher

    Bitcoin remained above $78,000 on Monday despite fresh U.S. strikes on Iran, higher oil prices and losses across major stock indexes. The cryptocurrency traded near $78,623, down 0.7% over 24 hours, after falling to an intraday low of about $77,162, according to CoinGecko.

    Despite the daily decline, Bitcoin is on track to finish August more than 24% higher. That would make it the cryptocurrency’s strongest monthly performance since 2017.

    Bitcoin holds steady as geopolitical risks rise

    The weekend saw the first exchange of U.S.-Iran strikes since late July, renewing concerns about shipping through the Strait of Hormuz and driving crude oil prices higher.

    West Texas Intermediate futures rose 2.6% to approximately $85.60 a barrel. U.S. equities moved lower, with the S&P 500 down 0.5% at around 7,673 and the Nasdaq Composite falling 0.4% to about 26,289.

    Iliya Kalchev, an analyst at Nexo Dispatch, said Bitcoin’s resilience was more significant than its August gain. Kalchev noted that a hawkish Federal Reserve and an active geopolitical escalation rarely affect risk assets in the same week, making Bitcoin’s ability to hold its ground against both pressures a notable signal.

    Kalchev also pointed to derivatives data indicating that traders may be repositioning rather than adding significant new capital. Twenty-four-hour trading volume more than doubled to $183 billion, while open interest remained broadly unchanged.

    Fed policy weighs on crypto markets

    Bitcoin also faced pressure from Fed Chair Kevin Warsh’s hawkish address at Jackson Hole. Expectations for a September rate hike climbed to approximately 58%, compared with about 35% before his remarks.

    Gold also declined, slipping to nearly $4,440 as the stronger interest-rate outlook outweighed its typical safe-haven appeal.

    Bitcoin’s August rally lost momentum late last week following Warsh’s comments. Spot Bitcoin ETFs ended a nine-day streak of inflows, while Ethereum funds continued to attract investor money.

    Ethereum traded near $2,448 on Monday, registering a modest decline while remaining on course for an August gain approaching 30%.

    Market attention now shifts to Friday’s U.S. jobs report and the August consumer price index reading scheduled for September 11.

  • Why Is Bitcoin’s Price Down Today?

    Why Is Bitcoin’s Price Down Today?

    Bitcoin (BTC) fell about 0.7% over the 24 hours to around $77,800 on Aug. 31, extending its retreat after another failed attempt to hold above the $80,000 level.

    The decline followed a shift in global market expectations after Federal Reserve Chair Kevin Warsh’s speech at Jackson Hole on Friday. Warsh said inflation remained too high and indicated that further tightening could be necessary to bring inflation back to the Fed’s 2% target.

    The implied probability of a September rate increase climbed to approximately 57% on Monday, while the two-year US Treasury yield reached its highest level in more than a month. Barclays also revised its forecast after the speech and now expects two 25-basis-point rate increases, in September and December. The bank had previously expected interest rates to remain unchanged through the end of 2026.

    Bitcoin pressured by higher yields and geopolitical tensions

    Higher yields weighed on other risk assets. Asian equities fell on Monday, while US and European stock futures traded lower as markets adjusted to the prospect of tighter monetary policy.

    Renewed conflict between the US and Iran added to selling pressure over the weekend. US forces struck Iranian missile launchers on Larak Island, followed by retaliatory Iranian attacks against US forces in Jordan.

    Brent crude subsequently rose about 3.3% to $91.01 per barrel. The increase in oil prices added to inflation concerns as markets were already pricing in a higher probability of another Federal Reserve rate increase.

    Bitcoin entered the latest period of macroeconomic pressure after its strong August recovery stalled around $80,000. BTC gained roughly 23% over the past month and briefly traded above $81,000 last week, but repeated attempts to establish support in the $80,000-$82,000 region failed.

    Selling accelerated early on Aug. 31 after Bitcoin reached about $79,300 late on Saturday before falling below $78,000. The cryptocurrency briefly dropped toward $77,300, then surged toward $78,600 before giving up those gains.

    Leveraged positions contributed to the speed of the decline. Bitcoin futures open interest stood near $54.8 billion on Aug. 30, while roughly $390 million in crypto positions were liquidated over the previous 24 hours. Long positions accounted for about 70% of the losses.

    Institutional demand also weakened before the weekend. US spot Bitcoin exchange-traded funds recorded $201.8 million in net outflows on Aug. 28 after receiving $314.4 million on Aug. 25, $232.1 million on Aug. 26 and $242.2 million on Aug. 27, according to SoSoValue data.

    Despite Friday’s reversal, the funds remained at approximately $3.3 billion in net inflows for August.

    Bitcoin price analysis

    Bitcoin’s daily chart shows the price holding well above all four major exponential moving averages despite its retreat from $80,000.

    On the 2-hour chart, Bitcoin was trading near $77,800, below its 20-period EMA at $78,207, 50-period EMA at $78,288 and 100-period EMA at $77,399. The price remained above the 200-period EMA at $74,572.

    Bitcoin technical analysis

    The setup indicates that short-term momentum has weakened, with Bitcoin trading below its 20- and 50-period moving averages. However, the price remains above the 100- and 200-period EMAs, leaving the broader recovery structure intact for now.

    A sustained break below the $77,400 area could expose Bitcoin to further downside toward the 200-period EMA near $74,600. On the upside, a move back above the $78,200-$78,300 zone would bring the recent highs near $79,000-$80,000 into focus.

    The Stochastic RSI has also retreated from overbought territory. The faster line stands at 43.71, below the slower line at 46.56, indicating that near-term buying momentum has eased.

    A renewed move above $78,300 could signal improving momentum, while a deeper decline in the Stochastic RSI would reinforce the risk of further consolidation or a pullback. The bearish crossover shows that upside momentum has weakened while Bitcoin remains below $80,000.

    The Directional Movement Index (DMI) is not currently indicating a clear bearish trend. The positive directional indicator stands at 19.02, above the negative directional indicator at 15.40, while ADX is at 24.44.

    These readings suggest that buyers retain a slight directional advantage, although the relatively narrow gap between the two directional indicators points to limited conviction.

    Bitcoin’s inability to reclaim the $78,200-$78,300 area keeps that zone as immediate resistance. A sustained move above it could open the way toward $79,000 and the $80,000 psychological level.

    On the downside, the 100-period EMA around $77,400 is an important near-term support level. A break below it could expose the $76,000-$77,000 region, with the 200-period EMA near $74,600 providing deeper support.

    The Williams %R reading is around -66.11, indicating that Bitcoin has moved back toward the lower portion of its recent trading range but is not yet in oversold territory. The indicator would need to fall below -80 to signal more pronounced oversold conditions.

    A recovery in Williams %R alongside a move back above the $78,200-$78,300 EMA cluster would indicate improving short-term momentum. Conversely, a move below -80 combined with a break under the $77,400 support could increase the risk of a deeper pullback toward $76,000 and potentially the 200-period EMA.