Tag: Bitcoin price

  • Unprecedented Bitcoin Event Occurs on Binance for First Time Since 2023

    Unprecedented Bitcoin Event Occurs on Binance for First Time Since 2023

    Key Highlights

    • Binance recorded its highest single-day net Bitcoin outflow since 2023, exceeding 13,800 BTC, while exchange reserves dropped by roughly 20,000 BTC in four days.
    • Bitcoin has surged approximately 45% since July, holding above $82,000 for consecutive sessions and clearing key technical resistance levels.
    • CryptoQuant analyst Darkforth suggests the outflows signal a shift toward long-term holding and potential FOMO-driven re-entry, reducing available supply and limiting near-term selling pressure.

    Binance Sees Record Bitcoin Outflows as Price Surges Past $82,000

    Bitcoin’s sustained rally above the $82,000 threshold has triggered a historic withdrawal wave from Binance, the world’s largest cryptocurrency exchange by volume. According to on-chain data highlighted by CryptoQuant analyst Darkforth, the platform recorded a single-day net outflow surpassing 13,800 BTC, marking the largest such movement since 2023. Over the preceding week, Binance averaged roughly 2,000 BTC in daily net outflows, but the recent spike suggests a notable acceleration in investor behavior as the asset consolidates gains of approximately 45% from its July lows.

    Exchange Reserves Drop 20,000 BTC in Four Days, Tightening Market Supply

    The outflow surge has directly depleted Binance’s Bitcoin reserves, which fell from approximately 705,000 BTC to 685,000 BTC in just four days—a reduction of 20,000 BTC. Given that Binance holds an estimated 30% of all Bitcoin custodied on centralized exchanges accessible to retail investors, this drawdown represents a meaningful contraction in the immediately available supply. Darkforth notes that the persistent movement of coins off exchanges typically indicates a preference for long-term cold storage over active trading, a dynamic that structurally reduces the liquid supply available to meet potential sell orders.

    Analyst Flags FOMO Re-Entry as Potential Driver Behind Sudden Withdrawal Spike

    While the broader trend supports a bullish accumulation narrative, Darkforth cautions that the sudden magnitude of the latest outflows may also reflect a psychological shift. The analyst observes that investors who remained sidelined during prior bear-market declines—anticipating further drops—may now be re-entering the market driven by fear of missing out (FOMO) as prices break out. This behavior could amplify volatility if new holders lack conviction, but the net effect remains a reduction in exchange-held coins, which historically correlates with upward price pressure when demand remains steady.

    Why This Matters

    The confluence of technical breakout, declining exchange reserves, and record outflows from the industry’s dominant trading venue underscores a potential supply shock in the making. With Binance commanding nearly a third of centralized exchange Bitcoin holdings, its reserve trends serve as a bellwether for broader market liquidity. A sustained decline in exchange balances typically precedes periods of reduced sell-side pressure, as fewer coins are readily accessible for immediate liquidation. However, the mixed signals—genuine accumulation versus speculative FOMO inflows—warrant close monitoring of on-chain metrics such as coin days destroyed and holder unrealized profit/loss ratios to gauge the durability of the current holder base. The next critical test will be whether Bitcoin can maintain its footing above $82,000 during inevitable profit-taking episodes, or if the recent outflow spike proves to be a local peak in conviction.

    Frequently Asked Questions

    What caused the record Bitcoin outflow from Binance?
    The outflow coincided with Bitcoin’s rally above $82,000 and a 45% gain since July. Analysts attribute the movement to a combination of long-term accumulation (moving coins to cold storage) and potential FOMO-driven buying from investors re-entering the market after missing earlier lows.
    How much Bitcoin does Binance hold compared to other exchanges?
    Binance holds approximately 30% of all Bitcoin custodied on centralized exchanges accessible to investors, making its reserve levels a significant indicator of overall market liquidity.
    Does the outflow guarantee Bitcoin’s price will keep rising?
    Not necessarily. While declining exchange reserves reduce immediate selling pressure and are historically bullish, price direction depends on sustained demand. The analyst notes that some outflows may stem from speculative FOMO buying, which could reverse quickly if sentiment shifts.

    This is not investment advice.
  • Bitcoin ETFs Erase $5.8 Billion Hole

    Bitcoin ETFs Erase $5.8 Billion Hole

    Key Highlights

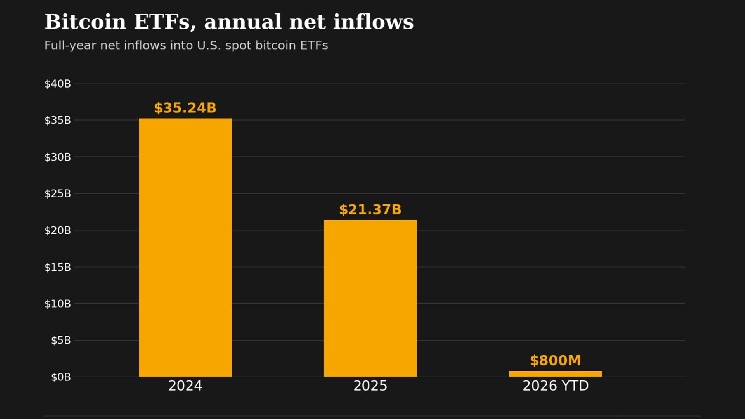
    • U.S. spot Bitcoin ETFs have reversed a $5.8 billion year-to-date deficit to post nearly $800 million in net inflows, per SoSoValue data.
    • Nearly $4 billion of inflows arrived after Treasury Secretary Scott Bessent’s August announcement of increased bond purchases amid surging yields.
    • Despite a six-day winning streak, 2025 inflows remain far below the $35.2 billion recorded in 2024 and $21.4 billion in 2025 full-year totals.

    Bitcoin ETFs Stage Dramatic Turnaround as Net Inflows Turn Positive for 2025

    Investors in U.S.-listed spot Bitcoin exchange-traded funds have engineered a remarkable reversal. After sitting on a staggering $5.8 billion year-to-date outflow as recently as July 13, according to CoinDesk’s analysis of SoSoValue data, the funds now boast nearly $800 million in net inflows for the year. The swing coincides with Bitcoin’s price recovery to approximately $85,000 from a June low below $58,000, a movement that has led several analysts to declare a new bull market is already underway.

    Liquidity Injection Catalyzes $4 Billion Inflow Surge

    The inflection point aligns closely with a pivotal macroeconomic shift. Since U.S. Treasury Secretary Scott Bessent’s August announcement detailing increased bond purchases—a liquidity management tool deployed as bond yields climbed to multi-year highs—nearly $4 billion has flowed into the ETF complex. This policy-driven liquidity expansion appears to have provided the tailwind necessary to overcome the persistent selling pressure that defined the first half of the year.

    Six-Day Winning Streak Tests Resistance at $85,000

    Momentum remains visible in recent trading sessions. The ETF suite has recorded six consecutive days of net inflows, a streak that has persisted even as Bitcoin’s price rally has stalled near the $85,000 level since Tuesday. The decoupling of fund flows from immediate price action suggests institutional allocation decisions are increasingly driven by strategic portfolio positioning rather than short-term momentum chasing.

    Why This Matters

    The shift from deep negative territory to positive year-to-date flows marks a critical psychological and structural threshold for the digital asset ecosystem. The 2024 calendar year saw $35.2 billion in total net inflows, while the source cites a $21.4 billion figure for 2025—indicating that despite the recent rebound, the current pace remains well below the run-rate established during the peak adoption phase. The sustained inflows following the Treasury’s bond-buying program highlight the sensitivity of Bitcoin-linked products to global liquidity conditions, reinforcing the narrative that Bitcoin functions as a liquidity-sensitive risk asset. Market participants will closely monitor whether the six-day streak can extend into a sustained trend capable of closing the gap with prior-year totals, and whether Bitcoin can decisively break above the $85,000 resistance that has capped gains this week.

    Frequently Asked Questions

    How much have U.S. spot Bitcoin ETFs attracted in net inflows for 2025?

    As of the latest data from SoSoValue, the funds hold nearly $800 million in net inflows year-to-date, a dramatic reversal from a $5.8 billion deficit recorded on July 13.

    What triggered the recent surge in ETF inflows?

    Approximately $4 billion of the inflows occurred after U.S. Treasury Secretary Scott Bessent’s August announcement of increased bond purchases, implemented as bond yields reached multi-year highs.

    How do current 2025 inflows compare to previous years?

    Despite the turnaround, the $800 million year-to-date figure remains significantly smaller than the $35.2 billion recorded for full-year 2024 and the $21.4 billion cited for 2025.

  • Bitcoin Hits $87,000: How High Can BTC Go?

    Bitcoin Hits $87,000: How High Can BTC Go?

    Key Highlights

    • Bitcoin has broken above its 50-week moving average (~$78,320) and the May swing high, confirming a five-wave Elliott Wave structure from the July low that signals a sustained uptrend rather than a counter-trend bounce.
    • The cryptocurrency has reached the pattern’s minimum target near $85,000, with primary upside objectives between $88,600 and $92,220 and an extended target at $97,637 if momentum persists.
    • A bearish RSI divergence has emerged—price making higher highs while momentum prints lower peaks—warning that the rally may be approaching exhaustion, though an immediate reversal is not guaranteed.

    Bitcoin Confirms Five-Wave Advance From July Low

    Bitcoin has cleared two critical technical thresholds this week, piercing its 50-week moving average—currently anchored near $78,320—and eclipsing the previous swing high established in May. According to a chart analyst tracking the structure, this breakout validates a completed five-wave Elliott Wave sequence that originated from the July trough. The formation is widely regarded in technical circles as evidence of a genuine impulsive trend rather than a corrective rebound, suggesting the dominant bias has shifted decisively to the upside.

    Anatomy of the Impulsive Structure

    The analyst detailed how this specific wave progression typically unfolds across five distinct phases. The advance begins subtly, with the initial leg higher passing largely unnoticed by the broader market. A protracted, sideways consolidation follows—the second wave—which erodes interest and convinces many participants that no meaningful move is underway. The third wave then erupts aggressively, trapping latecomers and short-sellers who are forced to chase the move. A second pause, the fourth wave, precedes a final fifth-wave push that requires comparatively less fresh capital because the majority of interested buyers have already committed.

    Projected Price Targets and the $85,000 Milestone

    Bitcoin has already tagged the pattern’s minimum measured-move objective around $85,000, a level the analyst characterized as a “weak outcome” given the structure’s implications. A more robust fulfillment zone sits between $88,600 and $92,220, while an extended Fibonacci projection places the upper bound near $97,637 should the rally accelerate into a lengthened fifth wave. These levels are derived from standard Elliott Wave measurement techniques applied to the completed July-to-present sequence.

    Momentum Divergence Raises Caution Flag

    Despite the constructive price action, a subtle but notable warning has appeared on the Relative Strength Index (RSI), a momentum oscillator that gauges buying pressure. The indicator has printed a lower high even as Bitcoin’s price registered a higher high—a configuration known as bearish divergence. This discrepancy often materializes near the terminal phase of a strong advance, signaling that internal momentum may be waning. The analyst emphasized that divergence alone does not precipitate an immediate top; rather, it serves as an alert that the probability of a pause or pullback is rising.

    Pullback Expectations and Key Support Zones

    A consolidation or retracement following a five-wave advance is considered normal market mechanics, not a structural failure. The analyst noted Bitcoin could conceivably hold above the 50-week moving average near $78,320, transforming the former resistance into support. Should a deeper correction materialize, a broader demand zone around $75,000 was flagged as a reference area where buyers may re-engage—explicitly described as a contextual zone, not a downside price target.

    Near-Term Invalidation and Upside Trigger Levels

    On shorter timeframes, Bitcoin has completed a smaller five-wave rally from the September 15 low. The pivotal level to monitor is $80,120; a sustained defense of this price preserves the immediate uptrend, while a confirmed breakdown would constitute the first tangible evidence that a local top is in place. Immediate support clusters between $80,566 and $82,985, with the $82,800 region highlighted as a likely retest candidate. A successful hold and renewed advance from that zone would open the path toward $88,900 as the next actionable objective.

    Why This Matters

    The completion of a textbook five-wave structure on the weekly timeframe carries weight beyond individual price targets—it informs portfolio positioning for institutional and retail participants alike. A confirmed impulsive sequence from a major low (July) suggests the cyclical bear market narrative has been invalidated, potentially unlocking a new wave of capital allocation toward digital assets. However, the concurrent RSI divergence introduces a tactical risk: trend-followers may need to manage position sizing and tighten trailing stops as the rally matures, while counter-trend traders should await price confirmation—such as a break of $80,120—before committing to short exposures. The $75,000–$78,320 band will likely define the “buy-the-dip” region if the market transitions from trend expansion to consolidation.

    Frequently Asked Questions

    Has Bitcoin already reached its peak for this cycle?
    Not necessarily. The analyst’s wave count indicates the minimum target ($85,000) has been met, but the primary target zone ($88,600–$92,220) and extended target ($97,637) remain intact. A bearish RSI divergence warns of slowing momentum, but divergences can persist during strong fifth waves and do not alone confirm a top.
    What price level would invalidate the current bullish structure?
    A confirmed break below $80,120 on the shorter timeframe would signal the immediate uptrend from the September 15 low has ended. On the larger structure, a breakdown beneath the 50-week moving average near $78,320—and especially a move toward the $75,000 support zone—would raise questions about the integrity of the five-wave advance.
    Is the $75,000 level a price target for a crash?
    No. The analyst explicitly stated the $75,000 area is a “reference zone” for where buyers may return if a deeper pullback occurs, not a forecast or downside objective. It represents a historical confluence area, not a prediction of decline.
  • Bitcoin Surges 44% in Q3, Signaling Potential Full-Blown Crypto Bull Run

    Bitcoin Surges 44% in Q3, Signaling Potential Full-Blown Crypto Bull Run

    Key Highlights

    • Bitcoin surged 44% in Q3 2025, marking its strongest quarterly performance since Q4 2024, significantly outpacing gold (+8.7%), the S&P 500 (+2%), and the Nasdaq (+2%).
    • Despite the rally, Bitcoin remains 48% below its all-time high of $126,000 set in October 2024, while major altcoins including ETH, XRP, SOL, UNI, and NEAR posted gains between 40% and 150%.
    • The initial recovery was fueled by oversold conditions and a short squeeze, but a emerging regulatory tailwind has recently provided additional momentum for the cryptocurrency complex.

    Bitcoin Leads Asset Class Performance in Third Quarter

    As the third quarter draws to a close, Bitcoin has emerged as the standout performer across major asset classes, climbing approximately 44% to trade near $84,753. Data from TradingView confirms the cryptocurrency’s dominance over traditional benchmarks: gold advanced 8.7%, while the S&P 500 and the tech-heavy Nasdaq Composite each managed only a 2% gain. The reversal is striking given the market dynamics at the start of the year, when equities—propelled by artificial intelligence enthusiasm—outpaced digital assets by a wide margin.

    Outpacing Mega-Cap Tech Including Nvidia

    The scale of Bitcoin’s outperformance extends to individual equity giants. Nvidia (NVDA), one of the world’s largest companies by market capitalization and a primary beneficiary of the AI investment wave, has risen roughly 11% over the same period. Bitcoin’s nearly fourfold advantage over the semiconductor leader underscores a pronounced shift in risk appetite and capital rotation toward digital assets during the quarter.

    Valuation Context: Still Well Below Record Highs

    Despite the robust quarterly advance, Bitcoin does not appear extended on a historical basis. The cryptocurrency remains approximately 48% below its all-time high of $126,000 reached in October 2024. This gap suggests substantial room for further recovery before previous peaks are retested, a factor likely supporting the narrative that the current rally represents a normalization rather than a speculative excess.

    Broad-Based Altcoin Strength Signals Risk-On Rotation

    The gains are not confined to Bitcoin. Major alternative tokens have recorded even larger percentage advances. Ether (ETH), XRP, Solana (SOL), Uniswap (UNI), and Near Protocol (NEAR) have each posted quarterly returns ranging from 40% to 150%. The breadth of the move indicates a broad-based risk-on rotation within the digital asset ecosystem rather than a Bitcoin-specific flight to safety.

    From Technical Overshoot to Regulatory Tailwind

    Market analysts attribute the initial phase of the recovery to deeply oversold technical conditions that attracted bargain hunters, amplified by a short squeeze that accelerated price appreciation. More recently, however, a regulatory tailwind has emerged as a fundamental catalyst. While the source does not specify particular policy developments, the shift suggests that evolving regulatory clarity—or the perception thereof—is beginning to underpin the technical recovery with a more durable structural bid.

    Why This Matters

    The third quarter performance marks a critical inflection point for digital assets. After a prolonged period where equity markets—particularly AI-exposed mega-caps—dominated returns, capital appears to be rotating back toward crypto as a distinct, high-beta asset class. The fact that Bitcoin outperformed both traditional safe havens (gold) and growth benchmarks (S&P 500, Nasdaq, Nvidia) simultaneously suggests a repricing of crypto’s role in diversified portfolios. With prices still significantly below the October 2024 peak, the setup favors continued recovery if the regulatory environment remains constructive. Upcoming quarterly earnings from crypto-exposed public companies and any further policy signals from major jurisdictions will be key drivers for Q4 momentum.

    Frequently Asked Questions

    How much has Bitcoin risen in Q3 2025?
    Bitcoin has gained approximately 44% in the third quarter, trading near $84,753 as the quarter ends.
    Is Bitcoin at a new all-time high?
    No. Despite the quarterly rally, Bitcoin remains about 48% below its record high of $126,000 set in October 2024.
    What drove the initial phase of the rally?
    The initial recovery was primarily driven by oversold technical conditions that attracted bargain hunters and a short squeeze that pushed prices higher.
  • Bitcoin Hits $85,000 as Short Squeeze Liquidates $648 Million in Bearish Bets

    Bitcoin Hits $85,000 as Short Squeeze Liquidates $648 Million in Bearish Bets

    Key Highlights

    • Bitcoin surged 5.4% to $84,984, breaking decisively above the September range high of $82,284 set on Sept. 4.
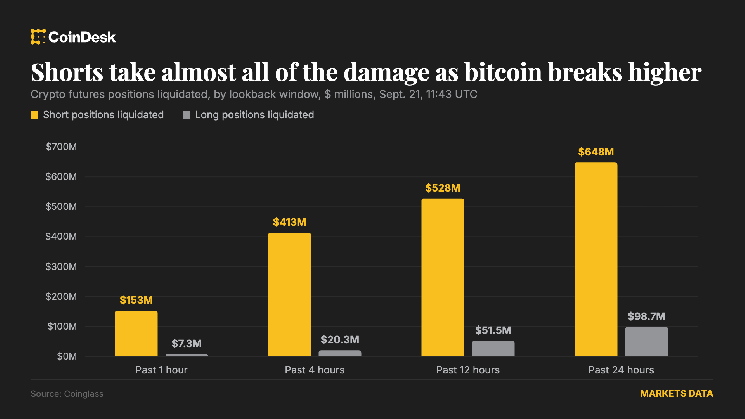
    • The rally was fueled primarily by a massive short squeeze, with $746 million in positions liquidated over 24 hours—$647.9 million of them shorts.
    • Open interest rose 7.59% to $156 billion and volume jumped 39% to $224 billion, indicating traders are re-establishing positions rather than exiting the market.

    Bitcoin Breaks September Resistance on Heavy Short Liquidations

    Bitcoin BTC extended its breakout above the top of its September trading range on Monday, changing hands at $84,984 during the late European morning session. The move represents a 5.4% gain over the prior 24 hours and leaves the asset well clear of the $82,284 high recorded on Sept. 4, which had previously capped upside attempts throughout the month.

    Forced Buying Drives Momentum Rather Than Fresh Conviction

    According to market analysts and data from Coinglass, the rally is being propelled predominantly by forced buying stemming from a cascading short squeeze rather than an influx of new long-side conviction. Over the past 24 hours, $746 million in total positions were liquidated, of which $647.9 million were short positions. In the most recent hour alone, an additional $159.9 million in positions were wiped out, with 95% of those liquidations on the short side.

    Bitcoin shorts accounted for $277.5 million of the 24-hour liquidation total, while Ether (ETH) shorts contributed $122.8 million. The disproportionate short-side washout underscores a market that was heavily positioned for downside or range-bound price action, leaving bears vulnerable to a sharp upside repricing.

    Open Interest and Volume Signal Position Replenishment

    Despite the massive short covering, open interest across the market has risen 7.59% to $156 billion, and 24-hour trading volume has surged 39% to $224 billion. This combination—rising open interest alongside heavy liquidations—suggests that traders are actively replacing the positions being closed out rather than stepping back from the market. The data points to a structural repositioning, with new participants or existing players re-entering on the long side as the breakout confirms.

    Why This Matters

    The break above the September range high marks a technically significant development for Bitcoin, which had been consolidating in a relatively tight band for weeks. The fact that the move was catalyzed by a short squeeze rather than organic spot buying introduces a degree of fragility: if the forced buying exhausts itself without follow-through from spot accumulators, a pullback toward the former resistance—now potential support—around $82,000 could materialize. However, the concurrent expansion in open interest and volume suggests the market is not merely covering shorts but rebuilding directional exposure. Traders will be watching closely for sustained spot bid interest, funding rate normalization, and whether the $85,000 level can flip to support in the coming sessions. The next key technical hurdle lies near the late-July highs around $87,500–$88,000.

    Frequently Asked Questions

    What triggered Bitcoin’s break above the September range?

    The breakout was driven primarily by a massive short squeeze, with $746 million in positions liquidated over 24 hours—$647.9 million of them shorts—forcing bearish traders to buy back positions and accelerating upside momentum.

    Does rising open interest during a short squeeze signal bullish continuation?

    Yes. The 7.59% increase in open interest to $156 billion, combined with a 39% volume surge to $224 billion, indicates traders are replacing liquidated shorts with new long positions rather than exiting the market, suggesting conviction behind the move.

    What are the key levels to watch after this breakout?

    Immediate support now sits at the former September high of $82,284. Upside targets include the late-July highs near $87,500–$88,000. Sustained spot buying and funding rate normalization will be critical for follow-through.

  • Bitcoin Rejected at $82K: 3 Reasons Behind Sunday Pullback

    Bitcoin Rejected at $82K: 3 Reasons Behind Sunday Pullback

    Key Highlights

    • Bitcoin rallied from $75,000 to nearly $82,000 last week before stalling at resistance amid escalating Middle East tensions.
    • The U.S. State Department warned of rapid escalation between Saudi Arabia and Iran-backed Houthis, prompting travel advisories and reported high-alert status for Iranian forces.
    • Technical indicator TD Sequential flipped to a sell signal at $81,500, suggesting short-term momentum is overextended, according to analyst Ali Martinez.

    Bitcoin’s Recovery Rally Hits Geopolitical and Technical Headwinds

    Bitcoin staged a sharp recovery last week, climbing from a low of $75,000 to within striking distance of $82,000 — its highest level since early March. The rally unfolded despite a confluence of macroeconomic pressures, including fallout from the CLARITY Act legislative setback and a hawkish Federal Reserve outlook that had previously weighed on risk assets. Buyers stepped in aggressively on Friday and Saturday, erasing the post-Senate vote decline in a matter of sessions. However, the upward momentum stalled just shy of the $82,000 mark as fresh geopolitical risks emerged from the Middle East, introducing a new layer of uncertainty for global markets.

    U.S. Warns of Rapid Escalation in Saudi-Houthi Conflict

    Reports over the weekend indicated a significant deterioration in regional security. The U.S. State Department issued a statement confirming that Iranian-supported Houthis have engaged in hostilities against Saudi Arabia, including targeting civilian airports. “Iranian-supported Houthis have engaged in hostilities against Saudi Arabia, including civilian airports. This military conflict has the potential to escalate rapidly,” said the US State Department. The statement also warned Americans to “seriously reconsider travel to and through the region.” Saudi authorities reported intercepting and destroying a ballistic missile fired at Riyadh on Saturday evening, with no casualties reported. Meanwhile, BBC sources noted that energy infrastructure along the Red Sea coast was also targeted.

    Adding to the tension, the X account Daily Iran News, which commands over 500,000 followers, claimed that Iran had issued “Code 100” — its highest alert level — for all armed forces, encompassing the Islamic Revolutionary Guard Corps (IRGC), the regular Army, and security forces. In response to the deteriorating situation, former President Donald Trump reportedly cut short his weekend at Camp David to return to the White House, while Israeli Prime Minister Benjamin Netanyahu also departed the U.S. earlier than planned.

    TD Sequential Flashes Sell Signal as Momentum Stretches

    On the technical front, the rally’s exhaustion coincides with a key indicator turning bearish. Analyst Ali Martinez observed that the TD Sequential, which had flashed a buy signal when Bitcoin touched $75,000, flipped to a sell signal on Saturday evening just as the price tapped $81,500. “That suggests short-term momentum may be getting stretched, and I’m watching closely for signs that it’s time to lock in some profits,” he added. The confluence of a technical sell trigger and heightened geopolitical risk has created a dual barrier for Bitcoin’s next leg higher, with traders now monitoring whether the asset can consolidate above $80,000 or faces a pullback toward the $78,000–$79,000 support zone.

    Why This Matters

    The intersection of geopolitical instability and technical resistance underscores Bitcoin’s evolving role as a macro-sensitive asset. While often framed as a hedge against monetary debasement, Bitcoin remains acutely responsive to global risk sentiment — particularly when energy markets and major power dynamics are involved. The Saudi-Houthi escalation threatens to disrupt oil flows through the Red Sea, potentially reigniting inflation fears and complicating the Federal Reserve’s policy path. For crypto markets, the TD Sequential sell signal adds a layer of technical discipline to the narrative-driven volatility, reminding participants that rapid, news-fueled rallies often require consolidation before sustainable trend continuation. The coming days will test whether Bitcoin can decouple from traditional risk-off impulses or remains tethered to the broader geopolitical cycle.

    Frequently Asked Questions

    What caused Bitcoin’s rally to stall near $82,000?

    The rally stalled due to a combination of escalating Middle East hostilities between Saudi Arabia and Iran-backed Houthis, which triggered risk-off sentiment, and a technical sell signal from the TD Sequential indicator at $81,500, suggesting short-term momentum was overextended.

    What is the significance of the U.S. State Department’s warning?

    The State Department confirmed active hostilities involving Iranian-backed Houthis targeting Saudi civilian infrastructure and warned the conflict could escalate rapidly, advising Americans to seriously reconsider travel to the region — signaling heightened concern over a broader regional war.

    What does the TD Sequential sell signal imply for Bitcoin’s next move?

    According to analyst Ali Martinez, the sell signal indicates short-term momentum is stretched, increasing the probability of a consolidation or pullback. He noted he is watching for signs to lock in profits, implying a cautious near-term outlook unless price action invalidates the signal.

  • Bitcoin Surpasses $80,000 Amid Bullish Sentiment; Chinese Analyst Forecasts Next Moves

    Bitcoin Surpasses $80,000 Amid Bullish Sentiment; Chinese Analyst Forecasts Next Moves

    Key Highlights

    • Bitcoin surged past $80,000 to trade near $81,000, triggering over $457 million in short-position liquidations over 24 hours.
    • Prominent miner Jiang Zhuoer forecasts a potential test of the $83,000–$84,000 resistance zone before a sharp correction to $72,000–$74,000.
    • Short positions accounted for 89% of total liquidations in the past 24 hours, signaling a aggressive bearish squeeze.

    Bitcoin Breaks $80,000 Barrier as Short Squeeze Accelerates

    Bitcoin ($BTC) surged above the psychologically significant $80,000 level in recent trading hours, climbing rapidly from a consolidation range near $78,000 to reach approximately $81,000. The sharp upward move unleashed a wave of forced liquidations across cryptocurrency derivatives markets, with short positions bearing the brunt of the losses. According to on-chain and exchange data, the rally has wiped out hundreds of millions of dollars in bearish bets, underscoring the fragility of leveraged short exposure at current price levels.

    Jiang Zhuoer Projects Next Resistance at $83,000–$84,000

    Jiang Zhuoer, a well-known Chinese cryptocurrency miner and market analyst, noted in his latest analysis that Bitcoin has validated his earlier thesis by recovering without breaching the $75,000 support level. Zhuoer stated that the velocity of the current ascent increases the probability of Bitcoin testing the strong resistance zone between $83,000 and $84,000 in the next phase. However, he cautioned that such a move would likely set the stage for a subsequent sharp correction, as the liquidation of short positions at those elevated levels could exhaust buying momentum and trigger a reversal.

    Analyst Warns of Correction Toward $72,000–$74,000 After Resistance Test

    Zhuoer believes that once short positions are flushed out near the $83,000–$84,000 region, Bitcoin could retreat toward the $72,000–$74,000 range. This pullback, he argues, would then target long positions accumulated during the rally, creating a two-sided liquidation event that could reset market structure. The miner’s framework suggests a classic high-leverage washout pattern: an initial short squeeze to clear overhead supply, followed by a deep retracement to cleanse excessive long leverage before the next directional move.

    Liquidation Data Reveals Magnitude of Short Squeeze

    The scale of the short squeeze is evident in the liquidation metrics across major derivatives venues. In the most recent four-hour window, total liquidations reached $306.55 million, of which $286.14 million — approximately 93% — were short positions. Long liquidations during the same period amounted to just $20.41 million. Extending the horizon to 12 hours, total liquidations climbed to $411.62 million, with shorts accounting for $372.53 million versus $39.09 million for longs. Over the full 24-hour period, cumulative liquidations hit $515.05 million, with short positions representing $457.26 million (89%) and longs $57.79 million. The overwhelming skew toward short liquidations confirms that the rally was driven predominantly by forced covering rather than fresh spot demand.

    Why This Matters

    The current price action highlights the outsized influence of leveraged derivatives on Bitcoin’s short-term price discovery. With open interest remaining elevated across major exchanges, the market remains vulnerable to violent two-way moves as liquidation clusters act as magnetic price targets. Zhuoer’s projected $83,000–$84,000 resistance aligns with key technical levels, including prior local highs and dense liquidation clusters visible on exchange heatmaps. A successful breach could attract momentum-driven flows, but the subsequent correction risk to $72,000–$74,000 underscores the importance of risk management for leveraged traders. For longer-term holders, the sequence reinforces Bitcoin’s tendency to purge excess leverage before establishing sustainable trends.

    Frequently Asked Questions

    What triggered Bitcoin’s surge past $80,000?

    The rally appears to have been fueled by a short squeeze in the futures market, where rapidly rising prices forced bearish traders to buy back positions, amplifying upward momentum. Over $457 million in short positions were liquidated in 24 hours.

    What is Jiang Zhuoer’s price prediction for Bitcoin?

    Jiang Zhuoer expects Bitcoin to potentially test the $83,000–$84,000 resistance zone before correcting sharply to the $72,000–$74,000 range as long positions are subsequently liquidated.

    How significant were the recent liquidations?

    Extremely significant. In the last 24 hours, total liquidations reached $515.05 million, with short positions accounting for 89% ($457.26 million). The 4-hour window alone saw $286.14 million in short liquidations versus only $20.41 million in longs.

  • Bitcoin (BTC) Tops $80K Again, Altcoins Surge: Top Gainers and Market Drivers

    Bitcoin (BTC) Tops $80K Again, Altcoins Surge: Top Gainers and Market Drivers

    Key Highlights

    • Bitcoin surged 4.7% in 24 hours to reclaim the $80,600 level on Binance, triggering $198 million in leveraged liquidations—$190 million of which were short positions.
    • Major altcoins outperformed Bitcoin, with Arbitrum (ARB) jumping 29%, Near Protocol (NEAR) rising 26%, Uniswap (UNI) gaining 20%, and Aptos (APT) climbing 18%.
    • The rally coincides with the SEC’s announcement of a “novelty waiver” plan to temporarily permit tokenized stock trading for five years, which analysts say signals growing institutional blockchain adoption.

    Bitcoin Breaks $80K as Short Liquidations Fuel Sharp Rebound

    Bitcoin staged a forceful recovery on Tuesday, climbing back above the psychologically significant $80,000 threshold and reaching $80,600 on Binance. The 4.7% gain over the previous 24 hours caught leveraged traders off guard, resulting in $198 million worth of positions liquidated in a single hour. Data from Bitcoinsistemi.com shows that $190 million of those liquidations were short positions, underscoring the intensity of the squeeze that propelled the leading cryptocurrency higher.

    Altcoins Outpace Bitcoin with Double-Digit Gains

    The bullish momentum spilled broadly across the altcoin market, where several assets posted percentage gains well ahead of Bitcoin’s. Ethereum rose 4% to surpass $2,550, while Solana advanced 7.8% to top $108 and XRP climbed 4.5% above $1.30. The strongest performers, however, were among the so-called “altcoin leaders.” Arbitrum (ARB) surged 29%, Near Protocol (NEAR) added 26%, Uniswap (UNI) gained 20%, and Aptos (APT) rose 18%. Jupiter (JUP), Worldcoin (WLD), and Ether.fi (ETHFI) followed with increases of 15.5%, 15.2%, and 15%, respectively.

    SEC “Novelty Waiver” Sparks Optimism for Tokenized Assets

    Market analysts attribute the broad-based altcoin strength to an improvement in regulatory sentiment following a landmark announcement by the U.S. Securities and Exchange Commission. On Monday, the SEC unveiled a “novelty waiver” plan that will temporarily allow tokenized stock trading for the next five years. Analysts believe the move anticipates a significant rise in the use of supporting blockchain infrastructure should tokenized equities achieve widespread adoption, providing a fundamental tailwind for layer-one and layer-two tokens alike.

    Why This Matters

    The convergence of a sharp short squeeze in Bitcoin and outsized altcoin gains highlights how quickly leverage-driven volatility can cascade across the digital-asset complex. More structurally, the SEC’s “novelty waiver” represents a rare regulatory green light for tokenized securities, potentially unlocking institutional capital flows into blockchain networks that power settlement, custody, and compliance layers. If tokenized stock trading scales as regulators envision, demand for high-throughput, low-cost infrastructure—exemplified by Arbitrum, Near, and Aptos—could accelerate well beyond speculative cycles. Traders and investors should monitor whether the current rally extends into sustained volume or retraces once liquidation-driven buying exhausts itself.

    Frequently Asked Questions

    How much was liquidated during Bitcoin’s move above $80,000?

    $198 million in leveraged positions were liquidated in the last hour, of which $190 million were short positions, according to Bitcoinsistemi.com data.

    Which altcoins posted the largest percentage gains?

    Arbitrum (ARB) led with a 29% increase, followed by Near Protocol (NEAR) at 26%, Uniswap (UNI) at 20%, and Aptos (APT) at 18%.

    What is the SEC’s “novelty waiver” and why does it matter?

    The SEC announced a “novelty waiver” plan that will temporarily permit tokenized stock trading for five years. Analysts view this as a signal that regulatory barriers for blockchain-based financial infrastructure are lowering, which could drive long-term demand for the networks that support tokenized assets.

    This is not investment advice.

  • Bitcoin Price Nears $80K as Trump Signals Iran Talks

    Bitcoin Price Nears $80K as Trump Signals Iran Talks

    Bitcoin Recovers 3% to $79,143 as Trump Signals Iran Diplomacy, but Geopolitical Risks Persist

    Bitcoin ($BTC) climbed approximately 3% to $79,143 on Monday after briefly touching $79,325, buoyed by comments from U.S. President Donald Trump suggesting Iran wants to reach a deal with Washington. The recovery comes despite conflicting statements from Tehran and ongoing military tensions that continue to pressure energy markets.

    Trump Comments Spark Risk-On Sentiment

    Bitcoin’s rebound accelerated after President Trump posted on Truth Social that Tehran was eager for an agreement.

    “The failing Nation of Iran wants to make a deal, quickly and badly,”

    Trump wrote. He added that he would decide whether the United States engages with Tehran, though he said Washington was open to the idea. The remarks introduced the possibility of renewed talks after months of military exchanges and repeated failures to secure a lasting agreement.

    During the recovery, Bitcoin first moved above $78,000 and reached $78,940 before extending gains. A daily Binance chart on TradingView showed BTC opening at $76,842, dipping to $76,388, and later peaking at $79,325. The asset traded near $79,143 at the time of capture, representing a 3% daily gain.

    U.S. equities mirrored the cryptocurrency’s move. Approximately $570 billion returned to stocks within three hours after the session had earlier erased more than $600 billion. Technology shares had faced additional pressure after executives from artificial intelligence companies called for slower development to address safety risks, adding another layer of uncertainty for a sector that has driven much of the recent U.S. equity rally.

    However, Iranian state media rejected Trump’s claim that Tehran was seeking a quick agreement, leaving the market without confirmation from both governments. LiveSquawk separately cited Iran’s ILNA news agency as saying the United States had sought a “phased” agreement, based on information attributed to a Pakistani source. The report did not establish that Washington and Tehran had accepted final terms.

    Oil Above $100 Keeps U.S.-Iran Risk Active

    The diplomatic dispute unfolds as attacks involving Iran-aligned forces continue to pressure oil production and shipping routes.

    According to Reuters, Yemen’s Iran-aligned Houthis launched missiles and drones at a military airbase in Khamis Mushait, Saudi Arabia. The group said it targeted aircraft hangars, radar equipment, runways, and ammunition storage sites in response to Saudi strikes in Yemen.

    In a separate attack, which Riyadh blamed on Iran-backed fighters in Iraq, Saudi Arabia’s east-west pipeline was taken offline. The route allows oil exports to bypass the Strait of Hormuz, making it critical while traffic through the strait remains restricted.

    Traders told Reuters that an extended pipeline closure could affect as much as 4% of global oil supply. Brent crude rose more than 4% after the weekend before paring gains following Trump’s comments. It later traded near $106 per barrel, while U.S. crude remained above $100.

    For American consumers, Reuters reported that the average retail diesel price had reached a record above $6.23 per gallon. Sustained energy costs could feed inflation and complicate the Federal Reserve’s interest-rate decisions, creating a direct link between the conflict and the conditions facing U.S. Bitcoin investors.

    As crypto.news previously reported, Bitfinex analysts identified energy costs and real Treasury yields as restraints on Bitcoin. The analysts said an oil shock could keep inflation expectations elevated, while tighter monetary policy would reduce liquidity without resolving the loss of energy supply.

    Oman had planned to host Iranian and Gulf officials for discussions over the future operation of the Strait of Hormuz. Foreign Minister Sayyid Badr Albusaidi postponed the meeting “in the interests of consensus,” without announcing a replacement date. Iran said Saudi Arabia had requested the delay. Tehran also published a list of 77 vessels it said had breached its operating rules in the strait, warning that future violations could lead to fines, detention, or confiscation.

    Bitcoin Faces Technical Resistance Near $80,000

    Technical readings show Bitcoin has returned above the center of its daily Bollinger Bands but has not cleared the upper boundary.

    • Bollinger Band midpoint: ~$78,521
    • Upper band: ~$81,035
    • Lower band: ~$76,008

    BTC’s move above the midpoint gives buyers control of the immediate range, although the upper band and recent highs create resistance between $80,000 and $81,035.

    Bitcoin price daily chart — Sep. 15 | Source: crypto.news

    A one-week CoinGlass liquidation heatmap shows the largest nearby concentration of leveraged positions just below $80,000. The brightest band appears around $79,900 to $80,000, making the area a possible target if buyers extend the advance.

    Bitcoin liquidation heatmap | Source: CoinGlass

    Several smaller liquidation pools sit between roughly $80,200 and $80,700. A clean move through that region would bring the Bollinger Band ceiling near $81,035 into focus, followed by the larger $82,000 area identified in recent Bitfinex analysis.

    Momentum Signals Remain Mixed

    Momentum remains less certain. The daily MACD line stood near 1,579, below its signal line around 2,211, while the histogram had fallen to approximately minus 631. Both MACD lines remained above zero, but the bearish crossover and red histogram bars showed that momentum had weakened after Bitcoin’s sharp August rally.

    Price action has also remained uneven since BTC first moved above $80,000. Buyers have defended pullbacks toward the mid-$76,000 area, yet several attempts to hold above $81,000 have failed. The current move has returned Bitcoin to the upper half of that range without confirming a breakout.

    Key Support Levels to Watch

    On the downside, the Bollinger midpoint near $78,521 forms the first technical support. Losing it would expose the $77,500 to $78,000 region, where the heatmap shows a series of smaller leveraged clusters.

    The largest lower liquidity concentration sits around $76,000, close to the daily lower Bollinger Band. A sustained break below that zone could expose another pool near $75,000 to $75,400.

    Fed Policy Adds Another Test for U.S. Investors

    The Iran conflict is not the only event capable of disrupting Bitcoin’s recovery. The Federal Reserve meets on Sept. 15 and 16, with its policy statement, updated economic projections, and Chair Kevin Warsh’s press conference due on Wednesday.

    Markets had priced an 87% probability of a quarter-point increase before the meeting. Such a decision would move the federal funds target range from 3.50%–3.75% to 3.75%–4.00%.

    Bitfinex analysts said the Fed’s projections could matter more for Bitcoin than the rate announcement itself because they will show whether officials expect one increase or a longer series of moves. Higher Treasury yields can raise the return available from government securities, increasing competition for capital held in non-yielding assets such as Bitcoin.

    U.S.-listed spot Bitcoin exchange-traded funds provide another measure of demand from American investors. The products attracted $986.7 million during the week ending Sept. 4, after taking in $924.5 million the previous week. Three consecutive positive weeks brought the combined inflow to about $3.8 billion.

    Fed policy, oil prices, and developments around the Strait of Hormuz will now overlap with the liquidation levels visible on the Bitcoin chart. The Federal Reserve is scheduled to release its decision on Wednesday afternoon, followed by Warsh’s press conference and the central bank’s updated economic projections.

  • Bitcoin Price Surges Despite Hot US Inflation Data

    Bitcoin Price Surges Despite Hot US Inflation Data

    Bitcoin Price Spikes, Shrugs Off Hot US Inflation Data

    Bitcoin’s price rose on Friday despite data revealing that U.S. inflation had accelerated, defying typical market expectations that higher inflation would pressure risk assets.

    Bitcoin Trades Near $79,000 Amid Inflation Surprise

    The largest cryptocurrency by market capitalization was recently trading close to $78,749 after jumping 2% over a 24-hour period. At one point on Friday morning in New York, bitcoin rose as high as $79,607.

    The price spike came after the release of August consumer price index data showing U.S. consumer prices accelerated, reinforcing expectations that the Federal Reserve will raise interest rates at its meeting next week.

    Core Inflation Exceeds Forecasts

    The consumer price index, excluding food and energy, climbed 0.3% in August from a month earlier, which was higher than expected. Inflation in the U.S. has been difficult to tame due to the war with Iran, which has lifted oil prices, in turn raising the costs of food, gasoline, and other goods.

    Higher inflation typically means the Federal Reserve will raise interest rates, which in turn could stop bitcoin’s price climbing higher. According to CME’s FedWatch tool, traders think there is an 85% chance interest rates will be higher by next week.

    Fed Policy Outlook and Bitcoin’s Rate Sensitivity

    Bitcoin has typically performed well in a low interest rate environment because it means people can buy more of the cryptocurrency with increased liquidity. The Federal Reserve will meet next week and reveal what it will do with borrowing costs.

    Federal Reserve Chairman Kevin Warsh, who took the helm in January, last month gave his first speech as head of the U.S. central bank and said he had more work to do to fight inflation.

    Political Context: Affordability Crisis and Midterm Elections

    The U.S. is currently in the grips of an affordability crisis and rising oil prices are a hot topic ahead of the midterm elections. U.S. President Donald Trump has reassured voters that prices will get under control and repeatedly put pressure on the central bank to lower interest rates.

    Recent Catalysts: Regulatory Clarity and Treasury Policy

    Bitcoin in August had its biggest run in years following positive regulatory news and an announcement from the U.S. Treasury. Treasury Secretary Scott Bessent announced the department would double the size of its long-dated bond buybacks, helping non-yielding assets like bitcoin and gold. The cryptocurrency then benefited from President Trump urging lawmakers to get key crypto legislation, the Clarity Act, over the line.

    This post first appeared on Bitcoin Magazine and is written by Mathew Di Salvo.