Category: Coins

Digital assets, cryptocurrencies, blockchain, and currency news.

  • Hacker Steals $2 Million From Fetch.ai, NuNet in Single Attack

    Hacker Steals $2 Million From Fetch.ai, NuNet in Single Attack

    Key Highlights

    • Security firms Blockaid and PeckShield confirm a single attacker exploited both Fetch.ai and NuNet on September 19, stealing a combined total of nearly $2 million.
    • The exploiter drained 8.7 million FET tokens ($1.53 million) from a Fetch.ai converter contract, then used the same wallet to mint 408.5 million unauthorized NTX tokens ($463,000) via NuNet’s deployer account.
    • NuNet’s NTX token plummeted 65–70% while FET fell roughly 10%; the attacker quickly converted most proceeds into 546 ETH (~$1.44 million) to obscure the trail.

    Coordinated Exploit Hits Two AI-Crypto Projects Within Hours

    Blockchain security firms Blockaid and PeckShield have identified a single threat actor responsible for back-to-back exploits targeting Fetch.ai and NuNet on September 19. The combined haul approaches $2 million, underscoring a recurring vulnerability in the permission structures of AI- and compute-focused crypto protocols. Researchers say the same wallet address received funds from both incidents, providing a clear on-chain link between the two attacks.

    Fetch.ai Converter Contract Drained First

    The attack sequence began with the exploitation of a token converter contract belonging to Fetch.ai. According to Blockaid’s analysis, the attacker siphoned approximately 8.7 million FET tokens, valued at roughly $1.53 million at the time. The stolen assets were transferred to a wallet that would later serve as the bridge to the second exploit.

    Same Wallet Used to Mint Unauthorized NuNet Tokens

    Using the identical wallet that received the FET proceeds, the exploiter then interacted with NuNet’s deployer account to mint 408.5 million NTX tokens without authorization, netting an additional $463,000. Blockaid has published the exploiter’s wallet addresses and a sample transaction, enabling exchanges, bridge operators, and other projects to flag and block further movement from those addresses.

    Market Reaction and Attacker Obfuscation

    The market impact was immediate and asymmetric. NuNet’s NTX token crashed between 65% and 70% across various trackers, while Fetch.ai’s FET token declined approximately 10%. The attacker moved swiftly to launder proceeds, converting a large portion of the stolen funds into 546 ETH (roughly $1.44 million)—a standard tactic to complicate tracing and reduce the risk of asset freezes by centralized platforms.

    No Official Statements; Researchers Urge Caution

    As of publication, neither Fetch.ai nor NuNet has issued an official statement addressing the exploits or confirming the status of their smart contracts. Security researchers monitoring the incident are advising all holders and active users of FET and NTX tokens to exercise caution until the development teams provide clarity on the root cause and whether their platforms are safe to resume normal operations.

    Why This Matters

    The dual exploit highlights a systemic weak point across AI- and compute-oriented crypto projects: misconfigured or overly permissive smart contract access controls. In this case, a single compromised key or permission set allowed the attacker to drain liquidity from one protocol and leverage the same credentials to mint unauthorized supply on a completely separate, unrelated protocol. The incident reinforces the need for stricter role separation, multi-signature governance for deployer accounts, and continuous permission auditing—especially for projects that share infrastructure patterns or developer tooling across the AI-crypto intersection.

    Frequently Asked Questions

    Which projects were exploited and how much was stolen?

    Fetch.ai lost approximately 8.7 million FET tokens ($1.53 million) from a converter contract, and NuNet had 408.5 million NTX tokens ($463,000) minted without authorization via its deployer account. The combined value is nearly $2 million.

    How do we know the same attacker hit both projects?

    Blockaid and PeckShield traced the on-chain flow and found that the wallet receiving the stolen FET tokens was the exact same wallet used to execute the unauthorized NTX mint on NuNet. Blockaid has published the wallet addresses and a sample transaction as evidence.

    Have Fetch.ai or NuNet responded officially?

    As of this report, neither project has released an official statement. Security researchers recommend token holders and users remain cautious until the teams confirm the root cause and platform safety.

  • Altcoin Market Cap Surpasses $1.07T as Bitcoin Dominance Weakens, Fueling Altseason Speculation

    Altcoin Market Cap Surpasses $1.07T as Bitcoin Dominance Weakens, Fueling Altseason Speculation

    Key Highlights

    • The total altcoin market capitalization, including Ethereum, has broken above the critical $1.07 trillion resistance level, marking the midpoint of a long-term trading range with a ceiling near $1.71 trillion.
    • Market sentiment has shifted decisively bullish: the Crypto Fear & Greed Index has held above 60 since August 20, and 70% of altcoins on Binance now trade above their 200-day moving average, confirming sustained upward momentum.
    • Despite the strength, the Altcoin Season Index sits at just 54—well below the 80 threshold that historically signals a true altseason—while analysts warn that rising social-media-driven leverage could trigger a near-term pullback.

    Altcoin Market Cap Breaks Key Resistance, Signaling Broad-Based Strength

    The cryptocurrency market has entered a pronounced greed phase, with the Crypto Fear & Greed Index climbing above 60 on August 20 and remaining at elevated levels since. This sentiment shift coincides with a sharp Bitcoin recovery that lifted BTC from roughly $76,000 back above the $80,000 mark, rekindling risk appetite across the digital-asset spectrum. Crucially, the aggregate altcoin market capitalization—including Ethereum—has mirrored Bitcoin’s gains, clearing the pivotal $1.07 trillion level that represents the midpoint of a multi-year range whose upper boundary sits near $1.71 trillion.

    Technical Milestones and On-Chain Confirmation

    Glassnode, in a post on X, observed that altcoin open interest as a share of Bitcoin’s open interest has not yet reached risk thresholds, suggesting the current rally is not overextended on a leverage basis. The research firm added that “A resurgent Ethereum also helped make the case that the altcoin strength would continue in the coming days and weeks.” Supporting this view, crypto analyst Darkfost noted that “70% of the altcoins on Binance have moved back above their 200-day moving average.” He emphasized that “This confirmed that a majority of them were experiencing strong, sustained bullish momentum in recent weeks to clear this key MA.” Meanwhile, Bitcoin itself is eyeing the next major hurdle at the $82,000 resistance zone, a break of which could further amplify capital rotation into alternative assets.

    Why Altseason Has Not Yet Arrived Despite Bullish Metrics

    While price action and breadth indicators are flashing green, the dedicated Altcoin Season Index remains at only 54. Historical precedent shows that true altseason extremes typically occur when this index surpasses 80—a level last seen in September 2025, just weeks before Bitcoin printed its all-time high. The source analysis states plainly: “It is not yet altseason.” It adds that “Rising altcoin market cap and falling Bitcoin dominance trends, if they come true in the coming weeks, will serve as confirmation of hefty capital flow into the altcoin market.” In other words, the necessary rotation from Bitcoin dominance into a broad altcoin rally is still in its early innings.

    Social Hype and Leverage: The Double-Edged Sword

    Alphractal, writing on X, highlighted a surge in social-media activity accompanying the price rally: “The sudden price rally across the market resulted in a surge in social media posts. This can lead to more discussion, more FOMO, and more speculation.” The same analysis cautioned that “Heightened leverage could be a factor to watch out for, as it would increase the risk of a pullback.” Nevertheless, the firm concluded that “As things stand, the conditions support further gains for the altcoin market.”

    Why This Matters

    The breach of the $1.07 trillion altcoin market-cap midpoint is a structurally significant development. It suggests that capital is beginning to diversify beyond Bitcoin in a sustained manner, a prerequisite for any genuine altseason. However, the sub-80 Altcoin Season Index reading indicates that leadership remains concentrated in a subset of large-cap assets—likely Ethereum and a handful of major layer-1s—rather than the broad-based speculative frenzy that characterizes mature alt cycles. Traders and investors should monitor two key confirmation signals: a decisive decline in Bitcoin dominance below its recent range and a sustained push of the Altcoin Season Index toward the 80 threshold. Simultaneously, the rapid rise in social-media chatter and potential leverage buildup warrants caution; history shows that excessive retail FOMO often precedes sharp, short-lived corrections even within longer-term uptrends.

    Frequently Asked Questions

    Has altseason officially started according to the Altcoin Season Index?

    No. The Altcoin Season Index currently sits at 54, well below the 80 level that historically marks the beginning of a true altseason. The last time the index exceeded 80 was in September 2025, shortly before Bitcoin reached its all-time high.

    What technical level did the total altcoin market cap just clear, and what is the next target?

    The aggregate altcoin market capitalization (including Ethereum) broke above the $1.07 trillion midpoint of a long-term range. The next major resistance is the range high near $1.71 trillion.

    What are the primary risks to the current altcoin rally?

    Analysts flag two main risks: (1) a rapid increase in leverage driven by social-media-fueled FOMO, which could amplify any pullback, and (2) the absence of a confirmed downtrend in Bitcoin dominance, which is needed to validate broad-based capital rotation into altcoins.

  • NEAR Hits New ‘All-Time High’ in TVL, But What About Its Price?

    NEAR Hits New ‘All-Time High’ in TVL, But What About Its Price?

    Key Highlights

    • NEAR Protocol surges over 10% in 48 hours, breaking the $3.2–$3.4 supply zone to print a new local swing high at $3.9 while trading above all key Exponential Moving Averages.
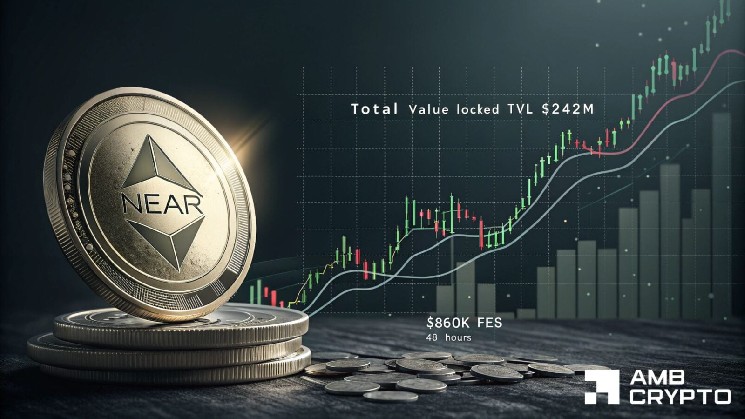
    • Network fundamentals hit record strength: Total Value Locked (TVL) reaches an all-time high of $242 million and protocol fees climb to $860,000 over the same period, per DefiLlama data.
    • NEAR satisfies all criteria for its anticipated milestone airdrop as of September 19, with TVL having crossed $70 million and price clearing $3.3, adding a fundamental catalyst to the technical breakout.

    NEAR Protocol Leads Crypto Market Rebound with Double-Digit Gains

    NEAR emerged as one of the cryptocurrency market’s biggest beneficiaries over the last 48 hours as the wider sector flashed green. The token recorded gains exceeding 10%, propelled by improving network activity that provided fundamental backing for the rally. This explosive bullish push cleared NEAR’s supply zone between $3.2 and $3.4 and printed a new local swing high at $3.9. With the token now trading above all key Exponential Moving Averages, market participants are assessing whether network bulls can sustain the momentum.

    On-Chain Fundamentals Underpin Price Surge

    Latest on-chain metrics reveal that fundamentals for NEAR Protocol have been robust over time. To be specific, the blockchain’s Total Value Locked set another record high of $242 million while network fees soared over the last 48 hours. This hike may be evidence that more capital is pouring into NEAR’s ecosystem. Additionally, NEAR protocol’s fees hit the $860,000-mark over the same period. Cumulatively, the hike in capital inflows into the network and fee generation may be a sign of growing activity across the ecosystem, according to data sourced from DefiLlama.

    Airdrop Milestone Adds Catalyst to Bullish Narrative

    Still, it is worth noting that 19th September marks the first day since NEAR ticked all the boxes for the anticipated milestone airdrop. The token’s TVL crossed the $70 million-mark two days ago while yesterday’s rally pushed the token’s price above $3.3. This convergence of technical breakout, record on-chain activity, and airdrop eligibility creates a multi-layered bullish case that distinguishes NEAR from peers relying solely on speculative momentum.

    Technical Outlook: Bulls Face Profit-Taking Test

    NEAR’s ability to maintain the prevailing momentum will depend on whether buyers continue to support the token after its 10% daily hike. A sustained rally alongside further growth in TVL and network fees would keep the bullish structure intact and could bring higher price levels into focus. Conversely, a rise in profit-taking could force NEAR to consolidate and retest nearby support. As it stands, the network’s long-term on-chain sentiments point to a potential bullish continuation. However, a short-term correction from the anticipated profit-taking cannot be ignored completely.

    Why This Matters

    The NEAR Protocol rally exemplifies a growing market trend where price action is increasingly tied to verifiable on-chain fundamentals rather than pure speculation. The simultaneous achievement of an all-time high in TVL ($242 million), a surge in protocol revenue ($860,000 in 48 hours), and the satisfaction of airdrop criteria signals genuine ecosystem adoption. For investors and developers, this suggests NEAR’s sharded proof-of-stake architecture is attracting meaningful capital and usage—critical for long-term viability in the competitive Layer-1 landscape. The upcoming days will test whether the protocol can convert speculative inflows into sticky liquidity, a key determinant of whether the $3.9 high becomes a launchpad or a local top.

    Frequently Asked Questions

    What triggered NEAR’s recent price surge above $3.9?
    The surge was driven by a combination of broad crypto market recovery, NEAR clearing a key $3.2–$3.4 supply zone, and strong on-chain fundamentals including record TVL of $242 million and $860,000 in protocol fees over 48 hours.
    Has NEAR qualified for its anticipated milestone airdrop?
    Yes, as of September 19, NEAR met all criteria for the milestone airdrop after TVL crossed $70 million and the token price surpassed $3.3.
    What are the key levels to watch for NEAR’s next move?
    Immediate resistance lies at the $3.9 local high, while support zones to watch on any pullback include the cleared supply area at $3.2–$3.4 and key Exponential Moving Averages now acting as dynamic support.
  • XRP $2 Dream Returns: Whales Absorb $2.2 Billion Tokens in 96-Hour Spree

    XRP $2 Dream Returns: Whales Absorb $2.2 Billion Tokens in 96-Hour Spree

    Key Highlights

    • XRP whale addresses accumulated approximately 1.54 billion tokens worth $2.2 billion in a 96-hour window, pushing total whale holdings to 9.81 billion tokens according to Santiment data tracked by Ali Martinez.
    • A bullish inverse head and shoulders pattern has formed on the daily XRP/USD chart with key support established at $1.33, current price holding at $1.40, and critical neckline resistance at $1.55.
    • Despite significant XRP inflows to Binance that typically signal selling pressure, aggressive buying demand is absorbing supply and withdrawing tokens to cold wallets, reducing immediate sell-off risk.

    Whale Accumulation Reaches Historic Pace in Second Half of 2026

    One of the most significant XRP buying campaigns of the second half of 2026 is currently unfolding across cryptocurrency markets. Over a compressed 96-hour period, large-scale investors—commonly referred to as whales—have absorbed approximately 1.54 billion XRP tokens from circulating supply. At prevailing exchange rates, this accumulation represents roughly $2.2 billion in notional value, signaling conviction among high-net-worth participants. The surge has propelled the $2.00 per token price target back into realistic territory for the first time in months.

    On-chain analytics platform Santiment has documented a sharp shift in sentiment among key network participants. According to data shared by analyst Ali Martinez, the supply distribution chart displays a near-vertical surge in whale address holdings. Combined balances have broken out of a prolonged consolidation phase in a matter of days, climbing toward peak levels and reaching a collective 9.81 billion XRP tokens held by whale entities. This rapid expansion of concentrated holdings suggests coordinated accumulation rather than organic retail-driven demand.

    Inverse Head and Shoulders Pattern Defines Technical Battlefield

    Pattern Anatomy: Support, Base, and Resistance

    The buying spree coincides with the formation of a rare and closely watched technical structure on the daily XRP/USD chart: an inverse head and shoulders pattern. This bullish reversal formation comprises three critical price zones that are currently dictating market dynamics. Large investors have established a robust defense zone around $1.33, forming a solid right shoulder that has thus far rejected multiple downside probes. The token’s price is currently consolidating around $1.40, demonstrating firm stability above this support base. However, the primary obstacle for buyers remains the pattern’s neckline at $1.55—a level that has capped previous recovery attempts.

    Exchange Inflows Absorbed, Cold Wallet Withdrawals Accelerate

    Adding complexity to the technical picture, on-chain trackers have recorded a large inflow of XRP to the Binance exchange. Under typical market conditions, such deposit volumes would trigger panic selling and price depreciation as traders anticipate liquidation. The current environment, however, is defying this convention. Aggressive buying demand is fully absorbing the incoming supply, with tokens being rapidly withdrawn from exchange custody into cold wallets for long-term holding. This migration significantly reduces available selling pressure and limits the risk of sudden, cascading sell-offs that could derail the emerging uptrend.

    Why This Matters

    The convergence of historic whale accumulation, a textbook bullish chart pattern, and exchange supply absorption creates a high-probability setup for a sustained XRP rally. The $1.55 neckline represents the linchpin: a confirmed daily close above this level would validate the inverse head and shoulders formation and technically project a measured move toward the psychological $2.00 threshold. For market participants, the critical variable is whether the current 96-hour momentum can be sustained through the resistance test. The behavior of whale addresses—specifically whether they continue withdrawing to cold storage rather than redistributing to exchanges—will serve as the most reliable on-chain confirmation of trend durability. With Ripple’s ongoing legal clarity and expanding institutional partnerships providing fundamental tailwinds, a breakout could attract substantial follow-through from both algorithmic and discretionary capital.

    Frequently Asked Questions

    What is the significance of the 9.81 billion XRP whale holding figure?

    This figure, sourced from Santiment data via analyst Ali Martinez, represents the combined XRP balance across all identified whale addresses. The rapid increase from a prolonged plateau to this peak level in just days indicates coordinated, high-conviction accumulation by the largest non-exchange entities on the network.

    Why are XRP inflows to Binance not causing price declines?

    Typically, large exchange deposits signal intent to sell. In this case, on-chain data shows the deposited tokens are being rapidly purchased and withdrawn to cold wallets. This absorption indicates demand exceeds the new supply, neutralizing selling pressure and suggesting accumulation rather than distribution.

    What confirms the inverse head and shoulders pattern?

    The pattern requires a confirmed daily candle close above the $1.55 neckline resistance. Until that occurs, the formation remains incomplete and subject to failure. A successful breakout would technically target the $2.00 level based on the pattern’s measured move projection.

  • Altcoins Surge Again, but a Key Metric Indicates Altseason Is Still Absent

    Altcoins Surge Again, but a Key Metric Indicates Altseason Is Still Absent

    Key Highlights

    • Altcoin market capitalization surged to $222 billion for the first time in eight months, yet futures leverage remains well below historical risk thresholds.
    • Major assets remain far from all-time highs: Bitcoin down 36%, Ethereum down 47%, Solana down 61%, and the broad altcoin market cap down 54%.
    • The Altcoin Season Index sits at 54—firmly between Bitcoin Season and Altcoin Season—and has repeatedly failed to sustain the 75+ level required for a confirmed altseason.

    Altcoin Market Cap Surges to $222 Billion but Leverage Remains Subdued

    The broader cryptocurrency market rally has lifted the altcoin complex, pushing total altcoin market capitalization to $222 billion—a level not seen in eight months. Despite this notable expansion, on-chain and derivatives data suggest the advance lacks the speculative intensity that historically precedes a full-blown altseason. According to Glassnode, altcoin leverage is still below the major risk threshold that typically signals overheated conditions. “Altcoin traders need to put in more work,” the data implies, as futures open interest for altcoins relative to Bitcoin (BTC) hovers around -10% to -15%, well beneath the red risk-threshold line near parity. Historically, spikes toward or above that parity line have coincided with stretched leverage and elevated liquidation risk. The current reading indicates the derivatives market remains relatively uncrowded, leaving room for additional speculative capital to flow in before leverage reaches historically dangerous levels.

    Distance from All-Time Highs and Bitcoin Dominance Shape Market Dynamics

    Contextualizing the rally requires examining the gap to previous peaks. Bitcoin continues to trade roughly 36% below its all-time high, while Ethereum (ETH) sits approximately 47% below its peak. Solana (SOL) remains about 61% off its high, and the aggregate altcoin market capitalization is still 54% below its former summit, per data from TradingView. At the same time, Bitcoin dominance held at a healthy 59.19% at press time, underscoring that the largest cryptocurrency still commands the majority of total crypto market capitalization. This dominance metric, combined with the deep drawdowns across major altcoins, suggests the current bounce is occurring within a broader structural downtrend rather than a fresh bull market expansion.

    Altcoin Season Index Stalls at 54, Failing to Confirm Broad Rotation

    The Altcoin Season Index, tracked by Coinglass, registered a reading of 54 at press time—squarely in the neutral zone between Bitcoin Season (below 25) and Altcoin Season (above 75). While the index has periodically climbed toward the 75+ threshold, it has consistently failed to sustain those levels. This pattern confirms that the market has not yet achieved the breadth or consistency required for a genuine altseason. A recent report by AMBCrypto reinforced this view, highlighting that although altcoins may finally be breaking out after nearly two years of stagnation, a broad, self-sustaining altcoin season has not yet arrived.

    Why This Matters

    The divergence between rising spot prices and subdued derivatives leverage presents a nuanced picture for market participants. On one hand, the low leverage ratio reduces the immediate risk of cascading liquidations that can abruptly end rallies. On the other, it signals a lack of conviction among speculative traders, who typically pile into futures during confirmed altseasons. The persistent Bitcoin dominance above 59% and the failure of the Altcoin Season Index to breach 75 suggest capital rotation remains tentative. For investors, this environment favors selectivity over broad beta exposure: assets with strong fundamentals, upcoming catalysts, or clear technical breakouts may outperform, while a indiscriminate “altcoin rally” remains contingent on a sustained shift in market structure—specifically, a decline in Bitcoin dominance toward the low-50s and a decisive close of the Altcoin Season Index above 75.

    Frequently Asked Questions

    What does the current altcoin futures open interest relative to Bitcoin indicate?

    The metric sits at -10% to -15%, below the parity risk threshold. This means altcoin derivatives positioning is not yet stretched, implying there is capacity for further speculative inflows before leverage reaches historically elevated, high-risk levels.

    Why hasn’t an altcoin season been confirmed despite the market cap recovery?

    The Altcoin Season Index at 54 has repeatedly failed to hold above 75, Bitcoin dominance remains high at 59.19%, and major altcoins are still 47–61% below their all-time highs. These factors indicate insufficient breadth and momentum for a broad-based altseason.

    How far are major cryptocurrencies from their all-time highs?

    As of the latest data: Bitcoin is ~36% below its ATH, Ethereum ~47%, Solana ~61%, and the total altcoin market cap ~54% below its peak.

  • Tom Lee Identifies Key Signs of Crypto Winter Dynamics

    Tom Lee Identifies Key Signs of Crypto Winter Dynamics

    Key Highlights

    • BitMine Chairman Tom Lee identifies ‘rage quitting’ as a defining investor behavior during crypto winters, alongside sharp price declines and leverage liquidations.
    • Bitcoin is testing the pivotal $64,000–$65,000 resistance zone, with buyers struggling to overcome dominant selling pressure.
    • Lee’s cyclical framework suggests current skepticism and forced exits historically align with potential market bottoms, offering a roadmap for traders navigating volatility.

    Tom Lee Maps the Anatomy of a Crypto Winter

    During a recent interview with Wealthion, Tom Lee, Chairman of BitMine, laid out a framework for understanding the recurring phenomenon known as the crypto winter. Lee emphasized that these downturns are not random collapses but structured cycles characterized by three distinct features: steep price declines, widespread leverage liquidation, and a behavioral pattern he explicitly labels ‘rage quitting’ among investors. According to Lee, this capitulation event—where participants abandon positions in frustration—typically clusters near the bottom of the cycle, making it a critical signal for market observers rather than a reason for panic.

    Bitcoin Tests Critical $64K–$65K Battleground

    The theoretical framework meets real-time market action as Bitcoin contends with the $64,000 to $65,000 range, a level that has repeatedly acted as both support and resistance in recent sessions. Current order-flow data shows aggressive selling defending this ceiling, while buying attempts have so far lacked the volume to sustain a decisive breakout. Lee’s observation that ‘rage quitting’ intensifies as sentiment sours aligns with on-chain metrics showing a spike in realized losses and short-term holder exits. Traders interpreting this confluence of technical resistance and behavioral capitulation are weighing whether the zone represents a distribution top or the final shakeout before a new leg higher.

    Sentiment Signals and Historical Rhymes

    Lee’s analysis draws a direct line between public skepticism—often amplified by high-profile critics—and the psychological trough of the cycle. The current wave of cautious commentary from financial media and institutional voices mirrors patterns observed in prior bear markets, where maximum pessimism preceded sustained recoveries. By framing ‘rage quitting’ as a feature of the bottoming process rather than a bug, Lee reframes the narrative: the absence of retail euphoria and the prevalence of forced selling may, paradoxically, reduce the supply overhang required for the next uptrend.

    Why This Matters

    Understanding the cyclical mechanics of crypto winters is essential for risk management and position sizing in an asset class defined by boom-bust dynamics. Lee’s framework provides a mental model that separates structural market forces—leverage flushes, miner capitulation, holder base rotation—from emotional decision-making. For institutional allocators and active traders alike, recognizing that ‘rage quitting’ signals exhaustion of weak hands rather than fundamental failure can prevent premature exits at the point of maximum financial opportunity. As Bitcoin’s price action hinges on the $64K–$65K pivot, the interplay between technical structure and behavioral extremes will likely dictate the near-term trajectory for the broader digital asset complex.

    Frequently Asked Questions

    What does Tom Lee mean by ‘rage quitting’ in crypto markets?

    ‘Rage quitting’ refers to the phenomenon where investors, frustrated by sustained losses and volatility, abruptly exit their positions near the bottom of a market cycle. Lee identifies this as a behavioral hallmark of crypto winters that historically coincides with maximum pessimism and the exhaustion of selling pressure.

    Why is the $64,000–$65,000 range so critical for Bitcoin right now?

    This price zone has acted as a key pivot point in recent trading, representing a confluence of technical resistance, psychological round numbers, and options market open interest. A decisive break above could signal renewed bullish momentum, while failure may invite a deeper correction toward lower support levels.

    How can traders use Lee’s crypto winter framework practically?

    Traders can monitor on-chain metrics such as realized loss spikes, short-term holder MVRV ratios, and funding rates to quantify ‘rage quitting’ intensity. When these indicators peak alongside extreme negative sentiment and price testing of major support, the framework suggests elevated probability of a cyclical bottom forming.

  • Hong Kong Bank Manager Jailed Four Years for $470K USDT Bribery Scheme

    Hong Kong Bank Manager Jailed Four Years for $470K USDT Bribery Scheme

    Key Highlights

    • Former CCB (Asia) relationship manager Lam Chun-yin sentenced to four years in prison for accepting over US$470,000 in Tether (USDT) bribes to authenticate fraudulent standby letters of credit.
    • District Court Judge Ernest Lin Kam-hung cited damage to Hong Kong’s reputation as an international financial center as an aggravating factor, adopting a six-year starting point reduced by one-third for the guilty plea.
    • ICAC has applied for arrest warrants for additional suspects, signaling an ongoing investigation into a scheme that used cryptocurrency to conceal corrupt payments.

    Former Bank Manager Jailed in Landmark Crypto Bribery Case

    A former relationship manager at China Construction Bank (Asia) has been sentenced to four years in prison after pleading guilty to accepting more than US$470,000 in Tether (USDT) bribes to authenticate fraudulent bank documents, the Hong Kong Independent Commission Against Corruption (ICAC) announced in a September 18 press release. The case marks a significant enforcement milestone in the territory’s efforts to combat corruption facilitated by digital assets.

    Scheme Involved Fraudulent Standby Letters of Credit

    Lam Chun-yin, 32, served in the Consumer Banking Division at CCB (Asia)’s Causeway Bay retail branch. His duties covered retail banking services and did not include processing applications for business credit facilities. According to the ICAC, Lam conspired with an employee of a fintech company and other associates to receive Tether worth more than US$470,000 (approximately HK$3.7 million) in exchange for illegally authenticating multiple false standby letters of credit. Those instruments were subsequently used as guarantees for insurance-related investment transactions without the bank’s authorization.

    Court Emphasizes Systemic Risk and Reputational Harm

    At the District Court, Judge Ernest Lin Kam-hung determined that the criminality in this case exceeded that of comparable offenses because the forged documents undermined Hong Kong’s standing as an international financial center and exposed the bank to significant potential risk. The judge adopted a six-year starting point for sentencing and reduced it by one-third in recognition of Lam’s guilty plea, resulting in the four-year custodial term. The court also ordered restitution of approximately HK$3.7 million to CCB (Asia), matching the value of the bribes received.

    Cryptocurrency Used to Obscure Corrupt Payments

    An ICAC spokesperson noted that the commission successfully uncovered the scheme despite attempts by those involved to conceal corrupt activities by using cryptocurrency to channel bribe payments indirectly. The agency has also applied to the court for arrest warrants for other individuals implicated in the case, signaling that the investigation remains active beyond Lam’s conviction. CCB (Asia) is the Hong Kong subsidiary of China Construction Bank Corporation.

    Why This Matters

    The sentencing adds to a growing list of enforcement actions globally that involve digital-asset payments in corruption cases, including a South Korean exchange employee jailed for Bitcoin bribery and a cross-border crypto money laundering bust involving arrests in the United Arab Emirates and Sweden. Authorities in Hong Kong have made clear that moving bribes through stablecoins such as USDT does not shield the underlying transactions from scrutiny. The case underscores the increasing sophistication of anti-corruption agencies in tracing blockchain-based illicit flows and serves as a warning to financial sector professionals that misuse of position for crypto-denominated kickbacks carries severe penalties.

    Frequently Asked Questions

    What specific charges did Lam Chun-yin face?

    Lam pleaded guilty to one count of conspiracy for an agent to accept advantages under section 9(1)(a) of the Prevention of Bribery Ordinance and section 159A of the Crimes Ordinance.

    How were the fraudulent documents used?

    The false standby letters of credit authenticated by Lam were used as guarantees for insurance-related investment transactions without the bank’s authorization.

    Is the investigation closed following Lam’s sentencing?

    No. The ICAC has applied for arrest warrants for other individuals implicated in the case, indicating the investigation remains open.

  • Bitcoin Bull Run Revives as Price Jumps 8%

    Bitcoin Bull Run Revives as Price Jumps 8%

    Key Highlights

    • Bitcoin rallies 8.10% from Wednesday’s low of $75,064, reclaiming the 365-day moving average at $80,701 for the first time since November 2025.
    • Long-term holder supply hits a record accumulation phase since February while short-term holder supply declines, signaling strengthening conviction among strong hands.
    • Despite technical resilience, analysts warn of subdued trading activity versus prior bull markets and potential headwinds from upcoming rate hikes and a rising U.S. Dollar Index.

    Bitcoin’s Technical Breakthrough Above Yearly Moving Average

    Bitcoin ($BTC) has staged a significant recovery, surging 8.10% from Wednesday’s low of $75,064 to trade back above its 365-day moving average, currently situated at $80,701. This marks the first time since November 2025 that the asset has sustained positioning above this critical long-term trend indicator. The bounce follows a pullback from the $82,000 level earlier in September, a decline the market appears to have attributed to the Federal Reserve’s decision to raise interest rates by 25 basis points. The speed of the recovery suggests the prior dip represented a pricing-in of hawkish monetary policy expectations rather than a fundamental shift in demand.

    Macro Headwinds Fail to Derail Recovery

    The ascent occurs against a backdrop of considerable macroeconomic adversity. The CLARITY Act failed to pass in the Senate, liquidity conditions are tightening due to persistent inflation, and a series of rate hikes is projected for 2027. Compounding the pressure, the Bank of Japan has also moved to raise interest rates. According to crypto researcher Bull Theory on X, this resilience—absorbing multiple bearish catalysts while pushing higher—is “reminiscent of the 2023 market bottom.” The ability to reclaim the yearly moving average amid such conditions is being interpreted by bulls as a major victory, signaling underlying structural strength rather than speculative froth.

    On-Chain Data Reveals Shifting Holder Dynamics

    Supporting the bullish technical structure, on-chain analytics from CryptoQuant reveal a profound shift in investor behavior. Since February, the total supply held by long-term holders (LTHs) has trended steadily higher, while the supply held by short-term holders (STHs)—defined as coins with an age of 155 days or under—has been in consistent decline. Crypto analyst Funding Vest noted on CryptoQuant, “It was a record phase of accumulation.” This dynamic indicates that weak hands are being shaken out of the market while higher-conviction participants accumulate aggressively. Analysts suggest this supply constriction could act as a catalyst for a supply shock if prices continue to appreciate.

    Analyst Perspectives: Bullish Parallels and Cautionary Signals

    However, the picture is not uniformly optimistic. Analyst Joao Wedson highlighted on X that trading activity remains subdued compared to previous bull market peaks, potentially evidencing weaker retail participation. Wedson cautioned, “Right now, Bitcoin is still in the process of breaking its bearish trend. It might not even have fully transitioned into a bull run.” The looming prospect of further rate hikes and a strengthening U.S. Dollar Index (DXY) presents tangible risks for risk-on assets, suggesting the path forward may be volatile despite the current technical victory.

    Why This Matters

    The reconquest of the 365-day moving average is a widely watched milestone that often signals a transition from bearish to bullish market structure. The convergence of this technical signal with a historic accumulation trend among long-term holders suggests the current rally is backed by fundamental conviction rather than leverage-driven speculation. However, the macroeconomic overhang—specifically the trajectory of global interest rates and dollar strength—remains the primary variable. If central banks maintain a hawkish stance, the liquidity required to sustain a full-blown bull run may be constrained, potentially trapping the market in a prolonged consolidation or “chop” phase. The divergence between smart money accumulation and retail apathy is a classic late-bear/early-bull signature that warrants close monitoring of volume metrics in the coming weeks.

    Frequently Asked Questions

    Has Bitcoin confirmed a new bull market?

    Not definitively. While reclaiming the 365-day moving average is a necessary condition for a bull market, analysts like Joao Wedson caution that Bitcoin is still “in the process of breaking its bearish trend” and may not have fully transitioned. Sustained volume expansion and higher highs are required for confirmation.

    What does the long-term holder accumulation trend indicate?

    Data from CryptoQuant shows a record accumulation phase since February, with LTH supply rising and STH supply falling. This signals that experienced, high-conviction investors are absorbing supply from weaker participants, a dynamic that historically precedes supply-constrained price appreciation.

    What are the main risks to Bitcoin’s current rally?

    The primary risks are macroeconomic: a projected series of Federal Reserve rate hikes in 2027, ongoing quantitative tightening, Bank of Japan policy normalization, and a rising U.S. Dollar Index. Additionally, subdued retail trading volume suggests the rally lacks broad-based participation, making it vulnerable to sudden sentiment shifts.

  • $1.5T and Counting: 2026 ETF Inflows Surpass 2025’s Record

    $1.5T and Counting: 2026 ETF Inflows Surpass 2025’s Record

    Key Highlights

    • Bitcoin ETFs dominated 24-hour inflows with $433.03 million, leading a broad-based rally that saw Ethereum attract $143.80 million and Solana draw $47.62 million, per SoSo Value data.
    • Grayscale’s newly launched Spot Zcash ($ZEC) ETF recorded $37.67 million in inflows within its first month, outperforming many established altcoin ETF products.
    • Bloomberg’s Eric Balchunas noted global ETFs have already surpassed 2025’s full-year record of $1.5 trillion in flows with 3.5 months remaining, while Coinbase Derivatives filed with the CFTC to launch cash-settled perpetual futures on U.S. stocks and ETFs.

    Broad-Based Crypto ETF Inflows Signal Renewed Investor Appetite

    The cryptocurrency exchange-traded fund landscape experienced a decisive shift in momentum over the past 24 hours, with net inflows turning positive across nearly every major digital asset category. According to data compiled by SoSo Value, Bitcoin [BTC] products commanded the lion’s share of fresh capital, absorbing $433.03 million in net subscriptions. Ethereum [ETH] followed at a considerable distance with $143.80 million, while Solana [SOL] continued its institutional adoption trajectory with $47.62 million in new allocations.

    Grayscale’s Zcash ETF Defies Altcoin Skepticism

    Perhaps the most striking data point emerged from Grayscale Investments’ recently launched Spot Zcash ($ZEC) ETF. Despite being on the market for less than a month, the fund has already accumulated $37.67 million in net inflows—a figure that exceeds the early traction of numerous longer-standing altcoin ETFs. Smaller but notable inflows were also recorded for Hyperliquid [HYPE] at $1.03 million and Chainlink [LINK] at $2.19 million. XRP [$XRP] stood alone on the negative side of the ledger, registering modest outflows of approximately $43,700, suggesting lingering hesitation among investors toward the token’s ETF prospects.

    Balchunas: ETF Industry Rewriting Flow Records at Historic Pace

    The surge in crypto fund flows mirrors a broader structural expansion across the entire ETF ecosystem. Bloomberg Senior ETF Analyst Eric Balchunas highlighted the milestone on X, stating:

    ETFs have now surpassed last year’s record flows of $1.5T with 3.5mo to spare.

    Balchunas provided critical historical context, noting that roughly two decades ago—when he began covering the industry—$100 billion in annual flows was considered a banner year. Today, the global ETF complex is attracting more than $100 billion every month, translating to roughly $8.5 billion per trading day. This acceleration has occurred despite what Balchunas characterized as a challenging 2026 for cryptocurrency markets, which have contended with Middle Eastern geopolitical tensions, rising oil prices, Federal Reserve rate hikes, and the legislative setback of the CLARITY Act. The analyst emphasized that even after a strong August rally gave way to September selling pressure, the downturn proved temporary, with flows rapidly reasserting their upward trajectory.

    Coinbase Derivatives Pushes Into Equity-Linked Perpetual Futures

    Balchunas’s commentary arrived alongside a significant regulatory filing from Coinbase Derivatives. The exchange has petitioned the U.S. Commodity Futures Trading Commission (CFTC) for approval to launch cash-settled perpetual futures contracts tied to individual U.S.-listed stocks and ETFs. If cleared, the product would enable eligible U.S. traders to obtain leveraged long or short exposure to single-name equities and exchange-traded funds without purchasing the underlying securities. These instruments would be structured as security futures products, placing them under the joint regulatory purview of the CFTC and the Securities and Exchange Commission (SEC). The move represents Coinbase’s most ambitious push yet to diversify its derivatives franchise beyond digital assets and establish a regulated U.S. venue for equity-linked perpetual contracts.

    Global Expansion Narrative Gains Momentum

    Optimism extends beyond U.S. borders. Japan-based DeFi asset manager xWin Finance projects that the country’s forthcoming Spot Bitcoin ETFs could attract up to $18.4 billion in assets, underscoring the global dimension of institutional crypto adoption. Combined with the Coinbase filing and record-breaking flow data, the developments suggest a maturing market infrastructure that is increasingly bridging traditional finance and digital asset ecosystems.

    Why This Matters

    The convergence of record-breaking global ETF flows, successful launches of niche crypto products like Grayscale’s Zcash ETF, and major exchanges like Coinbase seeking to replicate crypto’s perpetual futures model in equity markets signals a profound structural shift. For investors, the data confirms that institutional capital allocation to digital assets is deepening beyond Bitcoin and Ethereum into a wider spectrum of protocols. For regulators, the Coinbase filing tests the boundaries of security futures frameworks and could establish a precedent for crypto-native firms entering traditional derivatives markets. The resilience of flows amid macroeconomic headwinds—geopolitical instability, monetary tightening, and legislative uncertainty—suggests that crypto ETFs are evolving from speculative vehicles into permanent portfolio building blocks. Market participants should monitor the CFTC’s review of Coinbase’s application and the trajectory of Japan’s Spot Bitcoin ETF launch as key indicators of the next phase of institutional integration.

    Frequently Asked Questions

    Which crypto assets saw the largest ETF inflows in the latest 24-hour period?

    Bitcoin led with $433.03 million in net inflows, followed by Ethereum at $143.80 million and Solana at $47.62 million, according to SoSo Value data. Grayscale’s new Spot Zcash ETF also attracted a notable $37.67 million in its first month.

    What is the significance of Eric Balchunas’s comment about $1.5 trillion in ETF flows?

    Balchunas, a senior ETF analyst at Bloomberg, noted that global ETFs have already exceeded the full-year 2025 flow record of $1.5 trillion with 3.5 months remaining in 2026. He contrasted this with the industry standard of two decades ago, when $100 billion in annual flows was considered exceptional, versus the current pace of over $100 billion monthly.

    What would Coinbase Derivatives’ proposed perpetual futures on stocks and ETFs enable?

    If approved by the CFTC, the cash-settled perpetual futures would allow eligible U.S. traders to take leveraged long or short positions on individual U.S.-listed stocks and ETFs without owning the underlying shares. The contracts would be regulated as security futures products under joint CFTC and SEC oversight, expanding Coinbase’s derivatives offerings beyond cryptocurrency.

  • Coinbase Surpasses $1 Billion in DEX Trading Volume for Tokenized

    Coinbase Surpasses $1 Billion in DEX Trading Volume for Tokenized

    Key Highlights

    • Coinbase tokenized stocks surpassed $1 billion in decentralized exchange trading volume within their first month on the Base layer-2 network.
    • The milestone generates transaction fees for Base and creates future revenue pathways through securities lending and a share of DEX trading fees, according to Token Terminal.
    • Regulatory acceptance in the U.S. is enabling traditional equities to intersect with DeFi, offering enhanced liquidity and accessibility for retail and institutional investors.

    Coinbase Tokenized Stocks Hit $1 Billion DEX Volume Milestone on Base

    Coinbase has reached a significant milestone as its tokenized stock offerings surpassed $1 billion in decentralized exchange (DEX) trading volume during their inaugural month on the Base platform. The achievement marks a notable convergence of traditional equity markets with decentralized finance infrastructure, demonstrating tangible demand for on-chain representations of real-world assets. According to blockchain analytics commentator Token Terminal, this activity not only produces immediate transaction fee revenue for the Base network but also establishes a foundation for future income streams, including securities lending programs and a proportional share of ongoing DEX trading fees.

    Market Dynamics Drive Adoption of Tokenized Equities

    The surge in trading volume reflects a broader shift among market participants toward alternative investment vehicles within the cryptocurrency ecosystem. As traders navigate mixed signals across the wider digital asset market, the robust performance of Coinbase’s tokenized stocks has distinguished itself as a focal point for capital allocation. This movement suggests a growing appetite for products that bridge conventional financial instruments with the composability and settlement efficiency of blockchain rails. By offering tokenized versions of established equities, Coinbase is providing investors with enhanced liquidity profiles, fractional ownership capabilities, and 24/7 market access—features that address longstanding limitations of traditional securities infrastructure.

    Regulatory Tailwinds Support Product Expansion

    Coinbase, recognized as a leading United States-based cryptocurrency exchange providing trading, staking, and now tokenized asset services, operates within a regulatory environment that has progressively signaled greater openness to tokenized securities. This evolving framework has created a strategic window for the company to introduce innovative products that cater to a diverse investor base spanning retail participants and institutional allocators. The compliance-forward approach positions Coinbase to capitalize on rising demand for regulated digital asset exposure while mitigating jurisdictional uncertainty that has constrained similar initiatives in prior market cycles.

    Why This Matters: The Convergence of TradFi and DeFi

    The $1 billion volume milestone represents more than a single product success—it signals a structural inflection point in how traditional financial assets are distributed, traded, and settled. Tokenized stocks on Base exemplify the practical application of blockchain technology to solve real-world market structure inefficiencies, including T+2 settlement delays, limited after-hours liquidity, and high barriers to fractional investing. For Base, the fee revenue and potential securities lending yield create a sustainable economic model that incentivizes further asset onboarding. For the broader industry, Coinbase’s execution validates the thesis that regulated entities can successfully deploy DeFi primitives for mainstream financial products, potentially accelerating adoption by asset managers, broker-dealers, and custody providers who have awaited proof of concept at scale.

    Frequently Asked Questions

    What are Coinbase tokenized stocks and how do they work on Base?

    Coinbase tokenized stocks are blockchain-based representations of traditional equity shares, issued and backed 1:1 by the underlying securities held in custody. On Base, Coinbase’s Ethereum layer-2 network, these tokens can be traded on decentralized exchanges with near-instant settlement, fractional denominations, and continuous market hours, while maintaining regulatory compliance through Coinbase’s licensed framework.

    What revenue opportunities does this create for the Base ecosystem?

    Beyond immediate transaction fees generated from DEX trading activity, Token Terminal notes that the protocol can derive ongoing revenue from securities lending programs—where tokenized shares are lent to market makers or short sellers—and from a share of DEX trading fees captured through Base’s sequencer and fee-switch mechanisms.

    What should traders monitor going forward?

    Market participants should track sustained trading volume trends, user engagement metrics on Base, the rollout of securities lending functionality, and any regulatory developments from the SEC or CFTC that could affect the issuance, trading, or custody of tokenized securities in the United States.