Category: Coins

Digital assets, cryptocurrencies, blockchain, and currency news.

  • Bitcoin Price Falls After Warsh’s Hawkish Jackson Hole Keynote

    Bitcoin Price Falls After Warsh’s Hawkish Jackson Hole Keynote

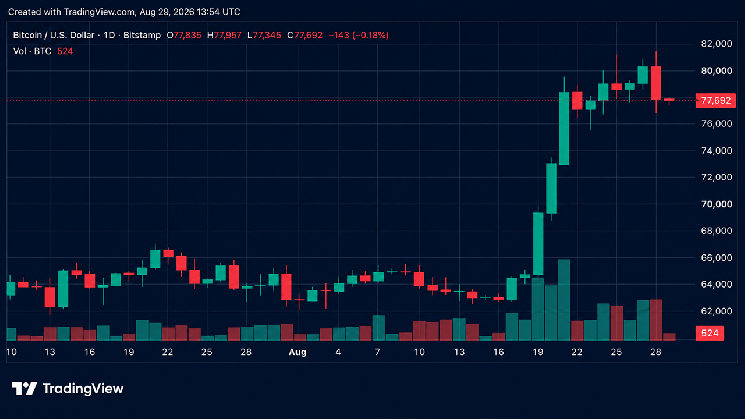
    Bitcoin has pulled back from its weekly high of $81,455, but its August gains remain substantial. As of Aug. 29, 2026, at 8:30 a.m., bitcoin was trading at approximately $77,588 to $77,984 per coin. The leading cryptocurrency had declined about 2% to 2.5% over the previous 24 hours, while still gaining 23.2% against the U.S. dollar since Aug. 15.

    Bitcoin’s initial rally followed the Treasury’s mid-August announcement about expanding bond buybacks. During the same week, U.S. President Donald Trump met with several cryptocurrency industry executives and made positive comments about the sector. He discussed bringing Hyperliquid to the United States and remained open to acquiring substantial amounts of $BTC after receiving advice from members of his administration.

    Those developments helped drive demand for spot bitcoin exchange-traded funds (ETFs), which recorded nine consecutive days of inflows. The streak ended Friday, when spot bitcoin ETFs posted their first day of outflows, with approximately $202 million leaving the funds.

    Sticky Inflation Meets Positive Crypto News

    Several developments put pressure on bitcoin toward the end of the week. U.S. inflation remained persistent, with the personal consumption expenditures (PCE) price index rising in July. Bitcoin initially absorbed the news and recovered from a modest decline before reaching its weekly high of $81,455.

    Additional positive developments supported the market, including a proposed draft to rewrite U.S. Securities and Exchange Commission (SEC) custody rules and Charles Schwab’s expansion of its digital asset offerings.

    Hawkish Jackson Hole Speech Pressures Bitcoin

    Market sentiment shifted during the Jackson Hole Economic Policy Symposium, where Federal Reserve Chair Kevin Warsh delivered his first speech at the annual event. Speaking at 10 a.m. EDT on Friday, Warsh addressed the symposium’s theme, “Financial Innovation: Implications for Payments and Policy.”

    The keynote was viewed as hawkish. Warsh said the U.S. central bank has “work to do” and argued that specific financial conditions remain difficult. He also said forward guidance had “overstayed its welcome.”

    Following the speech, the probability of a rate hike rose immediately from 35% to the mid-50% range. Treasury yields increased, while precious metals such as gold posted modest declines.

    Before Warsh’s keynote, bitcoin was trading sideways near $79,500. After the speech, its price briefly fell below $77,000 before buyers absorbed the intraday selling pressure. The move also coincided with the first day spot bitcoin ETFs recorded outflows after their extended inflow streak.

    Despite the break in consecutive inflow days, August remains a strong month for spot bitcoin ETF demand, with approximately $3.1 billion to $3.3 billion entering the funds.

    Bitcoin Tests $77,000 Support as Technical Indicators Signal Overheating

    Bitcoin’s immediate resistance this weekend is positioned between $79,500 and $80,300, a range the cryptocurrency lost following the Federal Reserve chair’s speech. Resistance becomes stronger at higher price levels.

    Support is currently holding near the $76,800 to $77,000 zone. Bitcoin’s 24-hour trading volume was approximately $28.731 billion. Technical indicators suggest momentum had already become stretched before the keynote. The daily relative strength index (RSI) was at 70, while the Stochastic indicator was higher at 85, indicating overbought conditions.

    Although the RSI is neutral and the Stochastic indicator points to overheating, the moving average convergence divergence (MACD) remains positive. Taken together, the oscillators and moving averages suggest bullish momentum is still intact despite bitcoin’s latest decline—at least for now.

  • 145 Billion SHIB Ready for Sale as Shiba Inu Netflow Turns Bearish

    145 Billion SHIB Ready for Sale as Shiba Inu Netflow Turns Bearish

    Shiba Inu Risks Falling Below the $0.000005 Price Level as Selling Pressure Builds

    Shiba Inu may be on track to lose the key $0.000005 price level as demand appears to weaken and exchange activity points to rising selling pressure.

    Recent data from crypto analytics platform CryptoQuant shows that Shiba Inu’s exchange activity is no longer signaling bullish momentum. The token’s exchange netflow has shifted, suggesting that more SHIB is moving onto exchanges than is being withdrawn.

    Shiba Inu Traders Begin Selling

    The data indicates that Shiba Inu traders may be selling part of their holdings to protect against potential losses after the recent price breakout helped them recover.

    According to the data, Shiba Inu’s exchange netflow had reached approximately 145,906,600,000 SHIB as of Saturday, August 29.

    Although this represents a bearish signal for the broader Shiba Inu ecosystem, it also shows that the volume of tokens transferred to exchanges for potential selling exceeds the volume moved out of exchanges by more than 145 billion SHIB.

    This suggests that momentum is fading, with traders showing less willingness to hold or accumulate additional tokens amid speculation that the coming month could be bearish.

    Shiba Inu Price Falls 4%

    As bearish momentum begins to affect the Shiba Inu ecosystem, SHIB has continued to post mixed price action in recent days.

    Shiba Inu has recently turned lower, increasing the risk of a move back below the key $0.000005 level. The token has recorded daily declines of approximately 3% in recent sessions.

  • Expert Identifies Key XRP Price Levels to Watch

    Expert Identifies Key XRP Price Levels to Watch

    XRP is approaching a critical technical juncture after entering a 20% correction from its recent local high. On-chain data points to several key support and resistance levels that could determine the cryptocurrency’s next move.

    XRP support zone near $1.35

    According to market analyst Ali Martinez in an August 29 X post, XRP rallied 71.8% from $0.988 to $1.698 before pulling back to test a major demand zone between $1.35 and $1.38.

    Glassnode’s UTXO Realized Price Distribution (URPD) data shows that approximately 3.2 billion XRP were previously traded within this range, making it one of the asset’s most significant support areas.

    The concentration of trading activity suggests that many holders accumulated XRP in this zone, potentially creating strong buying interest if the cryptocurrency remains above the support region.

    Key XRP resistance levels

    The URPD data also identifies several major resistance levels above the current price. The first notable barrier is at $1.60, where approximately 1.99 billion XRP were traded.

    XRP price analysis chart. Source: Glassnode

    Another resistance level is located at $1.68, supported by about 1.98 billion XRP in historical trading volume.

    The most significant resistance appears at $1.86, where approximately 3.47 billion XRP previously changed hands. This represents the largest concentration of trading activity above the current support zone and could become a major hurdle for bulls attempting to regain momentum.

    If XRP successfully defends the $1.35-$1.38 support region and reclaims the higher resistance levels, a move above $1.86 could open the door to further gains. Beyond that level, Martinez identified $2.19 as the next major target, where another 3.12 billion XRP were traded, according to URPD data.

    XRP price outlook

    A sustained breakout above $1.86 would indicate that buyers had absorbed a significant amount of overhead supply, increasing the likelihood of a rally toward the $2.19 area.

    At press time, XRP was trading at $1.39, down nearly 6% over the past week.

    XRP seven-day price chart. Source: Finbold

    Despite the recent correction, XRP remains technically bullish, trading above its 50-day simple moving average (SMA) at $1.13 and its 200-day SMA at $1.28. This positioning suggests that the broader uptrend remains intact, with both moving averages potentially acting as support during pullbacks.

    Meanwhile, the 14-day relative strength index (RSI) stood at 64.75, just below the overbought threshold of 70. The reading points to strong buying momentum while suggesting that XRP may be approaching a zone where short-term upside could become more limited if buying pressure accelerates further.

    Featured image via Shutterstock

  • Zcash Developer Zakura Launches “Common” as ZEC Price Rises 5%

    Zcash Developer Zakura Launches “Common” as ZEC Price Rises 5%

    Zcash developer Zakura has released Common, a new suite of cryptography and protocol libraries designed to improve performance across Zcash wallets and full nodes.

    The release delivers major gains in proof generation, hashing, trial decryption and verification. Proof generation is now more than 14 times faster on mobile devices and over five times faster on desktop.

    Introducing Zakura Common.We just shipped 14x faster proving, 21x faster hashing, 1.5x faster trial decryption, and 4-8x faster verification.New releases of Zakura and wallets that use Zakura Common (such as @vizorwallet) will benefit immediately.https://t.co/WE2zfLLJ9S
    — Zakura (@ZakuraZcash) August 29, 2026

    The performance improvements have also attracted attention from crypto industry figures. Helius CEO Mert described the release as an “insane engineering feat,” highlighting the 14x reduction in latency delivered in a single release.

    Beyond proof generation, Sinsemilla hashing is now more than 21 times faster, while trial decryption has improved by over 1.5 times. zk-SNARK verification is also four to eight times faster.

    Faster Zcash Wallets and Full Nodes

    The new libraries are designed to improve the experience for both Zcash wallets and full nodes. Zakura said users can sometimes wait more than three seconds for a wallet to create a transaction. With Common, that time could fall below 200 milliseconds in many cases.

    Wallets that adopt the libraries should also synchronize faster. Zakura full nodes can benefit from faster transaction propagation and fewer orphaned blocks.

    Zcash co-founder Sean Bowe said the release delivers significant performance improvements across the network.

    “Shielded wallets that use Zakura Common, and full nodes like Zakura itself, all benefit from these massive performance improvements.”

    Zakura Common Requires No Zcash Network Upgrade

    A key feature of Zakura Common is that it does not require a Zcash network upgrade. The libraries are open source, allowing developers to include them in new versions of Zakura and compatible wallets.

    This approach enables the performance improvements to reach users without changing Zcash’s underlying network rules.

    ZEC Price Climbs 5%

    The release comes as Zcash is experiencing strong market activity. The native $ZEC token recently moved above $800 for the first time since January 2018.

    $ZEC is trading around $838.38 after rising 5%, while an earlier update placed the token at $838.60.

  • Metaplanet Sells Bitcoin in Latest $237 Million Transaction

    Metaplanet Sells Bitcoin in Latest $237 Million Transaction

    Metaplanet Transfers $237 Million in Bitcoin to Coinbase Prime, Raising Sell-Off Concerns

    Japan-based Bitcoin treasury firm Metaplanet has transferred approximately $237 million worth of Bitcoin to Coinbase Prime, prompting speculation that the company may be preparing to sell part of its holdings as the broader cryptocurrency market slows.

    Metaplanet Moves Bitcoin to Coinbase Prime

    According to the latest data shared today, Metaplanet sent the large Bitcoin deposit to Coinbase Prime, the leading U.S. cryptocurrency exchange’s institutional trading platform.

    The transaction has drawn attention from market participants because it comes as Bitcoin’s recent rally loses momentum. While Metaplanet is known for making regular Bitcoin purchases, the size and timing of this transfer have raised questions about whether the firm is becoming more cautious.

    Metaplanet has not specified the reason for the transfer. However, some market participants believe the move could represent an attempt to sell a portion of the company’s Bitcoin holdings.

    Transfers to cryptocurrency platforms such as Coinbase Prime do not necessarily indicate that Bitcoin has been sold. The assets could also be moved for custody, trading, or other operational purposes. Nevertheless, the scale of the transaction has fueled speculation about a potentially bearish move by Metaplanet.

    Is Metaplanet Taking Bitcoin Profits?

    The Bitcoin transfer comes as investors have started trading more cautiously, with some market participants selling assets to lock in gains from the recent price rally.

    Bitcoin has since pulled back from its upward trend and is trading in negative territory. The decline, combined with increased profit-taking activity, has led to speculation that Metaplanet may have moved the assets to secure profits.

  • RWA Market Growth Puts LINK, XLM, and ONDO in Focus

    RWA Market Growth Puts LINK, XLM, and ONDO in Focus

    The real-world asset (RWA) market is becoming increasingly difficult to ignore. Excluding stablecoins, tokenized real-world assets have grown 18.1 times in three years to $44.6 million, with institutional demand for yield-bearing products driving much of that expansion.

    Three tokens closely linked to the RWA infrastructure—$LINK, $XLM and $ONDO—are now approaching technically important price levels that could shape their next major moves.

    RWA Market Growth Is Driving New Demand

    Tokenized U.S. Treasury bills lead the market at $15.1 billion, followed by active yield strategies at $8.9 billion and private credit funds at $6.4 billion. However, the growth of tokenized assets is not simply a competition between blockchains offering the same function.

    Ethereum remains the dominant Layer 1 settlement network, accounting for roughly one-third of the tokenized asset market. Stellar and Avalanche have also become important issuance rails for institutional funds.

    The specialized protocols supporting this market are particularly important. Ondo Finance focuses on issuing and distributing yield-bearing traditional assets, including U.S. Treasuries, on-chain. Chainlink provides middleware through its oracle infrastructure and CCIP, including Proof of Reserves and connections between off-chain financial data and on-chain assets. Stellar offers a fast, cost-effective settlement environment and hosts financial products such as Franklin Templeton’s tokenized money market fund.

    $LINK Price Faces a Major Weekly Test

    $LINK has already bounced from an important demand area during August and is now approaching the 200-day exponential moving average (200-EMA) on the weekly chart near $13.83. This is the key resistance level bulls must overcome.

    A weekly breakout above that resistance could strengthen the case for a longer-term recovery and open the way toward higher price levels. Failure to break through, however, could send $LINK back toward lower support zones. The setup is promising, but the chart still needs confirmation rather than another speculative rally.

    $XLM Holds Support but Shows a Warning Signal

    $XLM is also showing a constructive setup after rising from a major ascending trendline that has previously triggered significant price moves. The token tested the 200-day EMA in August but has so far been rejected.

    If $XLM eventually flips that resistance on the weekly chart, $0.30 and $0.50 will become important levels to monitor. There is also a warning signal: a weekly death cross has formed between the 50-EMA and 200-EMA. If selling returns, a loss of the ascending trendline could expose $XLM to lower support levels.

    $ONDO Needs to Hold Its Long-Term Trend

    $ONDO may have the most fragile technical setup of the three tokens. Since early February, its weekly chart has maintained an ascending trendline following a major H2 2025 crash.

    That trendline is now critical. A breakdown could deepen the correction and potentially create a continuation pattern, with new all-time lows forming ahead. Conversely, $ONDO has not reclaimed its weekly 50-EMA since September 2025. If it finally does, $0.60 and $0.85 could become relevant recovery targets.

    The RWA market is expanding rapidly, but that growth does not automatically guarantee that token prices will follow. $LINK, $XLM and $ONDO are exposed to an expanding tokenization ecosystem; their charts now need to show that institutional growth can translate into sustained demand.

    Source: cryptonews.net

  • Will the Fed Raise Interest Rates in September? Latest Probability Figures Revealed

    Will the Fed Raise Interest Rates in September? Latest Probability Figures Revealed

    Expectations that the Federal Reserve could raise interest rates at its September meeting have increased sharply after cautious comments on inflation from Fed Chairman Kevin Warsh. The probability of a rate hike in forecasting markets has reached one of its highest levels in recent months, while U.S. Treasury yields have also risen significantly.

    Rate hike expectations shift ahead of September Fed meeting

    Market expectations are changing rapidly ahead of the Federal Reserve’s monetary policy meeting on September 16. Data from forecasting markets indicate that the probability of the Fed keeping interest rates unchanged is about 55%, while a 25-basis-point rate hike is priced at approximately 46%. The probability of a larger increase is estimated at only about 1%.

    CME Group’s FedWatch tool shows that investors have raised the probability of a rate hike at the September meeting to 55.7%, an increase of approximately 20 basis points in a single day.

    Warsh says inflation trend has not improved significantly

    Speaking at the Jackson Hole symposium in Wyoming, Federal Reserve Chairman Kevin Warsh said inflation remains elevated.

    Warsh acknowledged that inflation data released during the summer was more positive than expected but said it did not demonstrate a lasting improvement in underlying inflation trends.

    Warsh stated, “While inflation data released this summer was better than expected, it doesn’t indicate a significant improvement in underlying trends.”

    The Fed chairman added that policymakers must ensure inflation is moving clearly and quickly enough toward the level targeted by the central bank.

    Warsh indicated that the Fed could otherwise need to tighten monetary policy further, saying, “Otherwise, we have more work to do. This is our duty, our authority, and our responsibility.”

    However, Warsh did not provide direct guidance on how the Fed will act at upcoming meetings or offer a definitive framework for the economic data that will determine future interest rate decisions.

    U.S. Treasury yields rise after Warsh’s remarks

    Following Warsh’s speech, U.S. stock indexes rose, while selling pressure emerged in the bond market.

    The yield on the 2-year U.S. Treasury note, which is highly sensitive to expectations for Federal Reserve interest rate policy, climbed approximately 8 basis points to 4.31%. That was the highest level for the 2-year yield since the end of July.

    The increase in short-term Treasury yields suggests that investors increasingly expect the Fed to pursue tighter monetary policy in the coming period.

    With approximately two and a half weeks remaining before the September meeting, upcoming inflation and employment data are expected to be critical in determining the direction of interest rate expectations. If inflation remains stronger than expected, the likelihood of a rate hike will increase. A significant slowdown in price pressures, however, could reinforce expectations that the Fed will leave interest rates unchanged.

    This is not investment advice.

  • Venice Posts Record $1.1M Quarterly Earnings—Why Is VVV Down 13%?

    Venice Posts Record $1.1M Quarterly Earnings—Why Is VVV Down 13%?

    Venice Token ($VVV) fell 13% to $16.03 at press time, even as its protocol-level performance continued to improve.

    Data from DeFiLlama showed record quarterly earnings of $1.1 million, while monthly earnings also reached a record $654,000. The increase suggested that platform activity and usage had grown despite recent market turmoil.

    However, stronger protocol performance had not yet translated into price support for $VVV. The divergence raised questions about whether Venice Token was entering a bearish phase and which traders were driving the decline.

    Are derivatives traders pressuring $VVV?

    Venice Token’s perpetual market showed the clearest signs of weakening trader sentiment. The funding rate fell from 0.0141% on August 28 to 0.0001% at press time.

    The funding rate remained marginally positive, meaning the decline pointed to weakening demand from long traders rather than confirmed dominance by short sellers.

    CoinGlass data also showed that $VVV’s long/short ratio fell to 0.86. A reading below one indicates that short accounts outnumber long accounts in the measured market.

    Together, the funding rate and long/short ratio pointed to a weaker derivatives bias. Continued short positioning could keep pressure on the Venice Token price.

    Are spot traders buying Venice Token?

    In contrast, $VVV’s spot market netflow remained negative during recent sessions. Approximately $267,000 left centralized exchanges over a 12-hour period, while negative netflows had persisted for three days.

    These outflows could indicate that holders were withdrawing $VVV from exchanges, reducing the supply immediately available for selling. However, negative netflows alone cannot confirm fresh buying or long-term accumulation.

    Venice Token therefore faced a clear market split. Derivatives traders leaned bearish, while spot outflows suggested that exchange-held supply was tightening.

    If spot accumulation continues, $VVV could attempt a near-term recovery. Persistent derivatives pressure, however, could delay that move despite Venice Token’s record earnings.

    Venice Token market outlook

    Venice Token fell 13% to $16.03 despite recording $1.1 million in quarterly earnings. Its funding rate dropped sharply but remained marginally positive, signaling weaker long demand rather than confirmed short dominance.

    Source: cryptonews.net

  • SEC Reviews Automatic Filing Pathways After Surge in Exotic Crypto and Event-Linked ETF Proposals

    SEC Reviews Automatic Filing Pathways After Surge in Exotic Crypto and Event-Linked ETF Proposals

    Wall Street is pushing the exchange-traded fund format into nearly every corner of finance. Investors can now find ETFs offering Bitcoin exposure, two- or three-times the daily performance of a stock, private assets, and contracts linked to elections or economic data.

    The ETF began as a low-cost way to own a diversified market portfolio. It has since become a distribution system for investments that once required a futures account, private placement, crypto exchange, or careful review of a structured-note prospectus.

    The Securities and Exchange Commission is examining how far that system can expand. In a June 30 request for public comment, the agency identified crypto assets, commodities, leveraged products, single-stock ETFs, blockchain-based investments, private assets, and event contracts. Comments are due Aug. 31.

    The review extends beyond any individual application. The SEC is assessing whether its existing rules give staff sufficient time and authority to evaluate products whose economic behavior can differ substantially from the diversified funds investors traditionally associate with ETFs.

    According to the SEC’s concept release, assets in U.S. ETFs grew from more than $4 trillion at the end of 2019 to more than $12 trillion at the end of 2025. Over the same period, the number of products increased from nearly 1,900 to more than 4,600.

    The ETF ticker can hide the product’s real risks

    An ETF packages a portfolio into shares that trade throughout the day on an exchange. Investors can buy that exposure through the same brokerage account they use for ordinary stocks.

    Through the creation-and-redemption process, authorized participants exchange large blocks of ETF shares for the underlying basket or its cash equivalent. This mechanism helps keep the market price close to the portfolio’s net asset value.

    What began as operational infrastructure became a retail investing habit. ETFs offer intraday trading, transparent pricing, broad brokerage access and, in many structures, more favorable tax treatment than comparable mutual funds.

    Asset managers also gained products that could be placed in model portfolios and trading applications. Each successful launch encouraged sponsors to put increasingly specialized exposures behind the same familiar interface.

    The regulatory framework developed around the original ETF model. Early funds needed individual exemptive orders for features such as exchange trading and in-kind redemptions, which did not fit neatly within rules designed for open-end mutual funds.

    In 2019, the SEC adopted Rule 6c-11. The rule allows qualifying ETFs registered under the Investment Company Act of 1940 to operate without seeking a separate order for every launch, provided they satisfy conditions involving portfolio information, trading data and the arbitrage mechanism.

    Rule 6c-11 made ETF launches faster and more standardized, helping the product count more than double by the end of 2025. A plain index fund, a concentrated thematic portfolio and a derivatives strategy can now look nearly identical on a brokerage screen, even though their holdings, valuation methods and potential losses may be very different.

    The term ETF describes the container, not necessarily the investment inside it.

    The common brokerage screen also obscures important legal distinctions. Many stock and bond ETFs are registered investment companies under the 1940 Act, while spot Bitcoin and Ethereum products commonly use commodity-trust structures registered under the Securities Act of 1933.

    Exchange-traded notes represent another category. They are unsecured debt obligations whose returns depend on the issuer’s promise. Brokerage platforms may display all three structures side by side under a broad exchange-traded product label.

    Those legal categories affect custody, board oversight, diversification, borrowing, derivatives use, valuation and the remedies available if an issuer or service provider fails. A familiar ticker makes an exposure easier to buy, but it does not remove those underlying differences. That is why the SEC is examining the conditions attached to the ETF wrapper as closely as the portfolio itself.

    Crypto expanded the ETF model

    Spot crypto products became a turning point because investors viewed an exchange listing as a bridge between an unfamiliar asset and an established brokerage account.

    The SEC’s approval of spot Bitcoin products in 2024 gave advisers and institutions access to a regulated trading venue, standardized disclosures and conventional custody relationships. The agency emphasized that its approval was not an endorsement of Bitcoin itself.

    In practice, the distinction between legal approval and perceived legitimacy became harder to see as the ETF menu expanded.

    Many investors see an ETF ticker at a major broker and assume that the underlying exposure has passed through a common regulatory filter. Yet one product may hold a broad equity basket while another owns a volatile commodity or rolls derivatives that can diverge from a reference asset. Crypto demonstrated the commercial value of that familiarity.

    Sponsors have since applied the same distribution model to staking, options overlays, token products promising a multiple of an asset’s daily move and baskets of digital assets. Each structure may serve a specific investment purpose, while introducing its own custody, valuation, trading-hours and concentration risks.

    Crypto markets trade around the clock, but ETF shares trade during exchange hours. The creation process must bridge those different trading schedules when prices move sharply overnight or over a weekend.

    Event-contract funds push the ETF model into even less familiar territory. They tie returns to election results, economic releases or other defined events while packaging the exposure in shares that trade like ordinary funds.

    CryptoSlate identified more than two dozen event-linked ETF proposals, illustrating how quickly a niche contract market could reach retail brokerage accounts once an ETF provides the distribution channel.

    The regulatory challenge is based on how the product functions. An event contract may trade on an exchange overseen by the Commodity Futures Trading Commission, while the fund shares and related disclosures fall within the SEC’s jurisdiction.

    That can place the risks across several rulebooks. Regulators may need to examine how a contract settles, who provides prices, what happens when trading is halted and whether the fund can meet redemptions near the event date.

    Those questions apply differently across the categories covered by the SEC’s concept release. A private-asset fund may face stale valuations and limited exit opportunities. A single-stock leveraged product may reset daily and compound away from its stated multiple over longer periods. A token-based product may depend on custody or staking arrangements with no close equivalent in a traditional index fund.

    A product-by-product framework could attach conditions to each source of risk more precisely than a single definition of novelty.

    The SEC’s ETF approval process faces new pressures

    The SEC must also determine whether its filing process gives staff enough time to review unfamiliar structures before they reach the market.

    Certain registration statements and post-effective amendments can become effective automatically after a statutory or rule-based waiting period. Some amendments filed under Rule 485 can take effect immediately when they meet specified conditions.

    These pathways make routine fund updates and launches more efficient, but they can also carry portfolios that SEC staff have not previously encountered.

    SEC Chair Paul Atkins said in May that several sponsors had agreed to delay novel ETF launches, including event-contract products, while the agency evaluated the issues.

    A voluntary delay gives staff additional time to assess current filings. A lasting policy could require rule amendments, enhanced disclosure conditions, a separate review process or a clearer boundary around which products qualify for automatic treatment.

    Each option carries a cost. Broad restrictions could slow conventional fund launches and give established issuers an advantage over smaller sponsors. A narrow rule could leave staff racing against automatic deadlines whenever a new payoff structure emerges.

    The SEC must also protect the arbitrage mechanism that keeps ETF shares close to net asset value. Disclosure alone cannot solve problems created by assets that are too difficult to price or acquire during the creation-and-redemption process.

    Crypto issuers have a direct interest in the outcome, even as event contracts draw much of the attention. New staking structures, tokenized securities, multi-asset baskets and products offering daily return multiples could face additional filing requirements depending on how the SEC defines novelty and which safeguards it requires.

    A framework focused on custody, valuation, liquidity and payoff complexity could give sponsors a clearer path to market. A wrapper-level restriction, by contrast, could group economically different crypto products together.

    The SEC has already published public comment letters and meeting records ahead of the Aug. 31 deadline. After the comment period closes, the agency will need to evaluate the submissions, determine whether its existing authority and disclosure standards are sufficient, and publish any proposed rule amendments through the normal notice-and-comment process.

    Existing products and pending applications will continue to provide data on premiums, discounts, trading quality and investor use during that review.

    ETFs conquered Wall Street by making investment exposure easy to distribute. The wrapper has become financial infrastructure for nearly every kind of portfolio. A brokerage customer can move from an S&P 500 fund to Bitcoin, a two-times stock position or an election-linked contract with a few taps, even though each investment enters a different economic world.

    The SEC now has to decide which exposures require a different regulatory gate before a familiar ticker persuades investors that the existing gate has already done all the work.
  • Bitwise Moves $15.4 Million Worth of XRP Out of Circulation

    Bitwise Moves $15.4 Million Worth of XRP Out of Circulation

    Bitwise has extended its buying streak for XRP with a purchase worth $15.4 million, drawing attention as XRP’s recent rally loses momentum and the token returns to negative territory.

    Bitwise XRP purchase highlights institutional demand

    According to recent data highlighted by Whale Insider, the leading asset management firm has continued accumulating XRP despite mixed price action. The latest purchase comes after a recent breakout that increased confidence across the XRP ecosystem and supported stronger demand from retail and institutional investors.

    Momentum has also carried into the XRP exchange-traded fund (ETF) market, where all existing funds have recorded steady daily inflows over the past two weeks. This continued capital injection has coincided with growing institutional demand for Bitwise’s XRP product.

    Bitwise’s latest XRP purchase has drawn particular attention because it occurred as XRP reversed from its recent bullish performance and began trading lower. The buying activity suggests that some institutional investors remain interested in the asset despite its short-term weakness.

    XRP retreats to the $1.30 level

    Despite sustained institutional demand, XRP’s momentum appears to be fading. The cryptocurrency has paused its price rally and returned to red territory, with the latest on-chain data showing a retreat to around $1.30.

    XRP has declined by approximately 2% over the past 24 hours, indicating that speculative trading may currently be outweighing underlying demand. Even after slowing from its recent surge, however, XRP continues to post the strongest monthly price gain following several months of extreme volatility.