Author: Evan Mercer

  • CME Becomes Largest XRP Futures Venue as Open Interest Surges to 400 Million XRP

    CME Becomes Largest XRP Futures Venue as Open Interest Surges to 400 Million XRP

    CME Group has overtaken Binance as the largest venue for $XRP futures open interest by notional value, highlighting a shift toward regulated markets as professional trading activity increases.

    CME Leads the $XRP Futures Market

    CME’s $XRP futures open interest increased from 284 million $XRP on August 17 to 387 million $XRP on Aug. 31, a rise of approximately 36% in two weeks. During the same period, $XRP climbed from about $0.99 to $1.38, posting a gain of nearly 40%.

    CME moved ahead of Binance on Sept. 1 based on the notional value of $XRP futures open interest. Data from CoinGlass showed that CME held approximately 410,000 $XRP contracts worth about $530 million. Binance had roughly 375,000 contracts valued at approximately $510 million.

    CME now represents about 17% of total $XRP futures open interest, up from approximately 10% in mid-August. Its market share therefore increased by 7 percentage points in roughly two weeks.

    The shift is notable because it occurred alongside a nearly 40% increase in the price of $XRP, pointing to stronger participation from professional market participants.

    Total $XRP Futures Open Interest Falls

    Across all exchanges, however, the broader $XRP futures market moved in the opposite direction. Total futures open interest declined from approximately 2.77 billion $XRP to 2.34 billion $XRP between Aug. 17 and 31, representing a drop of about 16%.

    Exchanges outside CME accounted for most of the decline. Their combined futures positions fell by approximately 533 million $XRP, or 21%, during the same period. CME continued adding positions while traders on other platforms reduced their exposure.

    This created an unusual market pattern: $XRP rose nearly 40% even as total futures open interest dropped 16%. Strong rallies often coincide with rising open interest as traders establish leveraged positions. In this case, the market reduced its overall leveraged exposure while CME’s share continued to expand.

    The trend suggests that the recent $XRP rally may not have relied heavily on speculative leverage from offshore exchanges. Stronger spot demand and increased participation from professional traders may instead have played a larger role.

    $XRP ETF Inflows Strengthen Institutional Demand

    Recent $XRP ETF flows also point to growing institutional interest. U.S. spot $XRP ETFs recorded $110.49 million in net inflows during the week ending Aug. 28. It was their strongest weekly inflow of 2026 and lifted cumulative net inflows to approximately $1.66 billion.

    Goldman Sachs also returned to the $XRP ETF market during the second quarter. Its Q2 13F filings showed approximately $87.4 million in exposure across five spot $XRP ETFs, making Goldman the largest disclosed holder among the institutions mentioned. Jane Street and Millennium Management followed.

    Goldman had fully exited its $XRP ETF positions in the previous quarter before rebuilding exposure across five funds in Q2. Its return, together with rising CME futures activity, indicates that regulated investment products are becoming an increasingly important part of the $XRP market.

    Hedge Funds Hold Net Short Positions

    CFTC data through Aug. 25 shows that professional investors have not all adopted a bullish stance. Leveraged funds held 892 long contracts and 3,206 short contracts, leaving them with a net short position equivalent to approximately 116 million $XRP.

    The net short position increased from roughly 57 million $XRP the previous week. However, the data does not necessarily mean that hedge funds are simply betting against $XRP.

    Dealers and asset managers moved in the opposite direction. Dealers increased their net-long exposure by nearly 60 million $XRP, while asset managers added approximately 28 million $XRP in long exposure.

    Source: cryptonews.net

  • PONS Crypto Rises 46% as Market Cap Surpasses $300 Million—Is a $1 Billion Valuation Next?

    PONS Crypto Rises 46% as Market Cap Surpasses $300 Million—Is a $1 Billion Valuation Next?

    $PONS Price Rally Continues as Robinhood Chain Activity Surges

    $PONS debuted on Robinhood Chain after several launchpads became operational, but it has emerged as the leading platform by trading volume, revenue and price performance.

    The altcoin has reached new highs each day since August 23. $PONS gained 49% over the past 24 hours and 425% over the past seven days, while trading volume remained elevated at approximately $116 million.

    What Is Driving the $PONS Rally?

    Growing market reach is one of the main factors behind the token’s surge. $PONS has been listed on multiple decentralized and centralized exchanges. One day after its debut on Hyperliquid DEX, the token was listed on Bybit, where its perpetual contracts offer leverage of up to 20x.

    Analysis of activity on Robinhood shows that $PONS ranks among the platform’s top-trending products for both activity and sentiment. It accounts for 7% of Robinhood’s mindshare, behind Ethereum [ETH], Bitcoin [BTC] and Solana [SOL].

    According to KAITO AI, two-thirds of all tokens launched on Robinhood Chain went through $PONS. More than 517,000 tokens have been created, with combined trading volume exceeding $4 billion.

    Source: KAITO AI

    $PONS has also generated the highest fees of any launchpad on the chain, with daily revenue exceeding $500 million. The platform used 80% of those fees to buy back the token, tightening its supply.

    As the buyback and burning activity continued, nearly one-third of the token supply was permanently removed.

    Whale Holdings Support $PONS Momentum

    Capital inflows have remained strong even among whales who have already secured substantial gains. For example, a whale who purchased both $CASHCAT and $PONS continued to hold profits from the latter.

    After selling the entire $CASHCAT position and locking an initial $113,000 stake in $PONS, the whale still held 9.1 million $PONS tokens, representing $4.20 million in unrealized profits.

    Source: Lookonchain

    Bonk Guy, who bought 1% of the supply when the token had a $6 million market capitalization, is also still holding. The position generated $5 million in profits last week.

    Can $PONS Reach a $1 Billion Valuation?

    Continued interest from whales and key opinion leaders could help $PONS approach a $1 billion valuation. The token has posted new highs for 10 consecutive days, while its Bollinger Bands point to elevated volatility.

    The cumulative volume delta also confirms strong buying activity. More than 2.18 million $PONS tokens had been purchased at press time.

    Source: $PONS/USDT on TradingView

    However, the psychological $0.50 level could present a short-term challenge. If buyers push the token above that threshold, $PONS could open a path toward $1.

    Key Takeaways

    • $PONS gained 49% in 24 hours and reached a new peak near $0.49, while platform trading volume exceeded $4 billion.
    • The token has maintained a 10-day rally as bulls target a $1 billion valuation.
    • The $0.50 level could become a key test if buying momentum begins to weaken.
  • August Was Crypto’s Best Month—But These Bearish Signs You Probably Missed Could Signal Trouble

    August Was Crypto’s Best Month—But These Bearish Signs You Probably Missed Could Signal Trouble

    August was crypto’s strongest month of 2026 so far, but the rally may be less robust than price charts suggest. While Bitcoin and altcoins posted strong gains, profit-taking, leverage and weakening U.S. demand point to a fragile market recovery.

    Crypto market performance in August 2026

    Bitcoin ended August up 24.5%, marking one of its strongest monthly performances of the year. However, data from CryptoRank showed that the combined market capitalization of the top 100 altcoins grew even faster, rising 26.5%.

    The gains were also broad-based rather than concentrated among a handful of leading tokens. The average altcoin rose 24.5%, while the average gain remained a solid 17.1% after excluding outliers. This suggests that smaller and mid-sized cryptocurrencies participated in the rally instead of simply following Bitcoin’s lead.

    Source: CryptoRank/X

    DeFi lending activity also surged

    Decentralized finance lending recorded a significant increase during the period. Active loans across major DeFi protocols climbed from $20.1 billion in June to $26.1 billion in August, representing 30% growth in just two months.

    Aave [AAVE] accounted for more than half of the total, with $12.5 billion in active loans. Morpho [MORPHO] and Spark [SPK] held the next-largest shares.

    The increase indicates that capital is being deployed across DeFi, rather than the market’s gains being driven solely by speculative price momentum. Rising lending activity suggests broader participation across crypto markets.

    Profit-taking creates risks for the crypto rally

    Despite the strong performance, the rally showed signs of vulnerability. Bitcoin rose from approximately $63,000 to $81,500 in just two weeks, prompting many long-term holders to take profits.

    Profit-taking surged twice in a single week, producing some of the year’s heaviest sell-off days outside the January crash. Selling pressure has continued since then.

    Source: CryptoQuant

    U.S. demand also turned positive for several days near the end of August before quickly fading. At around the same time, funding rates reached a yearly high, indicating that traders were relying heavily on leverage.

    Source: CryptoQuant

    The combination of elevated leverage, sustained profit-taking and declining U.S. demand makes the broader crypto rally more fragile than its headline gains imply.

    August crypto market outlook

    Crypto recorded its best year-to-date month in August, with Bitcoin and altcoins both delivering substantial gains and DeFi lending activity accelerating. However, the rally’s underlying strength remains uncertain as investors take profits and U.S. demand weakens.

  • Rain Protocol’s SDK v2 Lowers the Barrier to Creating Prediction Markets

    Rain Protocol’s SDK v2 Lowers the Barrier to Creating Prediction Markets

    Anyone can debate with friends whether a candidate will win an election, a company will beat earnings expectations, or a celebrity couple will stay together. Building a functioning prediction market where participants can stake money on those outcomes is far more complex.

    Prediction markets require infrastructure for creating markets, matching trades, managing liquidity, settling positions, and determining what happens when an outcome is challenged. Until now, much of that work has been concentrated within a small group of platforms that operate the markets themselves. As prediction markets gain users and expand into new applications, attention is shifting from who can trade on these platforms to who can build them.

    Rain Protocol launches SDK v2 for prediction market builders

    Rain Protocol is addressing that challenge with the second version of its software development kit. The permissionless prediction market protocol has launched SDK (Software Development Kit) v2, enabling developers and AI agents to create and operate independent prediction market platforms on networks such as Arbitrum One. The release also includes migration guides for existing users moving from version 1 to version 2.

    SDK v2 incorporates core infrastructure directly into the protocol, including market creation, trading, settlement, resolution, disputes, and appeals. This reduces the amount of work developers need to do at the infrastructure level, allowing them to focus more on the product layer—such as deciding which markets to create and how users will interact with them.

    AI agents can build and operate prediction markets

    The new SDK is designed for human developers as well as AI agents. Machine-readable documentation and built-in agent skills are intended to help AI coding tools understand the protocol and build on it with greater independence. As AI agents take on more software development tasks, Rain expects them to potentially move beyond assisting developers and play a role in creating and operating prediction markets themselves.

    Roy Shaham, CEO of Rain Protocol said, “As the market expands, we expect the biggest shift to come from users being less passive and increasingly a part of the building process. Our goal with SDK v2 is to give developers the freedom to build new types of markets, explore new ways they can be used, and shape them around their own ideas, and we’re eager to see what our community builds with it.”

    On-chain order books added alongside AMM trading

    SDK v2 also expands the available trading infrastructure by adding an on-chain order book alongside Rain’s existing automated market maker (AMM). Builders can use either system depending on the needs of a market. An AMM can provide automated liquidity, while an on-chain order book allows buyers and sellers to place orders that are matched directly on the blockchain.

    The choice may be significant for markets with different liquidity levels, trading volumes, and user behaviors. Other updates improve the user experience after a market goes live. Users can approve a session once rather than authorize every individual action, while builders can receive real-time updates about trades and other market activity.

    The SDK also enables users to convert collateral into Yes and No positions, then convert those positions back into collateral without changing the market price.

    If prediction markets continue expanding beyond a small number of major platforms, the category’s next phase could be shaped as much by the people building markets as by those betting on them. Rain Protocol’s SDK v2 reflects that shift by making prediction markets easier to build, not just use.

    Source: cryptonews.net

  • Shiba Inu Coin Drops 20%: Could September Trigger SHIB’s Next Rally?

    Shiba Inu Coin Drops 20%: Could September Trigger SHIB’s Next Rally?

    Shiba Inu (SHIB) has erased more than 20% of its late-August gains, but the pullback could create an accumulation opportunity if historical market patterns repeat.

    On a broader timeframe, the memecoin has been gradually recovering lost ground in the second half of 2026, as indicated by its rising channel in purple. However, attempts to hold above the key 200-day moving average (MA) at $0.0000069 have failed, reinforcing that a bullish breakout remains elusive.

    Still, the channel structure could remain intact if the broader cryptocurrency market extends its upward momentum.

    Source: $SHIB/USDT, TradingView

    Could September favor Shiba Inu again?

    Beneath the short-term uncertainty and gradual price action, several bullish signals are emerging for Shiba Inu.

    Cyclical patterns, particularly during the early stages of a bull market, have historically favored Shiba Inu and memecoins more broadly. In 2023, for example, SHIB consolidated at $0.00000678 before surging 70% to $0.000011 by mid-December. During the second leg of the 2024 rally, $SHIB rose 165% to nearly 0.00003.

    During those periods, the broader memecoin market gained 78% and 713%, respectively. So far, the broader memecoin index tracked by VanEck’s MarketVector has climbed 9% from its recent lows. If historical patterns hold and memecoin activity accelerates, $SHIB could follow the same trend.

    Source: MarketVector

    SHIB accumulation remains steady

    Spot-market demand for the memecoin has remained stable despite the broader sell-off in early 2026. This is reflected in the increase, followed by the recent stabilization, of SHIB supply held outside exchanges.

    The data suggests that $SHIB experienced significant accumulation during the crypto winter.

    Source: Santiment

    A similar ‘calm before a storm’ appeared before Shiba Inu’s explosive run from September to November 2024. However, $SHIB’s disinflation and token-burn program slowed considerably in late August and early September.

    Nearly 100M $SHIB tokens were incinerated in early August. Since then, the burn rate has fallen to 1.8M tokens, representing a 98% decline. This contrasts sharply with the 350% increase in $SHIB’s burn rate recorded during July.

    Source: Shiba burn tracker

    Key levels for a potential SHIB rally

    Overall, September could become a strong accumulation period if the market repeats the pattern seen before previous bull runs. However, the 98% decline in the burn rate needs to reverse to strengthen bullish sentiment heading into the fourth quarter.

    An extended rally could receive confirmation if $SHIB reclaims $0.000007. That level also corresponds with the 50-week moving average and has acted as a key barrier to rallies throughout 2026.

    • $SHIB has erased more than 20% of its August gains, but September could provide a springboard for a fourth-quarter rally if history repeats.
    • The $SHIB burn rate has fallen 98%, from 100M tokens to just 1.8M over the past 30 days.
  • Flare (FLR) Joins Top Gainers With 15% Rally as Price Eyes $0.010

    Flare (FLR) Joins Top Gainers With 15% Rally as Price Eyes $0.010

    Flare Price Rally Targets $0.0082 and $0.0084 as Bullish Structure Emerges

    Flare ($FLR) has joined the market’s top gainers with a 15% rally, pushing its price to approximately $0.0065 at the time of writing. Market analysis suggests the advance could continue and potentially establish a new high if the token clears key structural resistance levels.

    Flare’s Bullish Cup-and-Handle Pattern Faces Key Resistance

    $FLR’s recent price action has formed a cup-and-handle pattern, a structure often viewed as a bullish precursor when the price breaks above its neckline. For Flare, that neckline is positioned at the horizontal resistance level of $0.0075.

    A decisive move above $0.0075 could open the way for further gains. The bullish outlook identifies three key price levels: $0.0082 initially, followed by $0.0084, while the most optimistic scenario places $FLR at $0.010. Momentum will be important in determining how far the rally can extend.

    The main hurdle remains the neckline resistance. Clearing that level could determine whether Flare enters a sustained upward move. Even a rally from the current price to the neckline would represent roughly 10% upside.

    Source: TradingView

    Technical Indicators Point to Strength

    Flare’s technical indicators are also showing improved market strength, supporting the possibility of continued upside.

    At the time of this report, the Aroon Indicator shows the Aroon Up line, marked in orange, above the Aroon Down line. The two readings stand at 92.86% and 7.14%, respectively.

    When the Aroon Up line remains above the Aroon Down line, the price has a greater chance of continuing to form higher swings. The most bullish configuration would occur if Aroon Up reached 100% while Aroon Down fell to 0.00%.

    The Accumulative Swing Index (ASI) is also trending upward, indicating a bullish market structure. Although the ASI has ticked slightly lower, as marked in red, the move is more likely to reflect a temporary pullback than the start of a broader market correction.

    Source: TradingView

    Spot Market Demand Could Support the FLR Rally

    Spot market activity could play a decisive role in determining whether Flare’s rally continues. At the time of this report, demand for $FLR had surged significantly.

    CoinGlass data shows that netflow reached approximately $325,000, suggesting that more FLR moved out of exchanges and into private wallets for longer-term holding.

    Source: CoinGlass

    If the trend continues and outflows remain higher than inflows, the movement of capital could support $FLR’s attempt to reach a new high in the near term.

    Flare Price Outlook

    Flare’s bullish cup-and-handle structure puts $0.0082 and $0.0084 in focus, with $0.010 possible if buying momentum strengthens. Strong spot-market demand and rising exchange outflows could further support the rally as buyers push $FLR toward a new high.

  • Bitcoin (BTC) Reverses Course as Whales Trade These Altcoins

    Bitcoin (BTC) Reverses Course as Whales Trade These Altcoins

    Whale activity is drawing as much attention as price movements in the cryptocurrency market. Bitcoin, which surged above $80,000 last week, has since retreated to around $78,000. Volatility across altcoins is also influencing investor risk appetite, while transactions involving whale wallets holding $BTC and other tokens continue to attract scrutiny.

    James Wynn opens 30x Bitcoin long position

    According to cryptocurrency analysis platform Lookonchain, prominent whale James Wynn switched from a short position to a long position on Bitcoin. After closing his short at a loss, Wynn opened a 30x $BTC long position.

    Whale loses $308,000 on $PONS trade

    Another major whale drew attention through its activity in the altcoin $PONS. Lookonchain reported that the whale spent 181 $ETH, worth approximately $443,000 at the time, to purchase 7.99 million $PONS about a month ago.

    After the price declined, the whale sold its entire $PONS position at a loss of $308,000. If it had held the tokens, the 7.99 million $PONS would now be worth $3.46 million, representing a potential profit of more than $3 million.

    Whales accumulate and stake $HYPE

    Mysterious whale address 0x6436 purchased 141,442 $HYPE tokens, valued at $11.88 million, today.

    Another whale purchased 488,599 $HYPE at $35 per token five months ago, for a total value of $17.18 million. The whale has now staked all 488,599 $HYPE and currently holds $23.7 million in unrealized profit.

    Ethereum whale sells $408 million in ETH

    Finally, a mysterious Ethereum whale sold 167,855 $ETH worth approximately $408 million. The whale still holds 97,115 $ETH, valued at around $237 million.

    This is not investment advice.

  • Bitcoin Enters ‘Rektember’ as Rate-Hike Risk and Seasonal Trends Threaten Rally

    Bitcoin Enters ‘Rektember’ as Rate-Hike Risk and Seasonal Trends Threaten Rally

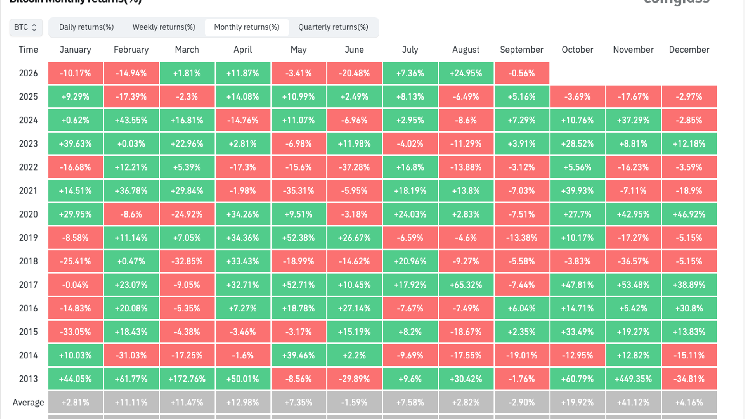
    Bitcoin started September on a weaker note, falling 1% to below $78,000 as the cryptocurrency entered what is commonly called “Rektember.” Since 2013, September has been Bitcoin’s worst-performing month on average, with an average decline of about 3% and only five positive monthly returns.

    Recent performance offers some encouragement for Bitcoin bulls. The cryptocurrency has gained in each of the past three Septembers, while BTC surged 25% in August—its strongest monthly performance since November 2024. After that rally, the market may be due for a period of consolidation or a potential correction.

    Macro headwinds weigh on Bitcoin

    The broader macroeconomic environment is also creating pressure for risk assets. Fed Chair Kevin Warsh’s hawkish speech at Jackson Hole last Friday, which emphasized elevated inflation, helped trigger a global bond sell-off. Several sovereign bond yields have reached new cycle highs, while the U.S. 10-year Treasury yield climbed to 4.784%.

    Markets are now pricing in a 66% probability of a 25-basis-point rate hike at the Federal Reserve’s Sept. 16 meeting, followed by the possibility of another increase before the end of the year. Such moves would bring the federal funds target range to 4.00-4.25% by the close of 2026.

    Source: cryptonews.net

  • Firelight Raises $8 Million and Expands Beyond XRP to Make DeFi Less Intimidating for Fintechs

    Firelight Raises $8 Million and Expands Beyond XRP to Make DeFi Less Intimidating for Fintechs

    Firelight is also evaluating a wider range of liquid assets that do not currently generate substantial yield, CEO Anthony DeMartino told CoinDesk in an interview.

    “There’s a bunch of different assets that we’re considering,” DeMartino said. “Anything … that’s a solid asset, that has good liquidity to it, that doesn’t provide its own natural yield, will eventually be eligible to be posted as collateral.”

    Bringing fintech money onchain

    Firelight is targeting an opportunity beyond crypto-native traders as fintech companies, neobanks and payments providers increasingly integrate onchain yield products into their applications.

    The risk of customer capital being lost in an exploit can become a significant obstacle when a product is ready to launch, DeMartino said. Firelight aims to provide a protection layer that makes the transition to onchain products less daunting.

    “This isn’t built for degens,” he said. “This is built to bring the next wave of capital in. We want to be that protection layer to allow that adoption.”

    DeMartino expects more money currently held in bank accounts to move into fintech earn products powered by stablecoins, onchain vaults and wallets. Sentora, he said, has also been working to bring yield products to fintech applications, including payroll and remittance platforms.

    The gap in onchain protection remains substantial. Approximately $80 billion is locked in DeFi, according to Firelight, while only a fraction of a percent is covered by onchain protection.