Tag: Technical analysis

  • Peter Brandt’s Favorite Analyst Weighs In on Bitcoin: “It’s Important for It to Break Through This Level by the End of the Week”

    Peter Brandt’s Favorite Analyst Weighs In on Bitcoin: “It’s Important for It to Break Through This Level by the End of the Week”

    Key Highlights

    • Technical analyst Aksel Kibar identifies a weekly close above $82,800 as a critical threshold for Bitcoin, potentially confirming a bullish rectangular pattern reversal or double bottom formation.
    • Kibar emphasizes that formation breakouts validated by significant moving averages—such as the 52-week EMA—provide dual confirmation of both trend direction and pattern completion.
    • The analyst distinguishes between investor and trader timeframes, advising long-term participants to watch weekly candles while short-term traders monitor daily candlesticks for entry timing.

    Kibar Flags $82,800 as Pivotal Level for Bitcoin Pattern Completion

    Technical analyst Aksel Kibar has highlighted the $82,800 price level as a decisive inflection point for Bitcoin (BTC), stating that a weekly candle close above this mark could validate a major bullish chart structure. According to Kibar, the cryptocurrency may be completing either a rectangular pattern reversal or a double bottom formation, both of which have developed near the 52-week exponential moving average (EMA)—a long-term trend filter he has tracked for approximately one year.

    Kibar stressed that an intraday spike above $82,800 would not satisfy the technical requirements for confirmation. Instead, the formation demands a clear weekly candle close above the threshold. “The trend is confirmed, and at the same time, the breakout of the chart formation is also validated. This is how I evaluate the completion of formations,” Kibar stated, describing the dual signal generated when a pattern breakout coincides with a breach of a major moving average.

    Moving Averages as Context, Not Triggers

    The analyst clarified that he does not treat moving average crossovers as standalone buy or sell signals. “I am hesitant to consider moving averages as trading signals on their own… I do not view a price crossing a moving average as a direct buy or sell signal,” Kibar explained. He argued that the critical factor is price breaking the structural boundaries of identifiable technical formations, with moving averages serving as supplementary validation rather than primary triggers.

    Kibar also differentiated his analytical framework by timeframe. He characterized his current outlook as primarily investor-focused, relying on weekly intervals to assess pattern maturity. For market participants operating on shorter horizons, he suggested monitoring daily candlesticks to refine entry timing, acknowledging that execution tactics may differ between long-term positioning and active trading.

    Why This Matters

    The $82,800 level sits near the 52-week EMA, a widely watched institutional trend metric that often acts as a demarcation between bull and bear market regimes. A confirmed weekly close above both the pattern resistance and this moving average would represent a rare confluence of structure and trend confirmation—historically a precursor to sustained directional moves. For Bitcoin, which has chopped in a broad range for months, such a breakout could signal the end of accumulation and the start of a new markup phase. Market participants should watch for weekly candle closure data and volume confirmation to distinguish a valid breakout from a failed test.

    Frequently Asked Questions

    What specific price level does Aksel Kibar identify as critical for Bitcoin?
    A weekly candle close above $82,800 is required to confirm the potential rectangular pattern reversal or double bottom formation.
    Does Kibar use moving average crossovers as entry signals?
    No. Kibar explicitly states he does not view a price crossing a moving average as a direct buy or sell signal, but rather as contextual validation when combined with a chart pattern breakout.
    How does Kibar differentiate between investors and traders in his analysis?
    He frames his formation analysis from an investor’s perspective using weekly candles, while suggesting short-term traders monitor daily candlesticks for tactical entry timing.
  • NEAR Price Rallies 24% After AI Utility Expands Across 43 Models – Will the Rally Last?

    NEAR Price Rallies 24% After AI Utility Expands Across 43 Models – Will the Rally Last?

    Key Highlights

    • $NEAR token surges 24.52% as confidential TVL tops $70 million, triggering the first milestone snapshot allocating 333,333 tokens locked until the three-day volume-weighted average price sustains above $3.33.
    • Spot volume jumps 131.81% to $1.63 billion with CryptoQuant data showing Big Whale Orders and a Taker Buy Dominant 90-day CVD, confirming aggressive buyer control during the rally.
    • Technical breakout targets the $4 region after clearing $2.820 resistance and reaching $3.461, with a higher-timeframe Fair Value Gap spanning $3.65–$4.20 and ADX at 55.63 signaling strong trend momentum.

    Confidential Infrastructure Milestone Fuels $NEAR Rally

    The Near Protocol native token $NEAR has emerged as the top-performing artificial intelligence crypto asset, posting a 24.52% gain as trading activity expanded across both spot and derivatives markets. The advance coincides with a significant milestone for the network’s confidential infrastructure: total value locked (TVL) in confidential applications recently surpassed $70 million, triggering the first snapshot under the Confidential Intents incentive program.

    According to program parameters, the snapshot allocated 333,333 milestone tokens. These tokens remain locked until $NEAR’s three-day volume-weighted average price (VWAP) reaches and sustains at least $3.33. While the token’s spot price climbed above that threshold during the recent expansion, eligibility for unlocking requires the three-day VWAP to hold at or above $3.33, adding a time-weighted condition to the incentive structure.

    Ecosystem Utility Expands Across AI and Cross-Chain Execution

    Beyond the incentive mechanics, the protocol’s Confidential Intents framework now supports private execution across more than 30 connected blockchains. The system has also integrated Intents with autonomous-agent infrastructure to facilitate asset transfers and cross-chain payments. On the AI front, $NEAR’s utility deepened through staking-based computing credits that currently cover 43 AI models, broadening the token’s fundamental demand drivers beyond speculative trading.

    Spot market participation surged in tandem, with volume increasing 131.81% to $1.63 billion. This spike suggests broad-based market engagement underpinning the price appreciation rather than thin-liquidity movement.

    Whale Orders and Aggressive Spot Buying Confirm Demand

    Large market participants strengthened the demand picture as price accelerated. CryptoQuant’s Spot Average Order Size metric registered Big Whale Orders, indicating a prevalence of larger transaction sizes. Simultaneously, the 90-day Spot Taker Cumulative Volume Delta (CVD) remained Taker Buy Dominant, signaling that aggressive buyers controlled executed spot activity throughout the rally.

    Analysts note that whale-sized orders alone do not conclusively prove accumulation; however, the Taker Buy Dominant reading provides stronger evidence that active demand accompanied those trades. The combination of elevated order sizes and aggressive buyer execution gives $NEAR’s move firmer spot-market structural support.

    Derivatives Leverage Amplifies Identifiable Demand

    By contrast, the derivatives market expanded sharply as traders increased leveraged exposure. Open Interest rose 39.54% to $924.66 million, while derivatives volume surged 101.79% to $1.85 billion. This expansion could support trend continuation while buyers defend the breakout, though elevated leverage also increases liquidation risk should $NEAR reverse sharply.

    Crucially, spot buying and Big Whale Orders accompanied this derivatives expansion, indicating that leverage amplified identifiable spot demand rather than carrying the rally in isolation.

    Technical Structure Points Toward $4 Fair Value Gap

    During its uptrend, $NEAR broke decisively above the $2.820 level, overcoming a resistance zone that had previously rejected further advance. Price subsequently reached $3.461, bringing a higher-timeframe Fair Value Gap (FVG) into immediate focus. The imbalance stretches approximately between $3.65 and $4.20, placing the psychologically significant $4.00 level inside the target region.

    Directional strength intensified substantially during the breakout, with the Average Directional Index (ADX) reaching 55.6278. The Positive Directional Indicator (+DI) at 50.3812 overwhelmingly exceeds the Negative Directional Indicator (-DI) at 4.1701, confirming dominant bullish momentum. Additionally, the Parabolic SAR indicator at $2.297 remains well below the prevailing market price, reinforcing the development of a constructive technical structure.

    If bulls maintain control above the $2.820 breakout zone, $NEAR could extend deeper into the FVG. Alternatively, rejection from the imbalance would likely send price back toward the breakout area before another recovery attempt.

    Why This Matters

    The convergence of fundamental milestone achievement, expanding confidential and AI utility, and robust spot-market demand structures distinguishes this rally from purely speculative rotations. The Confidential Intents milestone demonstrates tangible adoption of Near’s privacy-preserving cross-chain infrastructure, while the staking-based AI compute credits create a recurring utility loop for token holders. Technically, the clean break of multi-month resistance at $2.820 and the measured move toward the $3.65–$4.20 FVG provide a clear roadmap for trend followers. However, the 39.5% surge in open interest warrants monitoring: a sharp correction could trigger cascading liquidations, testing the durability of the spot bid. The three-day VWAP condition for milestone token unlocks also introduces a near-term price anchor at $3.33 that may act as a magnet or support zone in the coming sessions.

    Frequently Asked Questions

    What triggers the unlock of the 333,333 milestone tokens allocated to the Confidential Intents program?
    The tokens remain locked until $NEAR’s three-day volume-weighted average price (VWAP) sustains at or above $3.33. A spot price print above $3.33 is insufficient; the three-day average must hold the level.
    How large is the current confidential TVL on Near, and how many blockchains does Confidential Intents connect?
    Confidential TVL recently surpassed $70 million, and Confidential Intents supports private execution across more than 30 connected blockchains.
    What do the CryptoQuant Spot Taker CVD and Big Whale Orders indicate about current market dynamics?
    The 90-day Spot Taker CVD reading of “Taker Buy Dominant” shows aggressive buyers are driving spot execution, while Big Whale Orders signal elevated average transaction sizes. Together, they suggest strong, active demand from large participants rather than passive accumulation.
  • Top Crypto Price Predictions: Near Protocol, Venice Token, Hyperliquid

    Top Crypto Price Predictions: Near Protocol, Venice Token, Hyperliquid

    Key Highlights

    • The global cryptocurrency market valuation reached $2.76 trillion amid a broad-based rally that persisted despite interest rate hikes from the Federal Reserve and the Bank of Japan.
    • Near Protocol (NEAR) surged to $3.7830, breaking above a key $3.08 cup-and-handle resistance, though an RSI of 85 signals overbought conditions and a potential retest of support.
    • Hyperliquid (HYPE) climbed toward a $100 target after clearing its prior all-time high of $89.38, fueled by political tailwinds and a perpetual DEX volume exceeding $240 billion in 30 days.

    Broad Market Resilience Defies Central Bank Tightening

    The cryptocurrency market demonstrated notable strength in the latest session, with the aggregate market capitalization holding at $2.76 trillion and the majority of tokens trading in positive territory. This advance occurred despite a backdrop of monetary tightening, as both the Federal Reserve and the Bank of Japan (BoJ) implemented interest rate hikes, while crude oil prices remained elevated—factors that have historically pressured risk assets. The decoupling suggests growing conviction among market participants in the structural narratives driving specific Layer-1 ecosystems and decentralized finance primitives.

    Near Protocol Leads Layer-1 Outperformance Amid AI Narrative

    Near Protocol ($NEAR) has emerged as a standout performer among major Layer-1 networks, significantly outpacing Bitcoin, Ethereum, and XRP in year-to-date returns. The token rallied to a high of $3.7830, a remarkable climb from its year-to-date low of $0.8490. Technically, NEAR cleared the $3.08 resistance level, which represented the upper boundary of a cup-and-handle formation—a pattern widely regarded in technical analysis as a bullish continuation signal. The asset now trades above all major moving averages and the Supertrend indicator, while the Average Directional Index (ADX) continues to rise, confirming strengthening trend momentum.

    However, caution is warranted. The Relative Strength Index (RSI) has elevated to 85, placing the token deep in overbought territory. This creates a heightened probability of a near-term pullback to retest the $3.08 breakout level as new support—a classic break-and-retest pattern—before the uptrend potentially resumes. The project’s diversified positioning, spanning a Layer-1 blockchain, a privacy-focused trading platform, and an AI agent marketplace, continues to underpin fundamental demand.

    Venice Token Extends Gains on AI Utility and Deflationary Mechanics

    Venice Token ($VVV), the native asset of the Venice AI platform, traded at $27.25, approaching its all-time high of $29.30. The platform differentiates itself by aggregating access to leading AI models from providers including Anthropic, OpenAI, and Grok, with users paying in fiat currency. A portion of platform fees is allocated to a systematic buy-and-burn mechanism, introducing deflationary pressure; the protocol burned over $702,000 worth of VVV last month and an additional $673,000 in the current month. Price action has confirmed a break-and-retest above the $21.48 cup-and-handle resistance, with the token holding above all key moving averages. The technical path of least resistance points upward, with analysts targeting the $35 level as the next significant objective.

    Hyperliquid Surges on Political Tailwinds and DEX Dominance

    Hyperliquid ($HYPE) has experienced a powerful upward trajectory catalyzed by two significant external developments. Former President Donald Trump signaled support for the protocol’s entry into the United States market, while the Securities and Exchange Commission (SEC) indicated backing for the tokenization of traditional stocks—both developments validating Hyperliquid’s core value proposition. Fundamentally, the platform’s perpetual decentralized exchange (DEX) has cemented its market leadership, processing over $240 billion in volume over the past 30 days, a figure that substantially exceeds rivals such as Aster and Lighter.

    From a technical perspective, HYPE has completed a textbook break-and-retest pattern, finding support at $76—its June 16 high—before breaking decisively above the prior all-time high resistance at $89.38. With the breakout confirmed and the asset trading in price discovery mode, the next major psychological and technical target sits at $100.

    Why This Matters

    The divergent technical setups across these three assets illustrate the maturing differentiation within the crypto market. NEAR’s strength reflects the market’s appetite for integrated AI-blockchain infrastructure, Venice demonstrates the viability of real-yield, utility-driven tokenomics in the AI sector, and Hyperliquid’s ascent highlights the convergence of regulatory clarity, political advocacy, and superior product-market fit in decentralized derivatives. Collectively, their resilience amid Federal Reserve and BoJ tightening suggests that protocol-specific fundamentals are increasingly superseding macroeconomic beta as the primary driver of capital allocation. Traders should monitor the $3.08 level on NEAR for confirmation of the break-and-retest, VVV’s approach to price discovery above $29.30, and HYPE’s volume sustainability as it approaches the $100 milestone.

    Frequently Asked Questions

    What is driving the current rally in the cryptocurrency market despite rate hikes?
    The market’s resilience stems from strong protocol-specific fundamentals—such as AI integration, deflationary tokenomics, and record DEX volumes—overriding traditional macroeconomic headwinds from the Federal Reserve and Bank of Japan rate decisions.
    Is Near Protocol (NEAR) overbought at current levels?
    Yes, the Relative Strength Index (RSI) reading of 85 indicates significantly overbought conditions, increasing the likelihood of a corrective pullback to retest the $3.08 breakout level before any further upside continuation.
    What makes Hyperliquid (HYPE) unique compared to other decentralized exchanges?
    Hyperliquid operates a high-performance perpetual DEX that processed over $240 billion in 30-day volume, surpassing peers like Aster and Lighter, while benefiting from explicit political support for U.S. market entry and SEC openness to asset tokenization.
  • Bitcoin Briefly Tops $81,000 as Bad News Stops Working

    Bitcoin Briefly Tops $81,000 as Bad News Stops Working

    Key Highlights

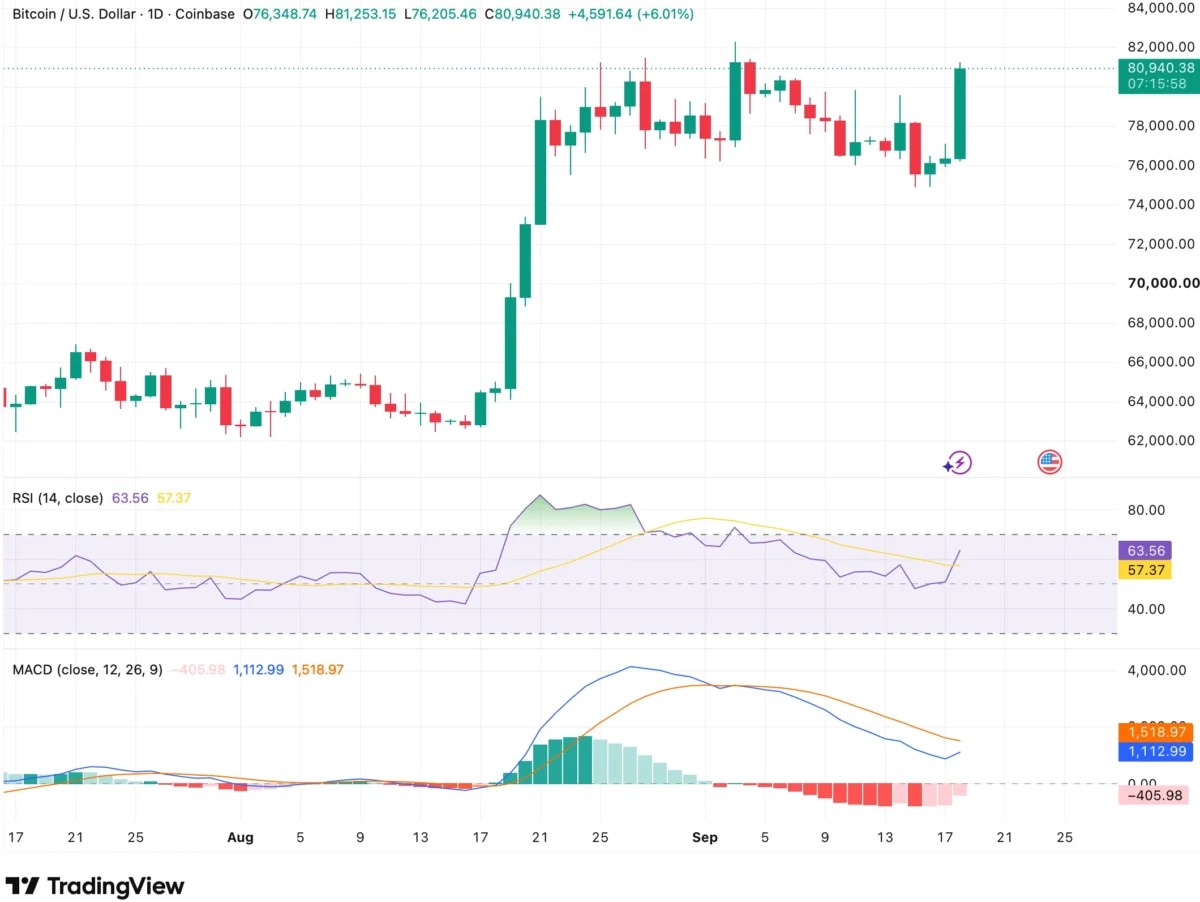
    • Bitcoin surged approximately 6% on Friday to briefly trade above $81,000, absorbing five major macroeconomic and regulatory headwinds—including a failed Senate vote on the CLARITY Act, a Federal Reserve rate hike, and a Bank of Japan rate increase—without a sustained selloff.
    • The rally was driven predominantly by short covering: $470 million in short positions were liquidated versus only $60 million in longs, while aggregate open interest fell 1.4%, signaling position compression rather than fresh leveraged buying.
    • Technical momentum is improving (14-day RSI at 63.56, above its moving average), but the daily MACD remains below its signal line, leaving the move unconfirmed by slower momentum indicators.

    Bitcoin Defies Concentrated Macro Headwinds

    Bitcoin staged a sharp intraday reversal on Friday, climbing roughly 6% to a session high of $81,253 on the Coinbase daily chart before settling near $80,940 at the time of writing. The advance is notable not for its magnitude but for the backdrop against which it occurred: within a single week, the market digested a procedural failure on the CLARITY Act in the U.S. Senate (49–50, short of the 60 votes needed for cloture), the Federal Reserve’s first rate increase since 2023 (lifting the target range to 3.75%–4.00%), the Bank of Japan’s policy rate hike to 1.25% (a 31‑year high), a U.S. Dollar Index reclaiming the 100 level, and Brent crude holding above $100 per barrel. Each of these developments typically pressures risk assets—higher rates boost the appeal of yield‑bearing alternatives, a stronger dollar tightens global financial conditions, and elevated oil sustains inflationary impulses—yet Bitcoin not only refused to extend its earlier decline toward $76,000 but accelerated higher.

    Derivatives Data Reveal Short‑Covering Dynamics

    Friday’s derivatives metrics provide a clearer mechanical explanation than any single bullish catalyst. According to Coinglass data, roughly $530 million in leveraged crypto positions were liquidated over 24 hours, with short positions accounting for approximately $470 million of that total versus only $60 million in long liquidations. Simultaneously, aggregate open interest declined 1.4% to $453.43 billion while 24‑hour derivatives volume rose 2.2% to nearly $936 billion. This combination—rising price, falling open interest, and disproportionately large short liquidations—is consistent with position compression: traders positioned for further downside were forced to buy back as Bitcoin rallied, amplifying the move. The breadth of the advance underscores the systemic nature of the squeeze; Ethereum gained 5.3%, XRP 6.2%, Solana 10.4%, and HYPE more than 11%, lifting total crypto market capitalization about 5% to $2.76 trillion.

    Short Squeezes Are Self‑Limiting

    While the liquidation cascade explains the velocity of Friday’s rally, it does not guarantee durability. Forced covering creates mechanical demand that evaporates once bearish positions are exhausted. The critical question is whether underlying spot demand—evidenced by sustained exchange trading activity, continued ETF inflows, or stable open interest rebuilding—persists after the liquidation impulse fades. Absent that, the rally remains a positioning unwind rather than a new demand regime.

    Technical Momentum Improves But Lags Price Action

    Bitcoin’s daily chart offers a second lens on sustainability. The 14‑day Relative Strength Index has climbed to 63.56, comfortably above its moving average at 57.37 and well clear of the conventionally overbought 70 threshold, indicating strengthening momentum without exhaustion. The Moving Average Convergence Divergence, however, tells a more cautious story: the MACD line has turned upward to 1,112.99 but remains below the signal line at 1,518.97, leaving the histogram negative at –405.98. The histogram bars have been contracting and the MACD line curling higher, suggesting the direction is improving, but a bullish crossover has not yet occurred. This divergence—price accelerating while the slower daily momentum indicator has not fully confirmed—creates a clear watchpoint: a MACD crossover would signal that momentum broadening is underway rather than remaining concentrated in a single explosive session.

    Historical Parallel: 2023 Regime Shift Echoes

    The current dynamic bears a striking resemblance to Bitcoin’s behavior throughout 2023. During that period, the asset absorbed aggressive Federal Reserve tightening (the target range ultimately reaching 5.25%–5.50%) alongside an intensive U.S. regulatory campaign that saw the SEC sue Coinbase and Binance and designate several major tokens as securities. Despite repeated negative headlines, each successive shock generated diminishing incremental selling pressure, and Bitcoin gradually ceased revisiting the lows established after the 2022 collapse. The lesson from 2023 is not that restrictive policy or enforcement actions became bullish, but that the market’s capacity to produce new sellers in response to them was waning. Markets can begin shifting before the news flow turns favorable, and Friday’s price action—absorbing five simultaneous headwinds without a net decline—suggests a similar recalibration may be in progress.

    Why This Matters

    The week’s events highlight a potential inflection point in Bitcoin’s market structure. For years, macro tightening and regulatory uncertainty acted as reliable catalysts for drawdowns. The failure of that playbook in the face of a concentrated barrage of negative catalysts—failed legislation, dual central‑bank hikes, dollar strength, and elevated energy prices—signals that the marginal seller may be exhausted. If spot demand proves resilient, leverage remains contained, and momentum indicators like the MACD confirm the RSI’s strength, the market could be transitioning to a regime where bad news is increasingly “priced in” and produces diminishing downside volatility. This has direct implications for portfolio allocation, risk management, and the narrative around Bitcoin’s maturation as a macro asset. Institutional participation metrics (ETF flows, custody data) and derivatives market structure (open interest trends, funding rates) will be the primary arbiters of whether this is a durable shift or a temporary positioning anomaly.

    Frequently Asked Questions

    What specifically drove Bitcoin’s 6% rally on Friday?

    The primary driver was a massive short‑covering event: approximately $470 million in short positions were liquidated in 24 hours, forcing bearish traders to buy back Bitcoin and accelerating the price rise. Aggregate open interest fell, confirming that the rally stemmed from position unwinding rather than new leveraged long entries.

    Is this rally sustainable or just a short squeeze?

    Sustainability hinges on whether genuine spot demand persists after the forced buying ends. Key signals to watch include continued ETF inflows, stable or gradually rebuilding open interest (rather than a surge in aggressive longs), and a bullish MACD crossover on the daily chart confirming broadening momentum.

    How does this week compare to previous macro stress periods for Bitcoin?

    The closest analogue is 2023, when Bitcoin absorbed simultaneous Fed tightening and SEC enforcement actions with progressively smaller drawdowns. In both episodes, the market’s reaction function to negative news appeared to change—selling pressure diminished even as the fundamental headwinds persisted—suggesting a structural shift in participant positioning and risk appetite.

  • SEC’s ‘Innovation Exemption’ Boosts ONDO – Can the Altcoin Escape Its 4-Month Trap?

    SEC’s ‘Innovation Exemption’ Boosts ONDO – Can the Altcoin Escape Its 4-Month Trap?

    Key Highlights

    • Ondo Finance ($ONDO) surged over 12% in 24 hours as trading volume jumped 91% to exceed $267 million, driven by the SEC’s new five-year Innovation Exemption for tokenized securities venues.
    • The regulatory order allows qualified venues to trade tokenized stocks through permissioned liquidity pools without registering as traditional exchanges, potentially expanding the regulated market for Ondo’s tokenized products, which already exceed $3.5 billion in total market cap with over $900 million in tokenized stocks.
    • Technical analysis shows $ONDO testing a four-month descending triangle resistance near $0.38–$0.49, with MACD signaling a bullish crossover but bearish RSI divergence warning of rejection risk toward $0.30–$0.32 support.

    SEC Innovation Exemption Catalyzes Ondo Rally

    Ondo Finance’s native token $ONDO climbed more than 12% over the past 24 hours, outperforming the broader cryptocurrency market rally as daily trading volume surged 91% to surpass $267 million at press time. While the token benefited from general risk-on sentiment, the primary catalyst was a landmark regulatory development from the U.S. Securities and Exchange Commission that directly addresses the tokenized asset ecosystem Ondo operates within.

    Five-Year Regulatory Window for Tokenized Securities Venues

    On September 17, the SEC issued its “Innovation Exemption,” granting conditional relief to qualifying Tokenized Securities Venues for a five-year period. The order permits these venues to trade tokenized stocks through permissioned liquidity pools without requiring registration as traditional national securities exchanges. SEC Chairman Paul Atkins called the decision a significant step toward bringing U.S. capital markets on-chain. For Ondo Finance, which has positioned itself as a leading infrastructure provider for tokenized real-world assets, the exemption could substantially widen the regulated market accessible to its product suite.

    Ondo’s Tokenized Asset Footprint Expands

    According to data from Token Terminal, Ondo Finance’s total tokenized market capitalization has exceeded $3.50 billion. Tokenized stocks represent more than $900 million of that value, accounting for 25.5% of the composition. Funds hold the largest share at 71.2%, while stablecoins and commodities constitute 2.1% and 1.2% respectively. The regulatory clarity provided by the SEC’s temporary relief strengthens Ondo’s business case by reducing compliance uncertainty for institutional participants seeking exposure to on-chain representations of traditional securities.

    Technical Structure Tests Four-Month Triangle Resistance

    Despite the fundamental tailwind, $ONDO’s price action remains at a critical technical juncture. The token has been consolidating within a descending triangle pattern since early May, with resistance declining from $0.49 toward $0.38. Recent sessions saw price test this descending trendline as the MACD histogram turned positive after eight days of seller dominance, accompanied by a bullish signal line crossover. A confirmed breakout could target the pattern’s upper boundary near $0.50. However, bearish RSI divergence persists, indicating selling pressure may not be fully exhausted. Rejection at current levels risks a return to the $0.30–$0.32 support zone, with a break below $0.30 opening the path toward a deeper demand area around $0.26. Profit-taking from positions established near $0.30 could also interrupt the near-term advance.

    Why This Matters

    The SEC’s Innovation Exemption represents the most concrete federal regulatory acknowledgment to date that tokenized securities can operate within a tailored framework distinct from traditional exchange infrastructure. By creating a five-year sandbox for permissioned liquidity pools, the order addresses a core structural barrier that has limited institutional adoption of on-chain assets: the lack of a clear legal pathway for secondary trading. Ondo Finance, alongside peers such as Franklin Templeton and BlackRock in the tokenized fund space, stands to benefit directly as the universe of compliant counterparties and venues expands. The coming months will test whether regulatory relief translates into sustained capital inflows and deeper liquidity for tokenized equities, or whether the market remains constrained by custody, settlement, and interoperability frictions that the exemption does not resolve.

    Frequently Asked Questions

    What does the SEC’s Innovation Exemption allow for tokenized securities venues?
    The exemption grants conditional relief for five years, permitting qualified venues to trade tokenized stocks through permissioned liquidity pools without registering as traditional national securities exchanges.
    How large is Ondo Finance’s tokenized asset market currently?
    Ondo’s total tokenized market capitalization exceeds $3.50 billion, with tokenized stocks accounting for more than $900 million (25.5%) of that total, according to Token Terminal data.
    What are the key technical levels to watch for $ONDO?
    Immediate resistance sits at the descending triangle trendline near $0.38–$0.49, with a breakout target near $0.50. Key support lies at $0.30–$0.32; a break below $0.30 could see price test the $0.26 demand zone.
  • Canton (CC) Holds $0.09 – Can It Break Out of Price Range?

    Canton (CC) Holds $0.09 – Can It Break Out of Price Range?

    Key Highlights

    • Canton (CC) token rallied 8.8% in 24 hours after defending the critical $0.09–$0.10 psychological support zone, with technical indicators signaling a potential 25% advance toward the $0.125 range high.
    • Tokenovate completed the first successful intraday repurchase agreement (repo) settlement on the Canton Network, leveraging tokenized USDC and the FINOS Common Domain Model for post-trade automation.
    • On-chain volume metrics (OBV) and multi-timeframe RSI alignment suggest shifting bullish momentum after a prolonged September downtrend, attracting swing trader attention.

    CC Token Price Action and Key Support Levels

    The Canton Network’s native CC token staged a notable 8.8% intraday recovery on Wednesday, reversing a weekly decline of nearly 2% as buyers aggressively defended the $0.09–$0.10 demand zone. According to analysis shared by trader Nehal on X, price had been compressing beneath a descending trendline resistance for several weeks, coiling precisely around a psychological round-number area that has functioned as meaningful support since mid-August. The trader noted that a decisive bullish breakout from this compression could theoretically trigger a 66% rally, though the more immediate technical target sits at the range high near $0.125.

    On higher timeframes, the structure remains constructive despite a bearish break in July that saw CC slice through the $0.135 March support and the $0.107 January low. Since mid-July, the asset has consolidated within a well-defined $0.09–$0.125 range (marked in purple on TradingView charts), with the mid-range level hovering just above the broken $0.107 level. The range lows have now been tested and held on three separate occasions, and Wednesday’s 10.9% bounce underscored renewed conviction among market participants.

    Tokenovate’s Milestone Repo Settlement on Canton Network

    Beyond price action, the Canton ecosystem marked a significant infrastructure milestone. Post-trade workflow automation firm Tokenovate announced the successful execution and settlement of an intraday repurchase agreement (repo) on the Canton Network. The transaction utilized tokenized USDC and the FINOS Common Domain Model (CDM) to automate the end-to-end lifecycle, demonstrating the network’s capacity for institutional-grade, real-time settlement of tokenized financial instruments. This development positions Canton as a live venue for regulated digital asset workflows, moving beyond theoretical use cases into production-grade financial plumbing.

    Technical Outlook: Range-Bound Structure and Breakout Potential

    From a quantitative perspective, the bullish case is gaining technical confirmation. On-balance volume (OBV) recorded a clear influx of buying pressure over the past 36 hours, reversing a steady downtrend that persisted through September. Meanwhile, CC has cleared a local supply zone between $0.097 and $0.099, removing near-term overhead resistance. The Relative Strength Index (RSI) on the 2-hour chart is flashing strong upward momentum, and trend alignment across multiple timeframes is signaling continuity to the upside. Swing traders and investors monitoring this altcoin should watch for a sustained break above the range midpoint near $0.107, which would open the path toward the $0.125 ceiling—approximately 25% above current levels.

    Why This Matters

    The convergence of a technical rebound and a landmark institutional settlement highlights the dual narrative driving Canton Network’s relevance. On one hand, the CC token’s defense of the $0.09 floor reflects speculative confidence in the protocol’s tokenomics and governance utility. On the other, Tokenovate’s repo execution validates Canton’s core value proposition: a privacy-preserving, interoperable blockchain purpose-built for regulated financial markets. The use of FINOS CDM standards and tokenized USDC signals growing adoption of industry-wide data standards and regulated stablecoins for intraday liquidity management. As more financial institutions explore tokenized collateral and atomic settlement, Canton’s early production deployments could translate into sustained network demand—and by extension, fundamental support for the CC token.

    Frequently Asked Questions

    What is the current trading range for the Canton (CC) token?

    Since mid-July, CC has consolidated between $0.09 (range low) and $0.125 (range high), with the midpoint near $0.107. The lows have been successfully defended three times, most recently with a 10.9% bounce on Wednesday.

    What was the significance of Tokenovate’s repo settlement on Canton Network?

    It marked the first successful execution and settlement of an intraday repurchase agreement on the network, using tokenized USDC and the FINOS Common Domain Model to automate the workflow—demonstrating production-ready infrastructure for institutional digital asset markets.

    What technical signals suggest further upside for CC?

    On-balance volume (OBV) has turned upward after a September downtrend, the token cleared a local supply zone at $0.097–$0.099, and the 2-hour RSI shows strong momentum. Multi-timeframe trend alignment also supports a potential move toward the $0.125 range high.

  • XRP Slides Below $1.30 Support as Traders Turn Bearish Short-Term

    XRP Slides Below $1.30 Support as Traders Turn Bearish Short-Term

    Ripple’s XRP token suffered a sharp 9.82% single-day decline on Tuesday, September 15, dropping from $1.42 to $1.28. The sell-off caught many market participants off guard, as the altcoin had spent much of late August repeatedly testing the $1.45 local resistance zone.

    Derivatives Data Signals Waning Speculative Interest

    According to data from CryptoQuant, XRP’s Open Interest (OI) has contracted significantly over the past month. OI fell from $1.128 billion in late August to $871 million at the time of writing, representing a 23% decline equivalent to roughly $257 million.

    This reduction in open derivatives contracts coincided with XRP’s rejection from the $1.50 higher-timeframe supply zone. The data suggests that derivatives positions were either voluntarily closed or forcibly liquidated in large numbers. The combination of decreasing speculative interest and a price slide below the $1.30 support level paints a cautious picture for the near term.

    Institutional Demand vs. Market Headwinds

    On-chain metrics reveal a divergence between institutional appetite and price action. Throughout September, XRP spot ETF flows have remained positive, with growing fund balances acquiring more tokens and reducing available supply.

    Despite this institutional demand, price action has lagged. AMBCrypto reported earlier this month that the disconnect was partly attributed to declining Bitcoin (BTC) prices, as the broader market priced in increasing odds of a rate hike.

    Key Technical Levels Under Pressure

    The $1.30 level had been identified as a critical short-term support zone. However, aggressive selling in the futures markets—accompanied by the declining Open Interest—overwhelmed buyers, causing XRP to lose this foothold in recent sessions.

    Daily Timeframe Structure and Fibonacci Analysis

    Analyzing the XRP/USDT pair on TradingView, the daily swing structure remains technically bullish. An earlier downtrend established a lower high at $1.184 (dotted green line), which was subsequently breached by the August rally, flipping the market structure to the upside.

    Price action has since tested the 61.8% Fibonacci retracement level. At the time of writing, the former $1.30 support is being retested as resistance. Without a renewed influx of strong demand across both spot and futures markets, XRP could continue its retracement toward the $1.14 level.

    Exchange Supply Ratio Holds Steady

    The exchange supply ratio—which measures the proportion of XRP’s circulating supply held on centralized exchange wallets—declined steadily from April through July. Since then, the metric has stabilized around 2.6%.

    If the ratio resumes its previous downtrend, analysts typically interpret it as a sign of accumulation and a shift of coins into cold storage. Conversely, a further price decline accompanied by a rising supply ratio would undermine the current bullish bias, which has already been damaged by the rejection at the key $1.50 supply zone.

    Summary

    • XRP failed to breach the $1.50 supply zone and dropped below the $1.30 support level.
    • Derivatives data shows increased sell pressure and declining speculative interest, signaling short-term bearish sentiment.
    • Spot ETF inflows remain positive, highlighting a divergence between institutional accumulation and current price weakness.
    • Technical structure suggests a potential retracement toward $1.14 if buying pressure does not return.
  • Solana Price Today: SOL Holds $100 as Bullish Trend Battles Fading Momentum

    Solana Price Today: SOL Holds $100 as Bullish Trend Battles Fading Momentum

    Solana Price Analysis: $SOL Holds $100 as Momentum Fades Despite Bullish Structure

    As of September 17, 2026, Solana ($SOL) trades near $100.08, a level that has become a genuine battleground between an intact daily uptrend and momentum that is clearly losing steam. The broader cryptocurrency market offers little directional clarity, with total crypto market capitalization slipping 1.36% and Bitcoin dominance climbing to 58.3%, signaling a defensive tilt across risk assets.

    Key Technical Takeaways

    • Price: $100.08, holding above EMA20 (99.54), EMA50 (93.08), and EMA200 (89.39)
    • Daily MACD histogram: -1.3, signaling fading momentum despite bullish structure
    • On-chain DEX fees surging: Raydium up 206.79%, Orca up 176.31% over 30 days
    • Bitcoin dominance: 58.3%, indicating risk-off sentiment
    • Daily ATR14: 4.09, suggesting ~4% daily swings remain the norm

    Daily Chart: Bullish Structure Meets Fading Momentum

    The daily regime remains tagged bullish, and the structure supports that assessment on the surface. Price at 100.08 trades above the EMA20 at 99.54, the EMA50 at 93.08, and the EMA200 at 89.39 — the textbook definition of an intact uptrend. The RSI14 at 53.15 sits neutral, neither overbought nor oversold, meaning no exhaustion signal is forcing a reversal, but also no strong tailwind is pushing price higher.

    The real tension appears in the MACD: the line sits at 2.11 against a signal of 3.41, leaving the histogram at -1.3. This is a daily momentum reading cooling off even while the trend structure above it stays positive — a classic setup where price remains technically in an uptrend but the fuel behind it is fading fast.

    Bollinger Bands add another layer. The mid-band sits at 101.78, with the upper band at 106.48 and the lower band at 97.07. Price at 100.08 sits just under the midline, meaning $SOL is not stretched in either direction. There is room to move toward the upper band if buyers return, but also space to slide toward 97 without breaking any structural rule.

    Moreover, ATR14 at 4.09 reminds traders this is not a quiet market. Daily ranges of roughly 4% of price mean swings in either direction should be expected, not treated as anomalies.

    Pivot Levels and Short-Term Timeframes

    The daily pivot sits at 99.64, with R1 at 100.8 and S1 at 98.91. Price currently hovers just above the pivot, placing the immediate battle between reclaiming R1 and defending the pivot itself. A drop below 98.91 would cause bulls to lose short-term footing quickly.

    The 1-hour chart complicates rather than confirms the picture. The regime here is neutral, not bullish, and RSI14 at 63.66 shows more short-term enthusiasm than the daily chart. The 1H MACD is actually positive, with the line at 0.51 against a signal of 0.3 and the histogram at +0.21 — a mild bullish signal in isolation.

    The catch: the 1H EMA200 sits at 100.52, above the current price of 100.05. This means $SOL is still trading under a key intraday resistance level even as it holds above its own 1H EMA20 at 98.95 and EMA50 at 98.94. Short-term momentum is trying to build while a bigger intraday ceiling sits just overhead.

    The 15-minute chart serves purely for execution context. It shows a bullish regime with RSI14 at 60.6, but MACD is essentially flat: line at 0.27, signal at 0.28, histogram at -0.01. This signals neither breakout nor breakdown, just indecision at the smallest timeframe while the bigger picture sorts itself out.

    Broader Market Backdrop: Risk-Off Meets On-Chain Growth

    Sentiment is not offering much directional push. The Fear & Greed Index reads 50 — squarely Neutral — aligning with a market that is technically undecided rather than gripped by euphoria or panic. Solana’s share of total crypto market cap stands at roughly 2.23%, a reminder that $SOL moves partly on its own fundamentals and partly on wider capital flows.

    Notable, however, is the divergence between that risk-off tilt and activity on Solana’s own DeFi rails. According to DefiLlama data, activity across Solana-based DEXs has accelerated hard over the past month:

    • Raydium AMM fees: up 206.79% over 30 days
    • Orca DEX fees: up 176.31% over 30 days
    • HumidiFi: up 68.28%
    • BisonFi: up 69.65%
    • PumpSwap: up 18.38%

    This is genuine on-chain usage growth happening underneath a price chart chopping around the $100 level — the kind of fundamental signal that does not always show up immediately in price but tends to matter over longer horizons.

    Bullish Scenario: What Needs to Happen

    For bulls to take control, $SOL needs to hold the daily pivot at 99.64 and push through R1 at 100.8 with enough force to flip the daily MACD histogram back toward positive territory. A decisive reclaim of the 1H EMA200 at 100.52 would go a long way toward confirming that the short-term RSI strength at 63.66 is translating into real follow-through rather than noise.

    If that happens, the next real magnet is the daily Bollinger mid-band at 101.78, with the upper band at 106.48 as the stretch target if momentum genuinely re-accelerates. This scenario gets invalidated the moment price loses the daily EMA20 at 99.54 and closes back below the pivot — at that point the bullish case on paper stops mattering much.

    Bearish Scenario: Momentum Divergence Risks

    The bearish case leans heavily on the daily MACD histogram sitting at -1.3 despite the bullish regime tag. Momentum divergences like this have a habit of resolving through price catching down to reality. If $SOL fails to reclaim the 1H EMA200 at 100.52 and rejects near the daily pivot, a slide back toward S1 at 98.91 becomes the more likely path.

    The daily EMA50 at 93.08 would serve as deeper support if that level fails to hold. This scenario would be invalidated by a strong daily close back above the Bollinger mid-band at 101.78 alongside a MACD line crossing back above its signal — a combination suggesting the momentum fade was temporary rather than the start of something bigger.

    Where This Leaves Traders

    Right now the Solana price is a study in conflicting signals rather than a clean directional call. The daily trend structure still favors bulls on paper, but the momentum underneath it is fading. The 1H chart shows price stuck under its own EMA200 even as short-term RSI runs hot. Layer on a broader market rotating toward Bitcoin and you get a setup that rewards patience over conviction.

    The ATR readings across timeframes confirm this is not a market going to sit still. Daily ranges near 4% of price mean whichever side wins this tug-of-war is likely to move fast once it does. Treating this as a wait-and-confirm environment rather than a moment to force a directional bet seems the more disciplined approach, keeping position sizing aligned with the volatility the ATR data is already flagging.

    Frequently Asked Questions

    What is Solana’s price right now?

    As of September 17, 2026, $SOL is trading at $100.08 on the daily chart, hovering just above the daily pivot of 99.64 but below the 1H EMA200 resistance at 100.52.

    Is Solana’s trend bullish or bearish?

    The daily structure remains technically bullish, with price above all three key EMAs. However, the daily MACD histogram at -1.3 signals fading momentum, creating a conflict between trend structure and momentum readings.

    What are the key support and resistance levels for $SOL?

    Immediate support sits at S1 (98.91) and the daily EMA20 (99.54). Deeper support lies at the daily EMA50 (93.08). Resistance levels include the 1H EMA200 (100.52), R1 (100.8), and the Bollinger mid-band (101.78).

    What does the MACD divergence mean for Solana?

    A bearish MACD divergence under a bullish trend structure often resolves with price correcting downward toward momentum. If $SOL fails to reclaim the 1H EMA200, a slide toward S1 at 98.91 or lower becomes more probable.


    Disclaimer: This article is for informational purposes only and does not constitute financial advice, an investment recommendation, or a solicitation to buy or sell any financial instrument or cryptocurrency. The analysis provided is not indicative of future results. Investing in crypto assets and financial markets carries a high risk of capital loss. Always do your own research (DYOR) and consult a qualified financial advisor before making any decision.

    Article produced with the assistance of artificial intelligence and reviewed by the editorial team.

  • Jupiter Token Falls 10% as $0.24 Support Breaks, Protocol Inflows Turn Negative

    Jupiter Token Falls 10% as $0.24 Support Breaks, Protocol Inflows Turn Negative

    Jupiter (JUP) suffered a sharp decline during the latest cryptocurrency sell-off as traders broadly reduced exposure to risk assets. The entire digital asset market came under heavy selling pressure, with most established coins recording significant losses.

    Jupiter Price Breaks Key Support

    Amid the bearish shift, JUP lost the $0.24 support level and fell to an intraday low of $0.20, dropping below its short-term 9-day and 21-day moving averages. At the time of writing, the token was trading near $0.21, down 10.2% on the daily chart. Trading volume rose 20% to $50 million over the same period, indicating heightened sell-side activity.

    Protocol Inflows Turn Negative

    Data from DefiLlama shows Jupiter’s USD inflows swung sharply negative, plummeting from $33 million to -$55 million. This reversal suggests a substantial outflow of capital from the network, confirming intense selling pressure.

    Derivatives Data Shows Reduced Exposure

    Futures market metrics from CoinGlass reinforce the risk-off narrative. Jupiter’s Open Interest declined 15% to $55.7 million, while derivatives volume fell 6% to $69 million. The drop in Open Interest signals that investors are actively closing positions and reducing leverage.

    Futures Netflows Signal Aggressive Panic

    According to CoinGlass, Jupiter futures recorded $16.8 million in outflows against $13.97 million in inflows. Netflows consequently collapsed 172% to -$2.8 million, a clear indicator of aggressive market panic and dominant bearish sentiment.

    Technical Outlook: Risk of Further Decline

    The TradingView Bulls vs. Bears indicator dropped to -49, reaching levels last seen in mid-August. A negative reading confirms that sellers have significantly outweighed buyers. If selling pressure persists and sentiment remains risk-averse, JUP could breach the $0.20 support and target $0.19. To invalidate this bearish structure, the price must close back above the short-term moving averages near $0.23.

    Summary

    • JUP declined 10%, breaking $0.24 support to hit a low of $0.20.
    • The drop was driven by strong selling pressure after sentiment turned risk-off, prompting investors to reduce exposure.
    • On-chain and derivatives data confirm capital outflows, falling Open Interest, and negative futures netflows.
    • Technical indicators remain bearish; a close above $0.23 is needed to shift the short-term outlook.
  • Analyst Predicts Bitcoin Could Surpass $90K by November on This Setup

    Analyst Predicts Bitcoin Could Surpass $90K by November on This Setup

    Bitcoin Analyst Predicts $90K by November Amid Bearish Sentiment

    Trader Matthew Hyland argues that Bitcoin is currently sitting at a daily cycle low with a bullish divergence forming on the charts, forecasting prices above $90,000 by early November. His call comes while BTC trades near $76,000, down sharply after the Senate failed to advance the CLARITY Act, and as the market’s most vocal participants remain predominantly bearish.

    Conflicting Technical Outlooks

    Posting on X, Hyland noted that bears were getting excited at what he considers a daily cycle low, with a bullish divergence setup forming underneath the price action.

    “See ya at $90k+ by early November,” he wrote.

    Swing trader Roman replied, “Yeah, part of me really thinks this was a low,” with Hyland acknowledging that the Relative Strength Index (RSI) could fall further, though he pointed to liquidity clustered around $75,000.

    “So far it was just a liquidity grab IMO,” he stated, adding that there was “not really much liquidity below” that level.

    Hyland added that current prices look solid to him, even though most bears still aren’t buying the bottom narrative and are hoping for a much deeper decline.

    That view contrasts sharply with more pessimistic calls on X. Analyst Ted Pillows highlighted that BTC has lost its 50-week Exponential Moving Average (EMA) and wrote:

    “a drop to $70K-$72K zone is highly likely before any reversal.”

    Fellow market watcher Crypto Patel has been tracking the bearish move since Bitcoin fell from $82,500 to roughly $74,900 following a rejection near an $83,000 bearish order block on the daily chart. He maintains a $50,000 target unless Bitcoin closes above $83,000 on a higher timeframe.

    On-Chain Data Points to Mid-Cycle Floor

    Taking a different approach, CryptoQuant contributor IT Tech focused on Bitcoin holdings rather than price structure. They observed that the 6- to 12-month supply band has climbed to 30.8% of realized cap, up from 16.2% in December last year—a pattern that aligned with the last three Bitcoin bottoms.

    The analyst characterized this as a bullish setup but stopped short of declaring it the cycle low outright, noting that the original cryptocurrency is still down nearly 40% from its peak.

    “this reads as mid-cycle floor building, not the cycle low.”

    CLARITY Act Failure Triggers Capitulation

    At the time of writing, BTC was trading near $76,000, down about 1.5% in 24 hours and nearly 5% over the past week, though still up close to 19% across the last 30 days.

    The decline follows Tuesday’s Senate vote, where cloture on the CLARITY Act failed to secure the 60 votes required to advance the legislation. As reported earlier by CryptoPotato, Bitcoin short-term holders sent more than 23,000 BTC to exchanges at a loss in the aftermath, totaling nearly $1.8 billion and marking the largest capitulation event in approximately a month.