Tag: Technical analysis

  • HYPE Token Drops From $98 Record High as Whales Signal Potential Deeper Selloff

    HYPE Token Drops From $98 Record High as Whales Signal Potential Deeper Selloff

    Key Highlights

    • Hyperliquid’s $HYPE token declined over 3% on September 24 to trade near $93.80, pulling back from a record high of $97.98 reached the previous day as Multicoin Capital moved another $12.15 million in tokens to Coinbase Prime.
    • Multicoin Capital has deposited approximately 4.23 million $HYPE worth $285 million to Coinbase Prime since July 28, while five other large addresses initiated unstaking of 983,600 $HYPE ($90.44 million) with a seven-day unlock period ending around October 1.
    • Derivatives data shows $3.30 million in long liquidations and a $74 million drop in open interest over two days, signaling leveraged position unwinding, though $HYPE remains up 18.4% on the week and holds above key exponential moving averages.

    Multicoin Capital Transfers Renew Selling Pressure on $HYPE

    Hyperliquid’s native token $HYPE retreated more than 3% during the September 24 session, slipping to approximately $93.80 after briefly dipping below $92 earlier in the day. The pullback interrupted a sharp rally that had carried the token to an all-time high of $97.98 on September 23, representing a roughly 25% surge from the September 17 level near $78. Despite the intraday decline, $HYPE retains substantial gains of 18.4% over the past seven days and 16.1% over the past 30 days, outperforming the broader cryptocurrency market which has also seen Bitcoin retreat from recent highs.

    The immediate catalyst for renewed selling concern came from onchain analytics platform Lookonchain, which reported that venture firm Multicoin Capital transferred another 130,331 $HYPE—valued at $12.15 million—to Coinbase Prime after a one-week pause in such transfers. Since July 28, Multicoin Capital has deposited approximately 4.23 million $HYPE worth an estimated $285 million to the institutional custody and execution platform. While transfers to Coinbase Prime do not confirm outright sales—the venue provides prime brokerage, custody, and execution services for institutional clients—the consistent flow of tokens from a single large holder has kept market participants focused on potential supply overhang.

    Large Holder Unstaking Adds to Supply Concerns

    Compounding the narrative, Lookonchain identified five addresses that began unstaking a combined 983,600 $HYPE worth approximately $90.44 million on September 24. The largest of these addresses initiated the unstaking of roughly 391,800 $HYPE valued near $36 million. Hyperliquid’s protocol imposes a mandatory seven-day waiting period on unstaking, meaning these tokens are not expected to become liquid until around October 1. This delayed timeline suggests any selling pressure from these specific positions would be staggered rather than immediate, though the sheer volume of tokens exiting staking contracts underscores a shift in large-holder positioning after the token’s rapid ascent.

    Derivatives Unwinding Accompanies Spot Pullback

    The spot price decline coincided with notable weakness in derivatives markets. Recent data indicates approximately $3.30 million in $HYPE long liquidations over 24 hours, accounting for roughly 93% of the token’s total liquidations during that period. Simultaneously, open interest fell by approximately $74 million over a two-day window. The combination of a falling price and declining open interest typically signals that leveraged long positions are being closed—either voluntarily or via forced liquidation—rather than new short positions being established. This dynamic suggests the current correction is being driven primarily by profit-taking and risk reduction among leveraged participants rather than aggressive new bearish bets.

    Technical Structure Remains Constructive Despite Near-Term Weakness

    Daily Timeframe: Uptrend Intact Above Key EMAs

    On the daily chart, $HYPE continues to trade well above its primary exponential moving averages despite the retreat from the $97.98 peak. At approximately $93.26, the token sits comfortably above the 20-day EMA at $87.12, while the 50-day, 100-day, and 200-day EMAs stand at $79.21, $71.24, and $60.50 respectively. The stacked ordering—each shorter EMA above the longer—remains a bullish configuration. The 20-day EMA near $87.12 represents the first major dynamic support if the pullback extends, with a daily close below that level bringing the 50-day EMA around $79.21 into focus, near the pre-breakout consolidation zone.

    The daily Relative Strength Index (RSI) has cooled to 62.84 after breaching the 70 overbought threshold during the late-September rally. While still above the neutral 50 level, the retreat from overbought territory confirms that buying momentum has eased meaningfully since the approach to $98.

    4-Hour Timeframe: Fibonacci Levels Frame Immediate Support and Resistance

    The shorter timeframe offers more granular levels around current prices. A Fibonacci retracement drawn from the September low at $75.19 to the recent high at $98.04 places the 23.6% retracement at $92.65. $HYPE was trading just above this level at approximately $93.34, making the $92.65 area the first support to watch. A decisive break below $92.65 would expose the 38.2% retracement at $89.31, followed by the 50% level at $86.62 and the 61.8% retracement at $83.92. A deeper correction could target the 78.6% level around $80.08.

    Momentum indicators on the four-hour chart have already turned bearish. The MACD line stood at 0.732, below the signal line at 1.319, with the histogram at minus 0.587. The negative histogram and bearish MACD crossover confirm that near-term momentum has shifted in favor of sellers following the rejection near the record high.

    Key Levels to Watch

    • Immediate Support: $92.65 (23.6% Fib retracement)
    • Secondary Support: $89.31 (38.2% Fib) / $86.60–$87.10 zone (50% Fib + 20-day EMA confluence)
    • Immediate Resistance: $94–$95 (recent consolidation area)
    • Upside Targets: $98.04 (record high) → $100 (psychological level)

    Holding above $92.65 would keep $HYPE in the upper portion of its recent range, leaving the door open for a recovery attempt toward $94–$95 and a potential retest of the $98.04 high. A clean break above the all-time high would put the psychological $100 level in play. Conversely, a failure at $92.65 opens the path toward the $89.31 and $86.62 Fibonacci levels, with the latter converging with the daily 20-day EMA to form a significant support zone around $86.60–$87.10.

    Why This Matters

    The $HYPE price action encapsulates a classic post-breakout dynamic: a rapid, low-float rally attracts speculative leveraged interest, large early backers begin distributing into strength, and the market digests the supply overhang through a correction that flushes excess leverage. Multicoin Capital’s sustained transfers to Coinbase Prime—totaling $285 million since late July—represent one of the largest identifiable distribution campaigns by a single institutional holder in the current cycle. Meanwhile, the coordinated unstaking by five large addresses signals that other major stakeholders are also preparing to reduce exposure or rebalance.

    For Hyperliquid, a high-performance decentralized perpetual exchange, $HYPE’s tokenomics tie staking rewards and governance to the platform’s fee revenue. The seven-day unstaking lock provides a structural buffer that prevents immediate dumping, but the sheer scale of tokens exiting staking (nearly 1 million $HYPE) suggests a meaningful shift in holder sentiment. The derivatives unwind—$74 million in open interest evaporation and 93% long liquidations—is a healthy reset that removes fragile positioning, potentially setting the stage for a more sustainable uptrend if spot demand reasserts itself at the 20-day EMA or Fibonacci confluence zones.

    Broader market context matters: Bitcoin’s simultaneous pullback from recent highs has weighed on risk appetite across crypto, and $HYPE’s outsized weekly gains (+18.4%) made it a natural candidate for profit-taking during a risk-off episode. The coming week will test whether the $86.60–$87.10 support zone holds and whether spot buyers step in to absorb the anticipated October 1 unlock supply.

    Frequently Asked Questions

    Has Multicoin Capital sold its $HYPE holdings?

    Not necessarily. Multicoin Capital has transferred approximately 4.23 million $HYPE worth $285 million to Coinbase Prime since July 28, but Coinbase Prime is an institutional custody and execution platform. Transfers to Prime do not confirm sales; the tokens may be held in custody, used for market-making, or deployed in other strategies. However, the consistent flow from a single large holder creates a perceived supply overhang that weighs on market sentiment.

    When will the unstaked $HYPE from the five large addresses become available for sale?

    Hyperliquid imposes a mandatory seven-day unstaking period. The unstaking transactions were initiated on September 24, meaning the approximately 983,600 $HYPE (worth ~$90.44 million) are expected to become liquid around October 1. They cannot be sold or transferred before the unlock completes.

    What are the key technical levels for $HYPE right now?

    On the 4-hour chart, the 23.6% Fibonacci retracement at $92.65 is the first support. A break below exposes $89.31 (38.2%) and the $86.60–$87.10 zone where the 50% Fibonacci level converges with the daily 20-day EMA. On the upside, $94–$95 is immediate resistance, followed by the all-time high at $98.04 and the psychological $100 level. The daily structure remains bullish as long as price holds above the 20-day EMA at $87.12.


  • Uniswap Holds Bullish at $9.50 Despite Market’s 4.86% Drop as Momentum Cools

    Uniswap Holds Bullish at $9.50 Despite Market’s 4.86% Drop as Momentum Cools

    Key Highlights

    • Uniswap ($UNI) holds at $9.50 USDT despite a 4.86% decline in total crypto market capitalization over 24 hours, trading well above its EMA20 ($7.55), EMA50 ($6.06), and EMA200 ($4.54) — a clean bullish stack on the daily timeframe.
    • Daily indicators flash overbought warnings: RSI at 71.76 and price pressing against the upper Bollinger Band ($9.95) suggest a pullback is probable, even as MACD remains positive with a 0.24 histogram.
    • Short-term momentum is fading across lower timeframes: 1-hour RSI at 42.36 and 15-minute RSI at 36.69 with negative MACD histograms confirm cooling participation, converging on a critical support cluster at $9.44.

    Market Context: UNI Defies Broad Crypto Sell-Off

    The broader cryptocurrency market contracted sharply on September 23, 2026, shedding 4.86% of its total capitalization in a single day. Against that backdrop, Uniswap’s native token $UNI demonstrated relative resilience, holding at 9.50 USDT. This divergence creates a decisive moment for the asset: the daily trend structure remains firmly bullish, yet shorter timeframes signal that buying pressure is exhausting, leaving traders to weigh whether the token can sustain its premium or must concede to the prevailing market gravity.

    Bitcoin dominance at 58.77% underscores a defensive rotation toward the market’s largest asset, a dynamic that historically pressures altcoins. For Uniswap, the tension is visible in the discrepancy between a daily chart that screams continuation and intraday charts that show sellers testing the floor.

    Daily Chart: Bullish Structure Meets Overbought Conditions

    On the daily timeframe, $UNI trades comfortably above a perfectly stacked moving average hierarchy: the EMA20 at 7.55, EMA50 at 6.06, and EMA200 at 4.54. This alignment typically signals a sustained uptrend rather than a counter-trend bounce. The MACD reinforces the constructive bias, with the line at 1.13 above the signal at 0.88 and a positive histogram of 0.24.

    However, two warning signs temper the optimism. The Relative Strength Index sits at 71.76, deep in overbought territory where continuation becomes statistically less probable. Simultaneously, price is hugging the upper Bollinger Band at 9.95 (mid-band 7.36, lower band 4.77). When an asset rides the upper band this tightly, even a brief pause often triggers a reversion toward the mean. A daily Average True Range of 0.93 confirms that near-dollar swings are normal, making a move toward the daily pivot support at 8.82 structurally insignificant in isolation — but meaningful if it coincides with a breakdown of shorter-term structure.

    Intraday Timeframes Signal Cooling Momentum

    1-Hour Chart: A Textbook Cooling-Off Pattern

    The 1-hour chart reveals a clear loss of upside momentum. Price at 9.50 now sits below the 1H EMA20 at 9.83 but remains above the EMA50 at 9.54 — a classic cooling-off formation after an extended advance. The RSI has retreated to a neutral 42.36, while the MACD histogram has flipped negative to -0.15 (line 0.04, signal 0.19).

    Bollinger Bands on this timeframe (upper 10.96, mid 10.08, lower 9.20) show price drifting toward the lower half of its recent range. A tight pivot cluster — resistance at 9.54 (R1) and support at 9.44 (S1) — creates a narrow battleground for the next directional move.

    15-Minute Chart: Sellers Testing the Floor

    The 15-minute view confirms defensive price action. $UNI trades below both the EMA20 (9.65) and EMA50 (9.87), with RSI at 36.69 and MACD essentially flat and negative at -0.19. This represents intraday chop rather than a decisive breakdown, but it validates that momentum has turned defensive in the very short term.

    Critically, the 15-minute pivot support at 9.44 aligns almost exactly with the 1-hour S1, making this level a confluence zone. A clean break on strong volume would carry outsized significance precisely because multiple timeframes agree on its importance.

    On-Chain Data Confirms Activity Slowdown

    DefiLlama fee data provides fundamental corroboration for the technical cooling. Uniswap V3 fees fell 38.52% in the last 24 hours and are down 8.9% over seven days. Meanwhile, Uniswap V4 fees dropped 10.99% daily but remain up 69.89% over 30 days.

    This divergence suggests a slow migration of activity toward the newer V4 protocol even as overall trading volume has cooled sharply in the near term. The fee slowdown across both versions mirrors the lower-timeframe technicals: less aggressive participation, consistent with a market taking a breath rather than making a decisive directional bet.

    Competing Scenarios: Key Levels to Watch

    Bullish Case Intact Above Structural Supports

    The bullish scenario remains valid as long as the daily uptrend structure holds. Buyers must defend the 1-hour EMA50 near 9.54 and, more critically, prevent a break below the daily pivot support at 8.82. A successful defense could see price target the daily R1 at 10.56, with the upper Bollinger Band at 9.95 as the first real test.

    Given the overbought daily RSI, any fresh leg higher would require genuine volume conviction rather than a thin, low-liquidity push — otherwise it risks simply re-testing the overbought ceiling without follow-through.

    Bearish Case Gains Traction Below $9.44

    The bearish thesis gains credibility if price cleanly loses the 9.44 confluence support. A decisive break would open the path toward the daily EMA20 at 7.55 and the Bollinger mid-band at 7.36 — a far deeper retracement than the current cooling phase suggests. This is well within normal volatility bounds given the daily ATR of 0.93 and ample room for RSI to unwind from 71.76 toward neutral.

    The scenario becomes more probable if broader market weakness persists. With capital rotating defensively (evidenced by BTC dominance at 58.77%), altcoins tend to underperform, and $UNI would not be immune to that dynamic.

    Why This Matters

    Uniswap remains the dominant decentralized exchange protocol by volume and liquidity, making $UNI a bellwether for DeFi sentiment. The current technical tension — a structurally bullish daily trend colliding with exhausted short-term momentum amid broad market risk-off — encapsulates the broader dilemma facing major altcoins in late 2026: whether protocol fundamentals and fee revenue migration (V3 to V4) can sustain valuations when macro liquidity tightens.

    The convergence of the 1-hour and 15-minute pivot supports at 9.44 represents a rare multi-timeframe agreement that lowers noise and raises the signal-to-noise ratio for traders. A hold here with volume renewal could signal that the uptrend has simply digested overbought conditions; a break would suggest the daily structure is vulnerable to a deeper mean reversion toward the EMA20/EMA50 zone. For market participants, the next 24–48 hours of price action at these levels will likely define the token’s trajectory through Q4 2026.

    Frequently Asked Questions

    What does the daily chart show for $UNI right now?

    The daily trend for $UNI remains firmly bullish as of September 23, 2026. Price trades well above the EMA20 at 7.55, EMA50 at 6.06, and EMA200 at 4.54, forming a clean bullish stack. However, RSI at 71.76 signals overbought conditions that increase the likelihood of a short-term pullback, even as the MACD histogram remains positive at 0.24.

    What are the key support levels for $UNI right now?

    The most immediate support sits at 9.44, where both the 1-hour and 15-minute pivot supports converge. Below that, the daily pivot support at 8.82 represents a more significant structural level. A break below 9.44 would open the path toward the daily EMA20 at 7.55 and the Bollinger mid-band at 7.36, representing a deeper retracement.

    Is short-term momentum for Uniswap bullish or bearish?

    Short-term momentum has turned defensive but is not yet bearish. On the 1-hour chart, RSI sits at a neutral 42.36 and the MACD histogram has flipped negative at -0.15. The 15-minute chart shows similar weakness with RSI at 36.69. These readings suggest cooling rather than reversal, with price still holding above the key support cluster at 9.44.

    Disclaimer: This article is for informational purposes only and does not constitute financial advice, an investment recommendation, or a solicitation to buy or sell any financial instrument or cryptocurrency. The analysis provided is not indicative of future results. Investing in crypto assets and financial markets carries a high risk of capital loss. Always do your own research (DYOR) and consult a qualified financial advisor before making any decision.

  • DOGE Rally Accelerates as Price Hits Multi-Month High

    DOGE Rally Accelerates as Price Hits Multi-Month High

    Key Highlights

    • Dogecoin surged to an intraday high of $0.1059 before settling near $0.09986, a 1.04% gain over 24 hours, putting the psychological $0.10 resistance level in focus.
    • X (formerly Twitter) launched its Cashtag trading integration with Coinbase, Kraken, Gemini, Moomoo, and Interactive Brokers, creating a direct pipeline from social discussion to trade execution for U.S. users.
    • Despite bullish momentum signals from derivatives activity and a rising RSI, the 50-day EMA remains below the 200-day EMA, preserving a longer-term bearish moving-average structure that requires sustained buying to reverse.

    Dogecoin Extends Recovery as X Cashtag Trading Links Go Live

    Dogecoin ($DOGE) pushed to its highest intraday level in months on Tuesday, briefly touching $0.1059 before consolidating around $0.09986—a 1.04% advance over the prior 24 hours. The rally brought the psychologically significant $0.10 threshold back into immediate range, fueling renewed speculative interest across spot and derivatives markets. Volume data from major exchanges showed elevated participation, with the token’s market capitalization climbing back toward the $14.5 billion mark as buyers stepped in ahead of the weekly options expiry.

    X Cashtag Integration Creates New Distribution Channel

    The catalyst coincides with the public rollout of X‘s Cashtag trading program, which now surfaces real-time market data and a “Trade” button next to supported tickers—including $DOGE—for users in the United States. Clicking the button redirects traders to one of five integrated brokerages: Coinbase, Kraken, Gemini, Moomoo, and Interactive Brokers. The feature does not constitute native wallet integration or payment functionality on the social platform, but it dramatically shortens the latency between financial discourse, price discovery, and order placement.

    Given Elon Musk‘s years-long public endorsement of Dogecoin—including past references to it as “the people’s crypto” and his acquisition of X itself—the Cashtag rollout is widely interpreted by market participants as a structural tailwind. Analysts note that while no formal payment integration has been announced, the mere presence of a one-click trade pathway on the platform where Dogecoin narratives originate represents a meaningful distribution advantage over assets lacking similar social-graph exposure.

    Derivatives Activity Amplifies Price Action

    Futures markets added a second layer of momentum. Perpetual swap contracts on Binance, Bybit, and OKX recorded a sharp uptick in open interest, rising over 12% in the last two sessions to exceed $650 million in notional value. Funding rates flipped positive across major venues, signaling that leveraged longs are willing to pay a premium to maintain exposure. This derivatives bid can accelerate upside moves during low-liquidity windows, but it also raises the risk of cascading liquidations if price reverses below key support near $0.095.

    Technical Signals Point to a Key Test of Moving-Average Structure

    Short-Term Momentum Improves, Longer-Term Hurdle Remains

    On the daily chart, the Relative Strength Index (RSI) climbed to 62, placing it at the upper boundary of the neutral-to-bullish zone, while the Average Directional Index (ADX) held above 25—a threshold typically associated with a confirmed trending environment. These readings confirm that buying pressure has intensified and that the current leg higher possesses directional conviction.

    However, the macro structure remains cautious. The 50-day Exponential Moving Average (EMA) continues to trade below the 200-day EMA, maintaining the bearish crossover—commonly referred to as a “Death Cross”—that formed during the prolonged decline from the 2024 highs. A sustainable trend reversal would require $DOGE to reclaim both moving averages and, critically, to flip the 200-day EMA into support. Until that occurs, rallies toward $0.11–$0.12 are vulnerable to distribution by longer-term holders who have been underwater since the prior cycle peak.

    Psychological Resistance at $0.10 Draws Algorithmic Attention

    Order-book analysis shows a cluster of sell-limit orders stacked between $0.100 and $0.102, alongside concentrated stop-loss buy orders just above $0.105. This liquidity magnet explains the sharp rejection from the $0.1059 intraday high and suggests that a clean break above $0.106 could trigger a short-covering squeeze toward the next volume node near $0.112. Conversely, failure to hold the $0.095–$0.097 demand zone would likely invite a retest of the 50-day EMA near $0.092.

    Why This Matters

    The convergence of a major social-media distribution upgrade (X Cashtags), heightened derivatives participation, and improving short-term technicals creates a rare alignment of fundamental, structural, and technical catalysts for Dogecoin. For retail traders, the Cashtag integration lowers the friction of converting social sentiment into positions, potentially accelerating reflexive price-action loops that meme assets are prone to exhibit. For institutional desks, the elevated open interest and positive funding rates signal that professional capital is actively engaging with the long side, not merely providing liquidity.

    However, the persistent 50/200-day EMA bear cross serves as a reminder that Dogecoin has not yet transitioned into a confirmed macro uptrend. The next two to three weeks—encompassing the monthly options expiry, U.S. CPI data, and potential Federal Reserve policy signals—will determine whether the current bounce matures into a trend reversal or fades into another lower-high sequence. Market participants should monitor the $0.095 support and the 200-day EMA (currently ~$0.108) as the critical battlegrounds for that decision.

    Frequently Asked Questions

    What is the X Cashtag trading feature and which brokers are connected?

    X Cashtags now display live market data and a “Trade” button for supported tickers, redirecting U.S. users to Coinbase, Kraken, Gemini, Moomoo, or Interactive Brokers to execute orders. The feature is informational and transactional via partner platforms, not a native X wallet or payment system.

    Why does the 50-day EMA below the 200-day EMA matter for Dogecoin?

    This “Death Cross” formation signals that the medium-term trend remains bearish relative to the long-term trend. Until $DOGE closes sustainably above both moving averages and flips the 200-day EMA into support, rallies are considered counter-trend and carry higher risk of reversal.

    How are derivatives influencing Dogecoin’s current price action?

    Open interest in perpetual futures has surged above $650 million with positive funding rates, indicating aggressive long positioning. This leveraged bid can amplify upside moves but also creates liquidation clusters below $0.095 that could accelerate a correction if triggered.

  • XRP Surges 8.7% as Peter Brandt’s Chart Analysis Points to $5.40 Target

    XRP Surges 8.7% as Peter Brandt’s Chart Analysis Points to $5.40 Target

    Key Highlights

    • Veteran trader Peter Brandt projects XRP could reach $5.40 based on long-term monthly chart analysis, implying approximately 251% upside from current levels.
    • XRP surged 8.7% to $1.54 in 24-hour trading, reaching a session high of $1.57 before pulling back, with the token trading in an 11% range between $1.41 and $1.57.
    • Institutional developments accelerated as South African banking giant Absa launched digital asset custody built on Ripple technology, while the U.S. Senate rejected cloture on the CLARITY Act in a 49-50 vote.

    Peter Brandt’s Technical Analysis and $5.40 Price Target

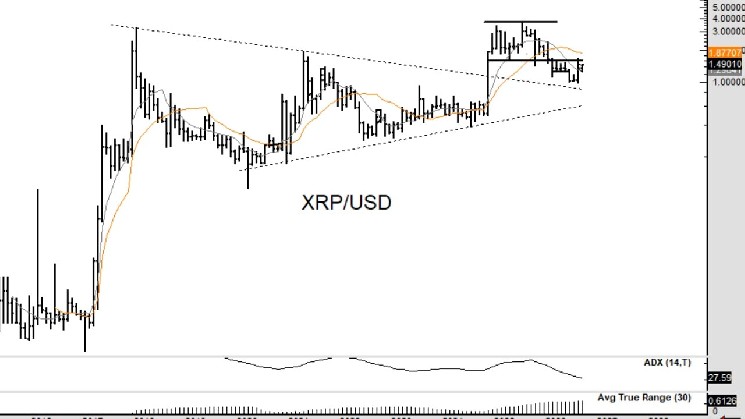
    Veteran commodity trader Peter Brandt shared a bullish long-term projection for XRP on September 21, posting a monthly chart on X that he says implies an eventual advance to $5.40. The target would represent a substantial premium over recent trading ranges, requiring approximately 251% appreciation from the $1.54 level where XRP traded at the time of publication.

    Brandt, who entered the commodity trading business in 1976 and founded Factor Trading in 1980, emphasized the distinction between a public chart presentation and an executed trade. “This is my long-term chart of $XRP It implies an eventual advance to $5.40.” he wrote. “A claim of a ‘call’ or simple presentation of a chart is $NOT a trade. People who claim ‘trades’ need to provide proof or else the claims are BS. An X post is $NOT proof,” he added. His use of the term “eventual” frames the $5.40 objective as a long-term technical target rather than a near-term prediction, and he explicitly noted that proving an actual trade would require verifiable records showing entry, exit, and result.

    XRP Price Action and Market Performance

    Bitcoin.com Markets data confirmed XRP trading at $1.54, up 8.7% or $0.12 over the preceding 24 hours. The token established a session low of $1.41 early in the period before climbing steadily through most of the trading day. The advance peaked at $1.57 late in the session, after which XRP eased back to the $1.54 level, leaving it approximately 2% below its 24-hour high and roughly 9% above its low. The session’s full trading range spanned about 11% from low to high, reflecting heightened volatility accompanying the price discovery.

    Institutional Infrastructure Expansion and Regulatory Context

    The price rally coincided with significant institutional infrastructure developments. South African lender Absa, one of Africa’s largest banking groups, launched Absa Digital Asset Custody on September 21, built on Ripple’s custody technology. The launch occurred 11 months after Ripple and Absa announced their partnership, marking a concrete step in institutional adoption across the African continent.

    Asset manager 21Shares outlined a four-pillar investment case for XRP centered on regulatory clarity, institutional access, measurable utility, and fixed supply. The firm noted that while expanding XRP Ledger (XRPL) activity may not directly translate into sustained XRP demand, growing network activity could support demand through transaction fees, account reserves, and bridge transfers. 21Shares cited approximately $4 billion in tokenized assets and roughly $1.6 billion in RLUSD supply, with more than half circulating on the XRPL.

    On the regulatory front, the U.S. Senate rejected cloture on the CLARITY Act in a 49-50 vote. Ripple maintained that the failed vote did not alter XRP’s established legal position or disrupt demand across payments, stablecoins, and institutional markets, suggesting the token’s regulatory framework remains intact despite legislative setbacks.

    Why This Matters

    The convergence of technical analysis from a respected veteran trader, meaningful price appreciation with elevated volume, and tangible institutional infrastructure deployment creates a multi-layered bullish narrative for XRP. Brandt’s $5.40 target, while framed as a long-term technical implication rather than a trading recommendation, draws attention to the monthly chart structure that has historically preceded major trend advances in commodity and digital asset markets. The Absa custody launch demonstrates Ripple’s expanding institutional footprint beyond North America into African financial markets, while 21Shares’ analytical framework highlights the fundamental metrics—institutional access, on-chain utility, and regulatory standing—that professional allocators increasingly prioritize. The Senate’s CLARITY Act outcome, while a legislative disappointment for broader crypto regulatory clarity, appears to have had minimal immediate market impact on XRP specifically, reinforcing Ripple’s assertion that the token’s legal classification is settled. Market participants will likely monitor whether XRP can sustain above the $1.50 psychological level and build a higher base for the next leg toward Brandt’s long-term projection.

    Frequently Asked Questions

    What is Peter Brandt’s track record in technical analysis?

    Peter Brandt has over 45 years of commodity trading experience, founding Factor Trading in 1980 after beginning his career in 1976. He has managed institutional trading operations and authored two books on commodity trading and classical chart patterns, establishing him as a recognized authority in traditional technical analysis applied to digital assets.

    Does the Absa Digital Asset Custody launch directly increase XRP demand?

    Not necessarily. The custody service is built on Ripple’s technology infrastructure, but 21Shares notes that expanding XRPL activity may not translate directly into sustained XRP demand. However, the firm argues that growing network activity could support demand indirectly through transaction fees, account reserves, and bridge transfer mechanisms on the ledger.

    How significant was the Senate CLARITY Act vote for XRP specifically?

    According to Ripple, the failed cloture vote on the CLARITY Act did not change XRP’s established legal position or disrupt demand across its core use cases in payments, stablecoins, and institutional markets. The token’s regulatory classification remains intact regardless of the legislative outcome.

  • Bitcoin Hits $87,000: How High Can BTC Go?

    Bitcoin Hits $87,000: How High Can BTC Go?

    Key Highlights

    • Bitcoin has broken above its 50-week moving average (~$78,320) and the May swing high, confirming a five-wave Elliott Wave structure from the July low that signals a sustained uptrend rather than a counter-trend bounce.
    • The cryptocurrency has reached the pattern’s minimum target near $85,000, with primary upside objectives between $88,600 and $92,220 and an extended target at $97,637 if momentum persists.
    • A bearish RSI divergence has emerged—price making higher highs while momentum prints lower peaks—warning that the rally may be approaching exhaustion, though an immediate reversal is not guaranteed.

    Bitcoin Confirms Five-Wave Advance From July Low

    Bitcoin has cleared two critical technical thresholds this week, piercing its 50-week moving average—currently anchored near $78,320—and eclipsing the previous swing high established in May. According to a chart analyst tracking the structure, this breakout validates a completed five-wave Elliott Wave sequence that originated from the July trough. The formation is widely regarded in technical circles as evidence of a genuine impulsive trend rather than a corrective rebound, suggesting the dominant bias has shifted decisively to the upside.

    Anatomy of the Impulsive Structure

    The analyst detailed how this specific wave progression typically unfolds across five distinct phases. The advance begins subtly, with the initial leg higher passing largely unnoticed by the broader market. A protracted, sideways consolidation follows—the second wave—which erodes interest and convinces many participants that no meaningful move is underway. The third wave then erupts aggressively, trapping latecomers and short-sellers who are forced to chase the move. A second pause, the fourth wave, precedes a final fifth-wave push that requires comparatively less fresh capital because the majority of interested buyers have already committed.

    Projected Price Targets and the $85,000 Milestone

    Bitcoin has already tagged the pattern’s minimum measured-move objective around $85,000, a level the analyst characterized as a “weak outcome” given the structure’s implications. A more robust fulfillment zone sits between $88,600 and $92,220, while an extended Fibonacci projection places the upper bound near $97,637 should the rally accelerate into a lengthened fifth wave. These levels are derived from standard Elliott Wave measurement techniques applied to the completed July-to-present sequence.

    Momentum Divergence Raises Caution Flag

    Despite the constructive price action, a subtle but notable warning has appeared on the Relative Strength Index (RSI), a momentum oscillator that gauges buying pressure. The indicator has printed a lower high even as Bitcoin’s price registered a higher high—a configuration known as bearish divergence. This discrepancy often materializes near the terminal phase of a strong advance, signaling that internal momentum may be waning. The analyst emphasized that divergence alone does not precipitate an immediate top; rather, it serves as an alert that the probability of a pause or pullback is rising.

    Pullback Expectations and Key Support Zones

    A consolidation or retracement following a five-wave advance is considered normal market mechanics, not a structural failure. The analyst noted Bitcoin could conceivably hold above the 50-week moving average near $78,320, transforming the former resistance into support. Should a deeper correction materialize, a broader demand zone around $75,000 was flagged as a reference area where buyers may re-engage—explicitly described as a contextual zone, not a downside price target.

    Near-Term Invalidation and Upside Trigger Levels

    On shorter timeframes, Bitcoin has completed a smaller five-wave rally from the September 15 low. The pivotal level to monitor is $80,120; a sustained defense of this price preserves the immediate uptrend, while a confirmed breakdown would constitute the first tangible evidence that a local top is in place. Immediate support clusters between $80,566 and $82,985, with the $82,800 region highlighted as a likely retest candidate. A successful hold and renewed advance from that zone would open the path toward $88,900 as the next actionable objective.

    Why This Matters

    The completion of a textbook five-wave structure on the weekly timeframe carries weight beyond individual price targets—it informs portfolio positioning for institutional and retail participants alike. A confirmed impulsive sequence from a major low (July) suggests the cyclical bear market narrative has been invalidated, potentially unlocking a new wave of capital allocation toward digital assets. However, the concurrent RSI divergence introduces a tactical risk: trend-followers may need to manage position sizing and tighten trailing stops as the rally matures, while counter-trend traders should await price confirmation—such as a break of $80,120—before committing to short exposures. The $75,000–$78,320 band will likely define the “buy-the-dip” region if the market transitions from trend expansion to consolidation.

    Frequently Asked Questions

    Has Bitcoin already reached its peak for this cycle?
    Not necessarily. The analyst’s wave count indicates the minimum target ($85,000) has been met, but the primary target zone ($88,600–$92,220) and extended target ($97,637) remain intact. A bearish RSI divergence warns of slowing momentum, but divergences can persist during strong fifth waves and do not alone confirm a top.
    What price level would invalidate the current bullish structure?
    A confirmed break below $80,120 on the shorter timeframe would signal the immediate uptrend from the September 15 low has ended. On the larger structure, a breakdown beneath the 50-week moving average near $78,320—and especially a move toward the $75,000 support zone—would raise questions about the integrity of the five-wave advance.
    Is the $75,000 level a price target for a crash?
    No. The analyst explicitly stated the $75,000 area is a “reference zone” for where buyers may return if a deeper pullback occurs, not a forecast or downside objective. It represents a historical confluence area, not a prediction of decline.
  • Bitcoin Clears Key Hurdle That Historically Preceded Major Bull Runs

    Bitcoin Clears Key Hurdle That Historically Preceded Major Bull Runs

    Key Highlights

    • Bitcoin closed the week ended September 20 above its 50-week moving average for the first time in 45 weeks, signaling a potential trend reversal.
    • The cryptocurrency gained nearly 6% during the week, trading around $81,000 and extending its rebound to 29% over the past 35 days.
    • Galaxy Research Head Alex Thorn described the weekly close above the key moving average as “a potentially important confirmation that the market’s bear phase may have run its course and a new uptrend is upon us.”

    Bitcoin Breaks 45-Week Barrier Above Critical 50-Week Moving Average

    Bitcoin (BTC) has cleared a major technical hurdle that had resisted bullish attempts for nearly a year. For the first time since late 2023, the world’s largest cryptocurrency posted a weekly close above its 50-week moving average, a development market analysts are interpreting as a potential confirmation that the prolonged bearish phase has concluded.

    The weekly candlestick close—recorded at 23:59 UTC on Sunday, September 20—shows Bitcoin settling around $81,000 after a weekly gain of nearly 6%. This advance extends the asset’s recovery to approximately 29% over the preceding 35-day period. Unlike previous instances where price action briefly pierced the moving average only to retreat, this week’s candle closed decisively above the indicator, a distinction technical analysts consider significant for trend validation.

    Why the Weekly Close Carries More Weight Than Intraday Tests

    Bitcoin trades continuously across global exchanges, but technical analysis frameworks rely on defined session closes—daily at 00:00 UTC and weekly at 23:59 UTC on Sundays—to construct candlestick charts. A weekly close above a major moving average carries substantially more analytical weight than an intraday or intraweek breach that fails to hold into the close.

    The 50-week moving average represents the arithmetic mean of weekly closing prices over roughly the past year. In Bitcoin market analysis, this metric serves as a widely watched proxy for the asset’s long-term trend direction. When price action sustains above this level on a weekly basis, it historically correlates with the early stages of sustained uptrends; conversely, extended periods below the average typically coincide with bearish or consolidation phases.

    Analyst Perspective: Galaxy Research Signals Trend Shift

    Commenting on the technical development, Galaxy Research Head of Research Alex Thorn characterized the weekly close as “a potentially important confirmation that the market’s bear phase may have run its course and a new uptrend is upon us.” Thorn’s assessment underscores the significance market participants attach to the 50-week average as a regime-change indicator rather than merely a short-term support or resistance level.

    Galaxy Digital, the financial services and investment management firm founded by Mike Novogratz, operates Galaxy Research as its dedicated market analysis division. The firm’s commentary often influences institutional sentiment given its focus on digital asset markets and its position as a bridge between traditional finance and the cryptocurrency ecosystem.

    Why This Matters

    The 50-week moving average breach represents more than a standalone technical signal; it occurs against a backdrop of evolving macroeconomic conditions, including anticipated shifts in global monetary policy and growing institutional adoption through spot exchange-traded products in major markets. A sustained weekly close above this threshold could attract trend-following capital allocation strategies that use the 50-week average as a systematic entry filter. However, market structure analysts caution that the true test lies in whether Bitcoin can convert the former resistance into support during subsequent weekly candles, particularly if macroeconomic volatility prompts risk-off sentiment across broader financial markets.

    Frequently Asked Questions

    What is the 50-week moving average and why is it significant for Bitcoin?

    The 50-week moving average calculates the average weekly closing price of Bitcoin over approximately the past year. Technical analysts use it as a long-term trend indicator; sustained trading above it typically signals a bullish regime, while extended periods below suggest bearish or consolidation conditions.

    How does a weekly candle close differ from an intraday price move?

    A weekly candle closes at 23:59 UTC every Sunday, capturing the full week’s price action. Analysts consider a weekly close above a key level more reliable than an intraday breach because it reflects sustained conviction across all global trading sessions rather than a temporary liquidity-driven spike.

    What was Bitcoin’s price performance during the week of this breakout?

    Bitcoin rose nearly 6% during the week ended September 20, closing around $81,000. This weekly gain contributed to a broader 29% rebound over the preceding 35-day period.

  • CASHCAT Falls 30%, Yet Key Support Level Historically Triggers Rallies

    CASHCAT Falls 30%, Yet Key Support Level Historically Triggers Rallies

    Key Highlights

    • CashCat ($CASHCAT) plummeted roughly 30% in 24 hours as broader cryptocurrency market capital shrinkage triggered a breach of structural horizontal resistance.
    • Price has fallen into the lower support of a rising bullish channel — a level that has historically catalyzed rebounds — while Money Flow Index (MFI) surges to 35.5, signaling capital inflow.
    • Funding Rate remains positive at 0.0078% with net long positioning and spot market net buying, suggesting the drop is sentiment-driven rather than a structural bearish shift.

    CashCat Tests Critical Channel Support After 30% Correction

    CashCat ($CASHCAT) surrendered significant ground over the past 24 hours, declining approximately 30% as a wave of capital contraction swept across the wider cryptocurrency market. According to chart analysis from TradingView, the sell-off accelerated after price broke below a structural horizontal resistance line, pushing the memecoin down to the lower boundary of a broader rising bullish channel. Despite the sharp pullback, the asset remains embedded within an overall bullish pattern defined by oscillation between established upper resistance and lower support levels.

    Historical Support Zone Draws Buying Interest

    The current support level now being tested has acted as a launchpad for rallies on multiple prior occasions. Technical analysts note that price arriving at this zone increases the probability of a rebound, provided the prevailing fractal structure holds. On-chain and derivative metrics reinforce this view: the Money Flow Index (MFI), which tracks capital inflow and market bias, has surged to roughly 35.5. The uptick suggests that as price reached channel support, buy orders were triggered, injecting fresh liquidity into the market even as the broader correction unfolded.

    Bearish Momentum Peaks, But Derivatives Signal Resilience

    Short-term momentum indicators still favor sellers. The Bull Bear Power metric — a gauge of which side controls the market — shows bears dominant, with the red histogram bar printing its deepest level since September 10. However, derivative market structure tells a more nuanced story. Data from CoinGlass reveals the Funding Rate has dipped only marginally, holding at a positive 0.0078%. This reading indicates the majority of open contracts remain long. Simultaneously, spot market netflow has registered net buying, underscoring that the recent price decline stems primarily from sentiment deterioration rather than a fundamental shift in market structure.

    Why This Matters

    CashCat’s price action illustrates a classic memecoin dynamic: violent sentiment-driven corrections within intact longer-term technical frameworks. The convergence of a historically reliable channel support, rising MFI, positive funding rates, and spot accumulation creates a high-probability setup for a relief bounce — provided Bitcoin and the broader risk complex stabilize. Traders and investors should monitor whether the Bull Bear Power histogram begins to contract from its current extreme, which would signal exhausting selling pressure. A reclaim of the breached horizontal resistance would further validate the bullish channel thesis, while a decisive close below channel support would invalidate the pattern and open the door to deeper losses.

    Frequently Asked Questions

    What caused CashCat’s 30% price drop in the last 24 hours?

    The decline was triggered by broad cryptocurrency market capital shrinkage and a breach of a structural horizontal resistance line, pushing price into the support level of a rising bullish channel.

    Does the current technical setup favor a rebound?

    Yes. Price is testing a channel support that has sparked rallies before, MFI is rising at 35.5 showing capital inflow, Funding Rate remains positive at 0.0078% with net long positioning, and spot netflow shows buying — all suggesting the drop is sentiment-driven, not structural.

    What would invalidate the bullish case for CashCat?

    A decisive daily close below the rising channel’s lower support trendline would break the bullish pattern and likely lead to further downside.

  • Why AVAX’s Rally Must Pass This ‘Structural Test’ on the Charts

    Why AVAX’s Rally Must Pass This ‘Structural Test’ on the Charts

    Key Highlights

    • Avalanche (AVAX) posted a double-digit daily surge exceeding 12%, but a 1-month Liquidation Heatmap from CoinGlass reveals limited upside liquidity clusters above current price levels.
    • Multiple deep downward liquidity clusters below the press-time price create magnetic pull toward lower levels, making the rally vulnerable without sustained momentum.
    • Accumulation/Distribution data shows heavy buying volume at 122 million, yet the Aroon Indicator on TradingView signals only weak bullish conviction with minimal separation between Aroon Up and Aroon Down lines.

    AVAX Rally Faces Liquidity Headwinds Despite Double-Digit Gains

    Avalanche (AVAX) has recently displayed clear bullish tendencies, recording a daily price surge of more than 12%. However, technical analysis derived from the 1-month Liquidation Heatmap on CoinGlass casts doubt on the sustainability of this uptrend. The heatmap indicates a near absence of upside liquidity clusters above the current market price, while simultaneously revealing multiple high-depth clusters positioned below it. In derivatives markets, these clusters represent concentrations of unfilled orders that frequently act as magnets, drawing price action toward them.

    Downside Magnetic Pull Threatens Recent Gains

    The structural imbalance in liquidity creates two divergent scenarios for AVAX. With limited to no upside clusters, further appreciation would depend almost entirely on continued momentum and aggressive buying pressure. Conversely, the pronounced downward clusters exert gravitational pull, increasing the probability that price could be drawn lower and erase the recent gains. This dynamic leaves the current rally in a fragile state, where the path of least resistance may be to the downside unless fresh catalysts emerge.

    Accumulation Surges but Trend Confirmation Remains Weak

    On-chain and volume data paint a mixed picture. The Accumulation/Distribution Indicator (A/D) on TradingView shows massive buying activity, with volume-weighted purchases hitting 122 million. Elevated accumulation typically signals positive investor sentiment and near-term bullish expectations. However, the Aroon Indicator—which plots Aroon Up (orange) and Aroon Down (blue) to gauge directional bias—confirms only a marginal bullish tilt. Aroon Up sits above Aroon Down, yet the gap between the two lines is minimal. A robust bullish confirmation would typically require Aroon Up at 100% and Aroon Down at 0%, a threshold not currently met.

    Structural Resistance at the Lower High

    Price action analysis highlights a critical technical hurdle: the lower high formed during prior weeks’ bearish leg. For the bullish structure to gain credibility, AVAX must achieve a decisive daily close above this level. Such a close would invalidate the recent downtrend and neutralize the structural lower high. Until that occurs, the market lacks a clear directional signal, and the risk of a reversion toward the deep liquidity clusters below remains elevated.

    Why This Matters

    The interplay between liquidity topology and momentum indicators underscores a recurring theme in altcoin markets: sharp, news-driven or sentiment-driven spikes often lack the structural scaffolding—specifically, stacked upside liquidity—to sustain advances. For AVAX, the 12% daily gain, while notable, has not yet been accompanied by the order-book architecture or trend-strength metrics that typically underpin durable uptrends. Traders and investors monitoring CoinGlass heatmaps and TradingView oscillators should watch for a daily close above the lower high as the primary confirmation signal; absent that, the probability favors a drift toward the high-density liquidity zones below current price.

    Frequently Asked Questions

    What does the CoinGlass Liquidation Heatmap show for AVAX?

    The 1-month heatmap reveals limited to no upside liquidity clusters above the current price, while multiple deep clusters exist below. These downside clusters act as magnets that could pull price lower, making the recent rally vulnerable without sustained buying pressure.

    How strong is the bullish signal from the Aroon Indicator?

    The Aroon Indicator on TradingView shows Aroon Up above Aroon Down, confirming a technical bullish bias, but the gap between the lines is minimal. A convincing bullish trend would typically require Aroon Up at 100% and Aroon Down at 0%, which is not currently the case.

    What price level must AVAX clear to confirm a structural trend change?

    AVAX needs a decisive daily close above the recent lower high. Clearing this level would nullify the prior bearish leg and the downtrend structure, providing a stronger foundation for a sustained rally.

  • Analyst Behind Viral Model Reveals Bitcoin’s Next Bullish Target

    Analyst Behind Viral Model Reveals Bitcoin’s Next Bullish Target

    Key Highlights

    • Bitcoin has closed above the 50-week moving average (~$79,000), with the next technical target at the 100-week moving average (~$89,000).
    • Analyst PlanB declares the Bitcoin bear market over, citing August’s close at $78,571 and recovery across multiple market indicators.
    • Profitable Bitcoin supply surged from 50% to 72%, while the monthly RSI climbed from 41 to 51, signaling strengthening momentum.

    Bitcoin Breaks Key Technical Barrier as PlanB Signals Bear Market End

    Bitcoin’s price action has crossed a critical threshold, closing above the 50-week moving average near $79,000 and trading around $81,000 at the time of analysis. Widely followed pseudonymous analyst PlanB highlighted the development, stating, “Bitcoin closed above the 50-week moving average. The next target is the 100-week moving average, around $89,000.” This technical milestone positions the asset for a potential test of the longer-term 100-week average, a level historically associated with major trend transitions.

    Multiple On-Chain and Momentum Indicators Confirm Recovery

    Beyond the moving average crossover, PlanB emphasized a confluence of supporting data points. The analyst noted that August concluded with Bitcoin at $78,571, marking a turning point after which various market indicators began to recover. Notably, the percentage of Bitcoin supply in a profitable state has jumped significantly from 50% to 72%, reflecting a broad improvement in holder economics. Simultaneously, the monthly Relative Strength Index (RSI) has risen from 41 to 51, crossing above the neutral 50 threshold and indicating a shift from bearish to bullish momentum on the macro timeframe.

    Analyst Concludes Bottom Is Likely In

    Synthesizing these technical and on-chain metrics, PlanB assessed that the bear market in Bitcoin has ended and that the cryptocurrency may have already passed its cycle bottom. The combination of price reclaiming the 50-week moving average, expanding profitable supply, and improving momentum oscillators constructs a technical framework that supports bullish expectations for the upcoming period. While the analyst’s commentary carries weight in the crypto community, the standard disclaimer applies: This is not investment advice.

    Why This Matters

    The 50-week and 100-week moving averages are among the most watched long-term trend filters in Bitcoin technical analysis. A sustained close above the 50-week average has historically preceded extended uptrends, while the 100-week average often acts as a “line in the sand” between bull and bear market regimes. The simultaneous improvement in realized profitability metrics—from 50% to 72% of supply in profit—suggests a reduction in unrealized losses across the network, which typically reduces selling pressure. The monthly RSI reclaiming 50 adds a momentum confirmation that has been absent during the recent consolidation phase. Together, these factors align with a classic market structure shift from accumulation to markup, though macroeconomic risks and regulatory developments remain external variables.

    Frequently Asked Questions

    What are the specific price levels for the 50-week and 100-week moving averages mentioned by PlanB?
    The 50-week moving average sits around $79,000, which Bitcoin has now closed above. The next target, the 100-week moving average, is approximately $89,000.
    What on-chain metric showed the most dramatic improvement according to the analysis?
    The percentage of Bitcoin supply in a profitable state increased from 50% to 72%, a 22-percentage-point jump indicating significantly healthier holder economics across the network.
    Does PlanB’s analysis constitute a price prediction or investment recommendation?
    No. The analysis presents a technical assessment based on moving averages, profitability ratios, and momentum indicators. The source explicitly includes the disclaimer: “This is not investment advice.”
  • WIF Price Prediction: Pullback Likely Despite 13% Surge, Analysts Say

    WIF Price Prediction: Pullback Likely Despite 13% Surge, Analysts Say

    Key Highlights

    • dogwifhat ($WIF) surged 13.14% in 24 hours as capital rotated into Solana memecoins, with trading volume jumping 95.16% to $105.8 million.
    • The rally stalled at the $0.2157 resistance level, where RSI bearish convergence at 62.85 signaled potential price rejection.
    • Spot market data shows seller dominance (90-day Spot Taker CVD), while rising open interest ($85.12M) creates leverage-driven downside risk.

    Capital Rotation Fuels $WIF Rally Amid Solana Memecoin Momentum

    Solana’s memecoin sector captured renewed trader attention over the past 24 hours, posting a near 6% collective gain as speculative capital rotated toward higher-risk ecosystem tokens. dogwifhat ($WIF) emerged as a primary beneficiary, recording a 13.14% daily price increase alongside a dramatic 95.16% surge in trading volume to $105.8 million. The volume expansion suggests heightened participation, though analysts caution that increased activity alone does not confirm sustainable buying pressure.

    Technical Resistance at $0.2157 Halts Recovery Attempt

    On the daily chart, $WIF rebounded from the $0.1758 region toward $0.2157 but failed to breach this overhead barrier. Notably, the barrier capped previous recovery attempts, making another price rejection significant for the short-term structure. More importantly, the RSI indicator formed a bearish convergence around the 62.85-zone as the price met rejection. Each recent RSI approach towards this threshold zone aligned with $WIF hitting the upper range, before a subsequent price retreat. At the time of writing, the RSI stood at 58.82, after retreating from the higher 62.85-zone. The repeated convergence between the indicator’s RSI resistance and price pullbacks could strengthen the possibility of a price correction.

    Spot Market Data Reveals Seller Dominance Despite Volume Spike

    $WIF’s resistance struggle alone did not confirm the pullback case though. In fact, the token’s Spot activity and derivatives positioning showed why selling pressure could gain greater influence after the price rally. According to CryptoQuant, $WIF’s Spot Volume Bubble Map highlighted intensified activity as traders increasingly participated in the recent move. Also, the 90-day Spot Taker CVD indicator read seller-dominant after the sharp hike in trading activity. This meant that at press time, aggressive sellers had taken control of the Spot executions as $WIF struggled to keep its rally alive. This imbalance weakened the rally as the trading expanding activity failed to translate into stronger taker-buy demand. Rather, the hike in participation activity coincided with selling as $WIF faced a significant technical barrier. Sustained seller dominance could therefore restrict fresh upside and increase pressure on traders who entered during the rally.

    Rising Leverage Adds Downside Risk Through Derivatives Exposure

    Finally, the memecoin’s derivatives market also added another layer of concern as leveraged exposure expanded during the price hike. According to CoinGlass, the Open interest climbed by 11.10% to $85.12 million, suggesting that traders added positions alongside the price recovery. Meanwhile, Binance top traders maintained a clear bullish bias despite weakening from previous positioning extremes. Specifically, the long accounts represented 60.52% against the shorts at 39.48%, producing a Long/Short Ratio of 1.53. Thus, this sizeable share of leveraged positioning remains exposed to a reversal as Spot sellers control activity. The developing price correction could pressure these longs and trigger position closures. Eventually, such unwinding would create additional selling pressure, potentially accelerating a pullback that initially began in the Spot market.

    Why This Matters

    The $WIF price action illustrates a recurring dynamic in the Solana memecoin ecosystem: rapid, volume-driven rallies that encounter structural resistance and deteriorating spot market internals. The divergence between rising participation (volume, open interest) and seller-dominant taker flow suggests that new entrants may be providing exit liquidity for earlier positions rather than establishing sustainable bullish trends. With $85.12 million in open interest and a 1.53 long/short ratio on Binance, the derivatives market carries significant liquidation risk if spot sellers maintain control. For traders and analysts monitoring Solana’s memecoin sector, the $0.2157 resistance level and the 62.85 RSI convergence zone serve as critical reference points for assessing whether the current rotation represents a durable trend shift or a liquidity-driven bounce vulnerable to leverage unwinding.

    Frequently Asked Questions

    What caused dogwifhat’s 13% price increase in the last 24 hours?

    Capital rotation into Solana memecoins drove a sector-wide gain of nearly 6%, with $WIF capturing outsized inflows that pushed trading volume up 95.16% to $105.8 million.

    Why did the $WIF rally stall near $0.2157?

    The $0.2157 level has repeatedly capped previous recovery attempts. Technical analysis shows RSI bearish convergence at the 62.85 zone aligning with each price rejection, signaling weakening momentum at this resistance.

    What risk does rising open interest pose for $WIF holders?

    Open interest climbed 11.10% to $85.12 million during the rally, with Binance top traders holding a 1.53 long/short ratio. If spot sellers maintain control and price corrects, leveraged long positions face liquidation risk that could accelerate selling pressure.