Tag: Crypto derivatives

  • Grayscale Files for ZCSH High Income ETF, an Options-Based Zcash Fund

    Grayscale Files for ZCSH High Income ETF, an Options-Based Zcash Fund

    Key Highlights

    • Grayscale filed a registration statement with the SEC on September 25 for the ZCSH High Income ETF, an actively managed fund using a synthetic covered-call strategy on Zcash exchange-traded products.
    • The fund will not hold ZEC directly, instead investing at least 80% of net assets in options contracts referencing The Zcash ETF (ticker: ZCSH) to generate income from premiums.
    • The filing proposes effectiveness 75 days after submission (around early December), but no ticker or listing exchange has been assigned, and the SEC has not approved or disapproved the securities.

    Grayscale Files for ZCSH High Income ETF with Synthetic Covered-Call Strategy

    Grayscale Investments has taken another step in expanding its Zcash product suite, filing a registration statement with the U.S. Securities and Exchange Commission on September 25 for the ZCSH High Income ETF. The proposed fund, structured under Grayscale Funds Trust, is designed as an actively managed exchange-traded fund that seeks current income while maintaining prospects for capital appreciation through a synthetic covered-call strategy. Unlike the firm’s existing spot Zcash ETF, this new vehicle will not purchase the privacy coin directly. Instead, it intends to trade options contracts on Zcash exchange-traded products, primarily The Zcash ETF (ticker: ZCSH), which Grayscale listed on NYSE Arca in August as the first U.S. spot ETF holding a privacy coin.

    Mechanics of the Synthetic Covered-Call Approach

    According to the post-effective amendment to its Form N-1A registration statement, the fund will invest at least 80% of its net assets, plus borrowings for investment purposes, in options contracts that use a Zcash exchange-traded product as the reference asset, valuing each derivative at its notional amount. The strategy involves writing, or selling, call options to collect premiums, while simultaneously pairing bought calls with sold puts to replicate the underlying fund’s price movements. This 80% investment policy is designated as non-fundamental, meaning it can be changed with at least 60 days of written notice to shareholders. The prospectus explicitly states that the fund will not invest in digital assets directly, will not hold ZEC, and will not maintain a digital-asset wallet or control private keys.

    Indirect Exposure and Tracking Considerations

    Because the fund’s exposure runs entirely through derivatives, the filing cautions that it may not track the price of ZEC. The Zcash ETF (ZCSH), by contrast, operates as a grantor trust sponsored by an affiliate of the fund’s adviser for the sole purpose of holding ZEC directly. Options on ZCSH began trading in September, providing the necessary derivatives market for the new income fund’s strategy. The registration statement proposes that the filing take effect 75 days after submission, which would place the potential launch around early December, though the prospectus does not yet assign a ticker symbol or specify a listing exchange.

    Why This Matters

    This filing represents a notable evolution in the cryptocurrency ETF landscape, moving beyond simple spot exposure into structured derivative strategies. By launching a covered-call product on a privacy-coin ETF, Grayscale is offering investors a way to monetize volatility and generate yield without the operational complexities of direct digital asset custody, such as private key management. The move also signals growing maturity in the crypto derivatives ecosystem, as the availability of options on the recently launched ZCSH enables such synthetic strategies. However, the fund’s indirect structure means performance may deviate from the spot price of ZEC, introducing basis risk that investors must weigh against the income potential. The SEC’s eventual decision on effectiveness will be a key milestone for derivative-based crypto ETFs in the United States.

    Frequently Asked Questions

    What is the ZCSH High Income ETF’s primary investment strategy?

    The fund employs a synthetic covered-call strategy, writing call options on The Zcash ETF (ZCSH) to collect premiums while using combinations of bought calls and sold puts to replicate the underlying ETF’s price movements. It invests at least 80% of its net assets in these derivatives.

    Will the fund hold ZEC directly?

    No. The prospectus explicitly states the fund will not invest in digital assets directly, will not hold ZEC, and will not maintain a digital-asset wallet or control private keys. Exposure is achieved solely through options contracts on Zcash exchange-traded products.

    When could the fund launch?

    The filing proposes effectiveness 75 days after the September 25 submission, targeting early December. However, the SEC has not approved or disapproved the securities, and no ticker or listing exchange has been assigned yet.


  • Coinbase Issues Warning Following XRP Rally

    Coinbase Issues Warning Following XRP Rally

    Key Highlights

    • Coinbase Markets data shows XRP one-week call/put implied volatility skew hit 9.3 volatility points, placing it in the top 5% of readings over the past year, signaling heightened bullish derivative demand.
    • XRP futures open interest surged to $4.1 billion, with CME Group overtaking Binance as the leading venue, indicating growing institutional participation in the token’s derivatives market.
    • Analysts warn the concentration of long call positions after XRP’s 15–18% weekly rally creates “crowded positioning” risk, which could amplify downside volatility if sentiment reverses.

    XRP Derivatives Signal Aggressive Bullish Positioning Amid Market Pullback

    Bitcoin’s recent ascent above $87,000 and broad altcoin strength were abruptly halted this week as surging global bond yields—reaching levels last seen in 2007—triggered a sharp risk-off move across digital assets. While major cryptocurrencies retreated from local highs, on-chain and derivatives data for XRP tell a contrasting story of intensifying speculative conviction. Coinbase Markets, the institutional-facing arm of the Nasdaq-listed exchange, published a detailed analysis highlighting an extraordinary shift in XRP options pricing that suggests professional traders are betting heavily on continued upside.

    Options Skew Reaches Extreme Bullish Territory

    According to Coinbase Markets, the one-week implied volatility spread between XRP call and put options widened to 9.3 volatility points. This metric, known as the risk reversal or skew, sits in the 95th percentile of observations recorded over the trailing twelve months. In practical terms, the premium investors are willing to pay for upside protection (calls) versus downside protection (puts) has ballooned, reflecting a consensus expectation that XRP’s recent 15% to 18% weekly gain is a precursor to further appreciation rather than exhaustion. Coinbase cautions, however, that a 9.3-point volatility differential does not mathematically translate to a 9.3% price move; it merely quantifies the intensity of directional demand in the options market.

    Futures Open Interest Hits $4.1 Billion as CME Leads Institutional Flow

    Complementing the options signal, aggregate open interest across XRP futures contracts climbed to $4.1 billion. Notably, CME Group—the primary regulated venue for institutional crypto derivatives in the United States—surpassed Binance in XRP futures volume and open interest. This shift is widely interpreted by market structure analysts as evidence that regulated, compliance-first capital is allocating to XRP with greater conviction than retail-heavy offshore platforms. The CME’s leadership position in a specific altcoin’s futures complex is relatively rare and underscores the token’s evolving status among professional allocators.

    Why This Matters: Crowded Trade Dynamics and Macro Crosscurrents

    The confluence of extreme options skew and record futures open interest introduces a classic “crowded positioning” vulnerability. When a disproportionate share of market participants holds similar directional bets—here, long calls and long futures—any catalyst that challenges the thesis can trigger a violent unwind. Forced liquidation of leveraged futures and delta-hedging by options market makers can accelerate price declines, creating a feedback loop detached from spot fundamentals. This risk is amplified by the macro backdrop: the U.S. 10-year Treasury yield piercing 4.5% has already pressured risk assets broadly. Should yields continue climbing, the high-beta nature of altcoins like XRP could see disproportionate selling, testing the resolve of the very derivatives positions that currently appear so bullish. Traders and risk managers will monitor CME positioning reports and options expiry calendars closely for signs of de-risking.

    Frequently Asked Questions

    What does a 9.3-point call/put implied volatility skew mean for XRP?
    It indicates that options market participants are paying a significantly higher premium for one-week call options versus put options, placing current demand for upside exposure in the top 5% of the past year. It reflects sentiment, not a guaranteed price target.
    Why is CME surpassing Binance in XRP futures significant?
    CME is the primary regulated derivatives marketplace for U.S. institutions. Its leadership in XRP futures suggests professional, compliance-driven capital is actively building positions, which often correlates with longer holding periods and deeper liquidity than retail-dominated offshore venues.
    What is the primary risk highlighted by Coinbase Markets?
    Coinbase warns of “crowded positioning” risk: if a large number of investors hold similar long positions simultaneously, a sudden sentiment reversal can cause exaggerated price swings as participants rush to exit, amplified by futures liquidations and options dealer hedging.

    *This article summarizes third-party market analysis and does not constitute investment advice.

  • FET Price Eyes $0.21 Supply Zone Break After 11% Rally

    FET Price Eyes $0.21 Supply Zone Break After 11% Rally

    Key Highlights

    • Superintelligence Alliance ($FET) surged 11.24% to $0.2012, with spot volume jumping 35.69% as the token tests the critical $0.2100 supply zone.
    • Exchange reserves climbed 14.01% to $41.7 million, increasing immediate sell-side liquidity even as derivatives data shows top traders heavily positioned long at a 2.69 long/short ratio.
    • MACD remains bullish with the line at 0.0091 above the signal line at 0.0059, supporting a potential breakout toward $0.2538, though failure at $0.2100 could see a retest of $0.1742 support.

    FET Rally Confronts Overhead Supply as Volume Surges

    The Superintelligence Alliance token ($FET) extended its recovery on Tuesday, climbing 11.24% to $0.2012 at press time as heightened spot market participation drove the AI-focused asset toward a technically significant supply zone. The advance was accompanied by a 35.69% surge in 24-hour spot volume, signaling genuine buyer interest rather than thin-liquidity manipulation. After reclaiming several contested levels from its August lows, the token now approaches the $0.2100 region, which sits within a broader supply zone extending above current prices. Market participants face a demanding test: sustaining the volume momentum needed to absorb selling pressure clustered around this overhead barrier.

    Rising Exchange Reserves Add Sell-Side Complexity

    Complicating the bullish narrative, on-chain data from CryptoQuant reveals that $FET exchange reserves pumped 14.01% during the rally period, reaching approximately $41.7 million. The increase means a larger quantity of tokens now sits in exchange wallets, granting holders immediate access to liquidity should they choose to sell into the advance. While rising reserves alone do not confirm active distribution, the timing is notable: the reserve expansion coincides precisely with the price approach to a zone historically associated with selling pressure. This dynamic creates a tactical standoff where spot buyers must overcome not only existing limit orders but also the latent supply represented by the growing exchange balances.

    Derivatives Positioning Skews Heavily Long

    Conversely, derivatives data from CoinGlass paints a strongly bullish picture among leveraged participants. As of writing, Binance top-trader accounts show 72.89% long positioning versus 27.11% short, producing a long/short ratio of 2.69 — a pronounced directional imbalance. The OI-weighted funding rate has turned positive at 0.0166%, indicating long-position holders are paying shorts to maintain exposure, a condition that typically reflects conviction in further upside. However, the crowded long side introduces fragility: a sharp rejection at the $0.2100 supply zone could trigger cascading long liquidations, amplifying volatility and accelerating a pullback toward the $0.1742 support level where buyers previously stepped in.

    Technical Structure Favors Upside Attempt, Confirmation Pending

    From a technical standpoint, the MACD indicator strengthened during the approach to resistance rather than diverging, a constructive signal. The MACD line sits at 0.0091, comfortably above its signal line at 0.0059, with expanding green histogram bars confirming active bullish momentum. This configuration supports another challenge of the crucial supply zone. A decisive daily close above $0.2100 would invalidate the near-term bearish structure and open a path toward the next key resistance at $0.2538. Absent that confirmation, the risk remains skewed toward a range-bound consolidation or pullback to $0.1742, where the bulls would need to defend their foothold once more.

    Why This Matters

    The $FET price action encapsulates a classic crypto market tension: improving spot fundamentals and bullish derivatives positioning clashing with rising exchange supply and a well-defined technical resistance. As the native token of the Artificial Superintelligence Alliance — formed by the merger of Fetch.ai, SingularityNET, and Ocean Protocol — $FET serves as a bellwether for the decentralized AI narrative. A clean break above $0.2100 would signal that accumulation during the August lows has shifted into a new uptrend phase, potentially attracting fresh capital flows into the AI-crypto intersection. Conversely, a failure here would extend the consolidation phase, testing the patience of long-term holders and the conviction of leveraged longs. Traders and investors should monitor daily close behavior around $0.2100, exchange reserve trends for signs of distribution, and funding rate dynamics for early warnings of leverage unwind.

    Frequently Asked Questions

    What is the key resistance level for $FET right now?

    The critical resistance is the $0.2100 supply zone. A decisive daily close above this level could open the path toward the next major resistance at $0.2538.

    Why are rising exchange reserves a concern during a rally?

    Rising exchange reserves mean more tokens are held in exchange wallets, giving holders immediate access to liquidity. This increases potential sell-side pressure, especially as price approaches a known supply zone where profit-taking or break-even selling may occur.

    What does the current MACD reading suggest about $FET momentum?

    The MACD line at 0.0091 remains above the signal line at 0.0059 with expanding histogram bars, indicating bullish momentum is accelerating rather than fading as price tests resistance — a constructive technical signal for a potential breakout attempt.

  • CME Group to Launch Bitcoin Cash, Uniswap Futures Next Month

    CME Group to Launch Bitcoin Cash, Uniswap Futures Next Month

    Key Highlights

    • CME Group will launch Bitcoin Cash and Uniswap futures contracts on Oct. 19, pending regulatory approval.
    • Both products will be offered in standard and Micro contract sizes, covering 250 BCH and 25 BCH for Bitcoin Cash, and 10,000 UNI and 1,000 UNI for Uniswap.
    • The expansion follows CME’s earlier 2026 rollout of futures for Cardano, Chainlink, Stellar, Avalanche, and Sui, reflecting growing institutional demand for crypto risk-management tools.

    CME Group Expands Crypto Derivatives Lineup with Bitcoin Cash and Uniswap Futures

    CME Group announced Tuesday that it plans to add Bitcoin Cash (BCH) and Uniswap (UNI) futures contracts to its cryptocurrency derivatives suite, with a targeted launch date of Oct. 19, subject to regulatory approval. The move marks a continued deepening of the exchange’s commitment to providing institutional-grade access to a broader spectrum of digital assets.

    Contract Specifications and Micro Options

    The new futures will be available in both standard and Micro contract sizes, catering to a range of market participants from large institutions to smaller traders. Standard Bitcoin Cash futures will represent 250 BCH, while Micro Bitcoin Cash futures will represent 25 BCH. For Uniswap, standard futures will cover 10,000 UNI and Micro futures will cover 1,000 UNI. This tiered structure mirrors the approach CME has taken with its existing Bitcoin and Ether futures and options, allowing for more precise position sizing and capital efficiency.

    Responding to Institutional Demand Amid Market Maturation

    The company said the new contracts respond to client demand for institutional-grade risk-management tools as crypto markets develop. CME’s crypto futures and options recorded average daily volume of 279,800 contracts in the first half of 2026, with average open interest of 264,600 contracts. These figures underscore the sustained engagement of professional market participants in regulated crypto derivatives, even amid broader market volatility.

    Building on a Year of Altcoin Futures Expansion

    The launch comes after CME rolled out futures tied to Cardano, Chainlink, Stellar, Avalanche, and Sui this year. That series of listings signaled a strategic pivot beyond the dominant Bitcoin and Ether complex, acknowledging the growing relevance of layer-one platforms and decentralized finance protocols in institutional portfolios. By adding Bitcoin Cash—a payments-focused fork of Bitcoin—and Uniswap—the leading decentralized exchange protocol—CME is further diversifying its crypto index to capture distinct use-case narratives.

    Why This Matters

    The introduction of Bitcoin Cash and Uniswap futures on a regulated exchange like CME Group represents a significant milestone for the institutional adoption of alternative crypto assets. It provides traditional financial institutions, hedge funds, and asset managers with a familiar, centrally cleared venue to hedge exposure or express directional views on these specific tokens without needing to hold the underlying assets directly. This development also reflects the evolving regulatory comfort with a wider array of digital assets, as evidenced by the pending approval process. For the broader market, the availability of Micro contracts lowers the barrier to entry, potentially increasing liquidity and price discovery for BCH and UNI. As CME continues to expand its crypto derivatives catalog, it reinforces the trend of traditional financial infrastructure integrating digital assets, which could accelerate capital inflows and further legitimize the asset class.

    Frequently Asked Questions

    When will the Bitcoin Cash and Uniswap futures launch?

    The targeted launch date is Oct. 19, pending regulatory approval.

    What contract sizes will be available?

    Both standard and Micro contract sizes will be offered. Standard Bitcoin Cash futures represent 250 BCH; Micro Bitcoin Cash futures represent 25 BCH. Standard Uniswap futures cover 10,000 UNI; Micro Uniswap futures cover 1,000 UNI.

    How does this fit into CME’s existing crypto derivatives lineup?

    CME already offers futures and options on Bitcoin and Ether, and earlier in 2026 launched futures for Cardano, Chainlink, Stellar, Avalanche, and Sui. The addition of Bitcoin Cash and Uniswap continues the expansion into a diversified set of crypto assets driven by institutional client demand.

  • Crypto Traders Braced for Total Wipeout, But Bitcoin Defied Expectations

    Crypto Traders Braced for Total Wipeout, But Bitcoin Defied Expectations

    Key Highlights

    • Bitcoin demonstrated unexpected resilience, holding near $75,000 despite a Federal Reserve rate hike and the failure of the Clarity Act in the U.S. Senate.
    • Market analysts indicate Bitcoin remains insulated from legislative setbacks, with derivatives traders having largely priced in the Senate’s rejection of the crypto bill.
    • Bitfinex’s Jag Kooner notes the modest spot market reaction reflects a market that was not positioned for a legislative breakthrough.

    Market Defies Bearish Expectations Amid Macro and Legislative Headwinds

    Just one week ago, sentiment across the cryptocurrency sector bordered on panic. The prevailing consensus among market participants was that a dual catalyst—a Federal Reserve interest rate hike combined with the anticipated failure of the Clarity Act in the Senate—would trigger a sharp correction for Bitcoin and the broader digital asset complex. However, that predicted sell-off failed to materialize. Even as the Fed tightened monetary policy and the landmark crypto legislation stalled on Capitol Hill, Bitcoin not only stabilized but continued its ascent, brushing against the psychologically significant $75,000 level.

    Senate Vote Dynamics and Price Action

    The tension peaked on the night of September 14, as senators prepared to cast their ballots on the Clarity Act. In the hours leading up to the vote, Bitcoin experienced a dip driven by pre-vote jitters. Rumors of partisan gridlock—specifically concerning stablecoin yield provisions and ethics amendments attached to the bill—circulated rapidly through trading desks and social media, amplifying uncertainty. Despite this noise, the selling pressure proved shallow. By the time the Senate session commenced, Bitcoin had already recovered its footing, marching toward $75,000 and effectively shrugging off the legislative defeat once the final tally confirmed the bill’s failure.

    Derivatives Market Signals Resilience and Priced-In Outcomes

    The disconnect between the legislative outcome and the market’s muted reaction finds its clearest explanation in the derivatives arena. According to Jag Kooner, head of derivatives at Bitfinex, derivatives traders largely anticipated the Senate’s failure to approve the law. The modest spot reaction reflects a market that was already not positioned for a legislative breakthrough, he said. This insight suggests that sophisticated market participants had hedged or reduced exposure well in advance, neutralizing the potential for a cascading liquidation event. The data implies that the Clarity Act’s passage was viewed as a potential upside catalyst rather than a baseline expectation, meaning its failure represented a maintenance of the status quo rather than a negative surprise.

    Why This Matters

    The market’s ability to absorb simultaneous hawkish monetary policy and legislative disappointment signals a maturation of the Bitcoin market structure. It suggests that institutional participation and derivatives sophistication have created a buffer against binary political events that historically caused violent volatility. For investors, the key takeaway is that Bitcoin’s price discovery is increasingly decoupling from U.S. regulatory timelines, relying instead on global liquidity conditions and adoption metrics. The next critical inflection points will likely come from Federal Reserve policy signals regarding the terminal rate and incoming inflation data, rather than Congressional action on market structure bills.

    Frequently Asked Questions

    Why did Bitcoin not crash after the Clarity Act failed in the Senate?

    Derivatives traders had largely anticipated the bill’s failure and adjusted positioning accordingly. The market was not priced for a legislative breakthrough, so the negative outcome was already reflected in prices, resulting in only a modest spot market reaction.

    What role did the Federal Reserve rate hike play in Bitcoin’s price action?

    Despite the Fed hiking rates—a traditionally bearish signal for risk assets—Bitcoin continued its upward trajectory toward $75,000. This suggests that current market dynamics, including derivatives positioning and supply constraints, are overriding traditional macro correlations in the near term.

    What is the significance of the $75,000 level for Bitcoin?

    The $75,000 level represents a key psychological and technical resistance zone. Bitcoin’s ability to approach and hold near this level amid adverse legislative and macro news is being interpreted by analysts as a sign of underlying structural strength and buying conviction.

  • Aptos (APT) Surges 18% as Layer 1 Rotation Accelerates; $0.825 Target in Focus

    Aptos (APT) Surges 18% as Layer 1 Rotation Accelerates; $0.825 Target in Focus

    Key Highlights

    • Aptos ($APT) surged 18.6% to approximately $0.6616 as Layer-1 sector rotation drove speculative demand toward higher-beta altcoins.
    • Binance top trader positioning shows strong bullish bias with a 1.62 long/short ratio (61.79% long vs 8.21% short), reinforcing the breakout attempt above the $0.654 range ceiling.
    • Technical indicators support upside momentum—RSI at 60.94 and MACD bullish crossover—though failure to hold $0.654 could trigger a retracement toward $0.63–$0.60 or the $0.509 range floor.

    Layer-1 Rotation Fuels Aptos Breakout Above Multi-Month Range

    Aptos ($APT) posted an 18.6% price increase during the latest trading session, climbing to roughly $0.6616 as capital rotated into Layer-1 tokens across the board. The advance was not tied to a protocol-specific catalyst but rather reflected a broader shift in market participation toward higher-beta assets within the Layer-1 category. Several peer tokens recorded double-digit gains in tandem, confirming that $APT’s rally emerged from sector-wide momentum rather than isolated fundamental developments. The move lifted the token out of a prolonged consolidation band that had capped prices between $0.509 and $0.654 for months, with the latest session printing a high of $0.711—penetrating liquidity resting above the established range ceiling.

    Top Trader Positioning Heavily Skewed Long on Binance

    Derivatives data from CoinGlass reveals that Binance’s top trader cohort maintained a pronounced long-side bias as $APT approached its range ceiling. Long accounts represented 61.79% of positioning versus just 8.21% short, yielding a long/short ratio of 1.62. The ratio had fluctuated significantly in recent weeks, including a sharp spike around September 11, but the latest reading continues to show a preponderance of bullish bets among the platform’s most active traders. This positioning aligns with the spot-market recovery driven by Layer-1 rotation, though it also raises the stakes: a failure to hold the breakout could prompt leverage reduction among those concentrated long positions, amplifying downside pressure.

    Technical Structure Signals Breakout, But Acceptance Above $0.654 Is Critical

    On the daily timeframe, $APT has repeatedly tested the $0.654 resistance since mid-year, producing candle wicks above the level that subsequently retreated—classic liquidity sweeps rather than sustained breaks. The current advance differs by pushing the daily close above that boundary, with the Relative Strength Index climbing to 60.94 (above its 53.83 average but below overbought territory) and the MACD crossing above its signal line. These readings suggest momentum is strengthening without yet reaching exhaustion. For the breakout to invalidate the prior range-play structure, buyers must convert the former $0.654 ceiling into support. A successful retest would open a path toward the next significant daily resistance at $0.825.

    Liquidity Map Reveals Dual Pathways: Extension or Reversion

    Binance’s liquidation heatmap underscores that $APT’s push to $0.711 already swept through a cluster of overhead liquidity near the prior range high. However, additional liquidation clusters persist in the $0.69–$0.72 zone, meaning a sustained hold above $0.654 could fuel a further liquidity-driven extension. Conversely, rejection at the breakout level would shift risk toward the downside, where notable liquidation liquidity sits between $0.63 and $0.60. A deeper unwind of the recent leveraged longs could ultimately revisit the $0.509 range floor, particularly if bullish positioning capitulates en masse following the rapid rally.

    Why This Matters

    The $APT price action exemplifies how sector rotation dynamics can override token-specific fundamentals in the current market environment. Layer-1 tokens as a class are benefiting from renewed speculative appetite, likely driven by narratives around modular blockchain scaling, upcoming token unlocks, and relative valuation comparisons against Ethereum and Solana. For Aptos specifically, the breakout attempt carries outsized significance because the protocol has struggled to sustain momentum above $0.65 despite repeated attempts. A confirmed break would improve the technical structure and potentially attract trend-following flows, while failure would reinforce the range-bound thesis and likely deepen the consolidation. Traders should monitor whether the current long positioning in derivatives represents informed conviction or crowded leverage vulnerable to a washout.

    Frequently Asked Questions

    What triggered Aptos’ 18.6% price surge?

    The rally was driven by broad-based Layer-1 sector rotation rather than an Aptos-specific catalyst. Multiple Layer-1 tokens posted double-digit gains simultaneously as speculative capital rotated into higher-beta altcoins.

    What are the key price levels to watch for $APT?

    The critical level is $0.654 (former range ceiling, now potential support). Above that, $0.69–$0.72 holds liquidation clusters that could fuel further upside, with $0.825 as the next major resistance. On the downside, $0.63–$0.60 and the $0.509 range floor are key support zones.

    How are top traders positioned on Binance?

    Binance top traders show a strong long bias: 61.79% long vs 8.21% short, yielding a 1.62 long/short ratio. This complements the spot breakout but also creates liquidation risk if the breakout fails and leveraged longs unwind.

  • Bitcoin Briefly Tops $81,000 as Bad News Stops Working

    Bitcoin Briefly Tops $81,000 as Bad News Stops Working

    Key Highlights

    • Bitcoin surged approximately 6% on Friday to briefly trade above $81,000, absorbing five major macroeconomic and regulatory headwinds—including a failed Senate vote on the CLARITY Act, a Federal Reserve rate hike, and a Bank of Japan rate increase—without a sustained selloff.
    • The rally was driven predominantly by short covering: $470 million in short positions were liquidated versus only $60 million in longs, while aggregate open interest fell 1.4%, signaling position compression rather than fresh leveraged buying.
    • Technical momentum is improving (14-day RSI at 63.56, above its moving average), but the daily MACD remains below its signal line, leaving the move unconfirmed by slower momentum indicators.

    Bitcoin Defies Concentrated Macro Headwinds

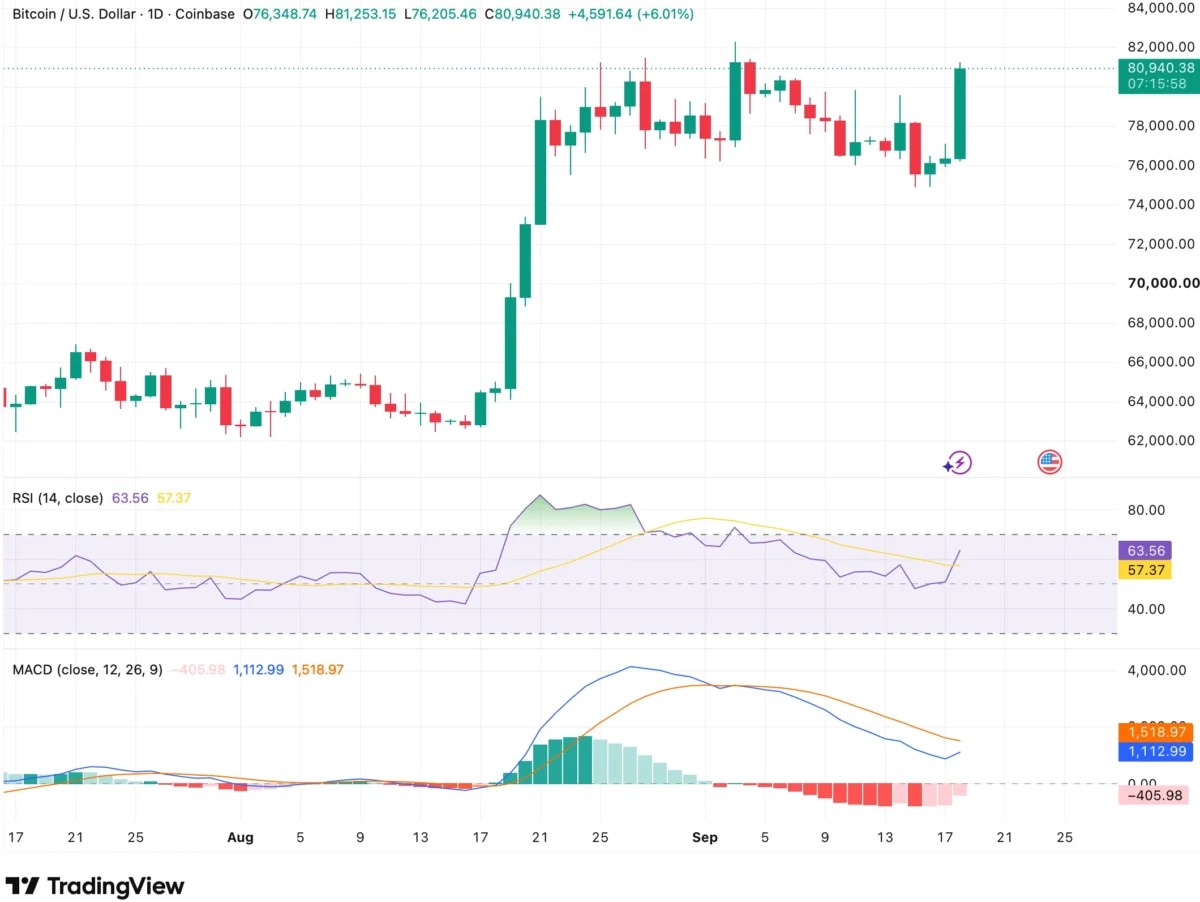
    Bitcoin staged a sharp intraday reversal on Friday, climbing roughly 6% to a session high of $81,253 on the Coinbase daily chart before settling near $80,940 at the time of writing. The advance is notable not for its magnitude but for the backdrop against which it occurred: within a single week, the market digested a procedural failure on the CLARITY Act in the U.S. Senate (49–50, short of the 60 votes needed for cloture), the Federal Reserve’s first rate increase since 2023 (lifting the target range to 3.75%–4.00%), the Bank of Japan’s policy rate hike to 1.25% (a 31‑year high), a U.S. Dollar Index reclaiming the 100 level, and Brent crude holding above $100 per barrel. Each of these developments typically pressures risk assets—higher rates boost the appeal of yield‑bearing alternatives, a stronger dollar tightens global financial conditions, and elevated oil sustains inflationary impulses—yet Bitcoin not only refused to extend its earlier decline toward $76,000 but accelerated higher.

    Derivatives Data Reveal Short‑Covering Dynamics

    Friday’s derivatives metrics provide a clearer mechanical explanation than any single bullish catalyst. According to Coinglass data, roughly $530 million in leveraged crypto positions were liquidated over 24 hours, with short positions accounting for approximately $470 million of that total versus only $60 million in long liquidations. Simultaneously, aggregate open interest declined 1.4% to $453.43 billion while 24‑hour derivatives volume rose 2.2% to nearly $936 billion. This combination—rising price, falling open interest, and disproportionately large short liquidations—is consistent with position compression: traders positioned for further downside were forced to buy back as Bitcoin rallied, amplifying the move. The breadth of the advance underscores the systemic nature of the squeeze; Ethereum gained 5.3%, XRP 6.2%, Solana 10.4%, and HYPE more than 11%, lifting total crypto market capitalization about 5% to $2.76 trillion.

    Short Squeezes Are Self‑Limiting

    While the liquidation cascade explains the velocity of Friday’s rally, it does not guarantee durability. Forced covering creates mechanical demand that evaporates once bearish positions are exhausted. The critical question is whether underlying spot demand—evidenced by sustained exchange trading activity, continued ETF inflows, or stable open interest rebuilding—persists after the liquidation impulse fades. Absent that, the rally remains a positioning unwind rather than a new demand regime.

    Technical Momentum Improves But Lags Price Action

    Bitcoin’s daily chart offers a second lens on sustainability. The 14‑day Relative Strength Index has climbed to 63.56, comfortably above its moving average at 57.37 and well clear of the conventionally overbought 70 threshold, indicating strengthening momentum without exhaustion. The Moving Average Convergence Divergence, however, tells a more cautious story: the MACD line has turned upward to 1,112.99 but remains below the signal line at 1,518.97, leaving the histogram negative at –405.98. The histogram bars have been contracting and the MACD line curling higher, suggesting the direction is improving, but a bullish crossover has not yet occurred. This divergence—price accelerating while the slower daily momentum indicator has not fully confirmed—creates a clear watchpoint: a MACD crossover would signal that momentum broadening is underway rather than remaining concentrated in a single explosive session.

    Historical Parallel: 2023 Regime Shift Echoes

    The current dynamic bears a striking resemblance to Bitcoin’s behavior throughout 2023. During that period, the asset absorbed aggressive Federal Reserve tightening (the target range ultimately reaching 5.25%–5.50%) alongside an intensive U.S. regulatory campaign that saw the SEC sue Coinbase and Binance and designate several major tokens as securities. Despite repeated negative headlines, each successive shock generated diminishing incremental selling pressure, and Bitcoin gradually ceased revisiting the lows established after the 2022 collapse. The lesson from 2023 is not that restrictive policy or enforcement actions became bullish, but that the market’s capacity to produce new sellers in response to them was waning. Markets can begin shifting before the news flow turns favorable, and Friday’s price action—absorbing five simultaneous headwinds without a net decline—suggests a similar recalibration may be in progress.

    Why This Matters

    The week’s events highlight a potential inflection point in Bitcoin’s market structure. For years, macro tightening and regulatory uncertainty acted as reliable catalysts for drawdowns. The failure of that playbook in the face of a concentrated barrage of negative catalysts—failed legislation, dual central‑bank hikes, dollar strength, and elevated energy prices—signals that the marginal seller may be exhausted. If spot demand proves resilient, leverage remains contained, and momentum indicators like the MACD confirm the RSI’s strength, the market could be transitioning to a regime where bad news is increasingly “priced in” and produces diminishing downside volatility. This has direct implications for portfolio allocation, risk management, and the narrative around Bitcoin’s maturation as a macro asset. Institutional participation metrics (ETF flows, custody data) and derivatives market structure (open interest trends, funding rates) will be the primary arbiters of whether this is a durable shift or a temporary positioning anomaly.

    Frequently Asked Questions

    What specifically drove Bitcoin’s 6% rally on Friday?

    The primary driver was a massive short‑covering event: approximately $470 million in short positions were liquidated in 24 hours, forcing bearish traders to buy back Bitcoin and accelerating the price rise. Aggregate open interest fell, confirming that the rally stemmed from position unwinding rather than new leveraged long entries.

    Is this rally sustainable or just a short squeeze?

    Sustainability hinges on whether genuine spot demand persists after the forced buying ends. Key signals to watch include continued ETF inflows, stable or gradually rebuilding open interest (rather than a surge in aggressive longs), and a bullish MACD crossover on the daily chart confirming broadening momentum.

    How does this week compare to previous macro stress periods for Bitcoin?

    The closest analogue is 2023, when Bitcoin absorbed simultaneous Fed tightening and SEC enforcement actions with progressively smaller drawdowns. In both episodes, the market’s reaction function to negative news appeared to change—selling pressure diminished even as the fundamental headwinds persisted—suggesting a structural shift in participant positioning and risk appetite.

  • Bitcoin Surpasses $80,000 Amid Bullish Sentiment; Chinese Analyst Forecasts Next Moves

    Bitcoin Surpasses $80,000 Amid Bullish Sentiment; Chinese Analyst Forecasts Next Moves

    Key Highlights

    • Bitcoin surged past $80,000 to trade near $81,000, triggering over $457 million in short-position liquidations over 24 hours.
    • Prominent miner Jiang Zhuoer forecasts a potential test of the $83,000–$84,000 resistance zone before a sharp correction to $72,000–$74,000.
    • Short positions accounted for 89% of total liquidations in the past 24 hours, signaling a aggressive bearish squeeze.

    Bitcoin Breaks $80,000 Barrier as Short Squeeze Accelerates

    Bitcoin ($BTC) surged above the psychologically significant $80,000 level in recent trading hours, climbing rapidly from a consolidation range near $78,000 to reach approximately $81,000. The sharp upward move unleashed a wave of forced liquidations across cryptocurrency derivatives markets, with short positions bearing the brunt of the losses. According to on-chain and exchange data, the rally has wiped out hundreds of millions of dollars in bearish bets, underscoring the fragility of leveraged short exposure at current price levels.

    Jiang Zhuoer Projects Next Resistance at $83,000–$84,000

    Jiang Zhuoer, a well-known Chinese cryptocurrency miner and market analyst, noted in his latest analysis that Bitcoin has validated his earlier thesis by recovering without breaching the $75,000 support level. Zhuoer stated that the velocity of the current ascent increases the probability of Bitcoin testing the strong resistance zone between $83,000 and $84,000 in the next phase. However, he cautioned that such a move would likely set the stage for a subsequent sharp correction, as the liquidation of short positions at those elevated levels could exhaust buying momentum and trigger a reversal.

    Analyst Warns of Correction Toward $72,000–$74,000 After Resistance Test

    Zhuoer believes that once short positions are flushed out near the $83,000–$84,000 region, Bitcoin could retreat toward the $72,000–$74,000 range. This pullback, he argues, would then target long positions accumulated during the rally, creating a two-sided liquidation event that could reset market structure. The miner’s framework suggests a classic high-leverage washout pattern: an initial short squeeze to clear overhead supply, followed by a deep retracement to cleanse excessive long leverage before the next directional move.

    Liquidation Data Reveals Magnitude of Short Squeeze

    The scale of the short squeeze is evident in the liquidation metrics across major derivatives venues. In the most recent four-hour window, total liquidations reached $306.55 million, of which $286.14 million — approximately 93% — were short positions. Long liquidations during the same period amounted to just $20.41 million. Extending the horizon to 12 hours, total liquidations climbed to $411.62 million, with shorts accounting for $372.53 million versus $39.09 million for longs. Over the full 24-hour period, cumulative liquidations hit $515.05 million, with short positions representing $457.26 million (89%) and longs $57.79 million. The overwhelming skew toward short liquidations confirms that the rally was driven predominantly by forced covering rather than fresh spot demand.

    Why This Matters

    The current price action highlights the outsized influence of leveraged derivatives on Bitcoin’s short-term price discovery. With open interest remaining elevated across major exchanges, the market remains vulnerable to violent two-way moves as liquidation clusters act as magnetic price targets. Zhuoer’s projected $83,000–$84,000 resistance aligns with key technical levels, including prior local highs and dense liquidation clusters visible on exchange heatmaps. A successful breach could attract momentum-driven flows, but the subsequent correction risk to $72,000–$74,000 underscores the importance of risk management for leveraged traders. For longer-term holders, the sequence reinforces Bitcoin’s tendency to purge excess leverage before establishing sustainable trends.

    Frequently Asked Questions

    What triggered Bitcoin’s surge past $80,000?

    The rally appears to have been fueled by a short squeeze in the futures market, where rapidly rising prices forced bearish traders to buy back positions, amplifying upward momentum. Over $457 million in short positions were liquidated in 24 hours.

    What is Jiang Zhuoer’s price prediction for Bitcoin?

    Jiang Zhuoer expects Bitcoin to potentially test the $83,000–$84,000 resistance zone before correcting sharply to the $72,000–$74,000 range as long positions are subsequently liquidated.

    How significant were the recent liquidations?

    Extremely significant. In the last 24 hours, total liquidations reached $515.05 million, with short positions accounting for 89% ($457.26 million). The 4-hour window alone saw $286.14 million in short liquidations versus only $20.41 million in longs.

  • Binance Launches Realized Perp Slippage Metric for Traders

    Binance Launches Realized Perp Slippage Metric for Traders

    Binance Launches Realized Perpetual Slippage Metric to Improve Trading Execution Insights

    Binance has introduced a new analytical tool called realized perp slippage, designed to give traders a clearer view of order execution quality on its perpetual futures market. The metric measures the gap between expected slippage — calculated from a pre-execution order book snapshot — and the actual slippage experienced when a market order fills. By quantifying this difference, Binance aims to help users assess execution efficiency and refine their trading strategies in real-time.

    How the Realized Perp Slippage Metric Works

    The system captures the state of the order book immediately before a market order is executed, establishing a baseline for expected slippage. Once the order fills, the actual execution price is compared against that baseline. The resulting realized perp slippage figure reveals whether traders received better or worse fills than anticipated, offering a transparent benchmark for execution performance.

    This approach addresses a long-standing challenge in crypto derivatives trading: the opacity of slippage during volatile or thin-liquidity conditions. With this metric, traders can now audit execution quality post-trade, identify patterns, and adjust order types, timing, or venue selection accordingly.

    By the Numbers: A Snapshot of Current Discrepancy

    At the time of publication, Binance’s dashboard shows an expected slippage level of $0.94 versus an actual fill slippage of $1.63 — a notable divergence that highlights the practical impact of execution variability. Such gaps can erode profitability, especially for high-frequency or large-volume strategies where slippage compounds rapidly.

    The release comes amid mixed momentum across major crypto assets, with some showing bullish structure while others face selling pressure. In this environment, tools that quantify execution risk become increasingly valuable for risk management and strategy optimization.

    Strategic Implications for Traders

    As the market absorbs this new data layer, several behavioral shifts may emerge:

    • Execution monitoring becomes a routine part of post-trade analysis.
    • Traders may favor limit orders or algorithmic execution during periods of high realized slippage.
    • Comparative venue analysis could drive order flow toward exchanges with tighter realized slippage profiles.

    Binance, already recognized for its extensive suite of trading analytics, strengthens its platform’s appeal to institutional and professional traders who demand measurable execution transparency.

    What to Watch Next

    Market participants should track how realized perp slippage trends correlate with volatility regimes, funding rate shifts, and order book depth changes. Persistent deviations between expected and actual slippage may signal structural liquidity issues or latent market stress.

    Over time, this metric could influence product development — such as dynamic fee tiers, improved matching engine logic, or new order types designed to minimize slippage risk.


    Disclaimer: This article is for informational purposes only and does not constitute financial advice. Trading cryptocurrency derivatives involves significant risk; users should conduct independent research and consider their risk tolerance before engaging in any trading activity.

  • Clarity Act Fails to Pass, Sparking Investor Concern

    Clarity Act Fails to Pass, Sparking Investor Concern

    Crypto Derivatives Face Uncertainty After Clarity Act Failure

    The collapse of the Clarity Act has triggered significant concern across the cryptocurrency derivatives market, with sophisticated investors warning that regulatory ambiguity may drive institutional capital away from speculative trading products.

    Market Reaction: Volumes Vanish Amid Regulatory Void

    Trading activity has ground to a near halt. According to market data cited by crypto commentator Pentosh1, derivatives volumes dropped to $0 in the last 24 hours, signaling a abrupt withdrawal of liquidity as participants digest the legislative setback. The absence of trading reflects a cautious stance from both retail and institutional actors reassessing exposure in the absence of clear regulatory guardrails.

    Institutional Hesitation Grows

    The Clarity Act was designed to establish a coherent regulatory framework for digital assets, aiming to encourage deeper institutional engagement. Its failure removes a anticipated pathway for compliance, leaving fund managers, market makers, and custodians without the legal certainty required to scale derivatives operations.

    Pentosh1 notes that sophisticated investors are worried that institutions may refrain from engaging with speculative derivatives, a dynamic that could amplify price swings as hedging and market-making capacity contracts.

    Sentiment Turns Fragile

    Social media chatter has shifted toward anxiety-driven memes and speculation, underscoring a broader loss of confidence. Traders are questioning the viability of leveraged positions and structured products in an environment where regulatory risk is now the dominant variable.

    What Comes Next

    Market participants are now monitoring:

    • Regulatory signals from the SEC, CFTC, and congressional leadership
    • Derivatives exchange responses — including potential product delistings or margin hikes
    • Institutional custody and prime brokerage announcements

    Analysts warn that prolonged uncertainty could trigger liquidation cascades if leveraged positions are unwound en masse. The coming weeks will determine whether the market stabilizes around alternative compliance models or enters a deeper retrenchment.

    Bottom Line

    The Clarity Act’s failure has injected a new layer of systemic risk into crypto derivatives. Without legislative clarity, institutional participation — critical for depth, stability, and innovation — remains on hold. Traders should prepare for elevated volatility and fragmented liquidity until a new regulatory signal emerges.