Tag: Bitcoin price analysis

  • Bitcoin’s Failed $81,000 Breakout Puts $75,000 Back on the Table

    Bitcoin’s Failed $81,000 Breakout Puts $75,000 Back on the Table

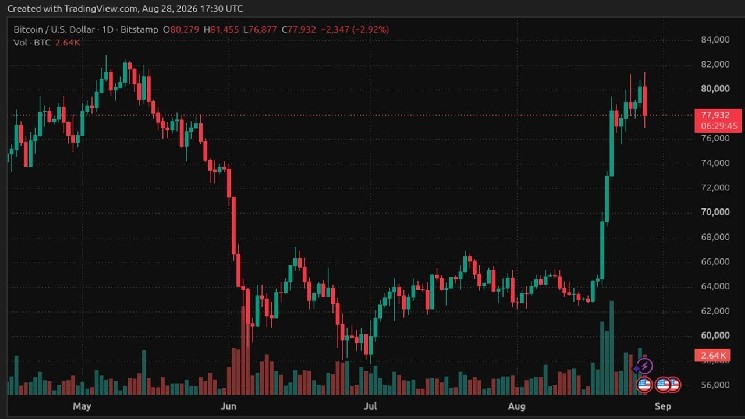
    Bitcoin is trading near $78,000 heading into the weekend, positioned between support at $77,000 and resistance at $80,000 after a sharp rejection above $81,000 on Aug. 28.

    A confirmed break below $77,000 could expose the mid-$75,000s. Conversely, a sustained move back above $80,000 would bring Bitcoin’s Aug. 28 high near $81,300 and the $82,000–$83,000 zone back into focus.

    Bitcoin Reverses After Jackson Hole Rate Shock

    Bitcoin reversed from its Aug. 28 intraday high after Kevin Warsh’s Jackson Hole remarks pushed the probability of a September rate hike to around 55%, up from roughly 40% before the speech. Warsh said the Fed still had work to do if inflation failed to return toward its target.

    The resulting repricing pushed Bitcoin back below $80,000 by the close. A level buyers had briefly reclaimed turned into resistance, leaving $77,000 as the immediate level traders must defend.

    Friday’s Bitcoin Options Expiry Removes a Major Market Anchor

    Approximately 81,700 Bitcoin options worth about $6.44 billion expired on Deribit Friday at 08:00 UTC. The expiry removed a positioning cluster that had helped anchor Bitcoin near key strike prices throughout the week.

    Calls outnumbered puts by a ratio of 0.83. The largest concentration of call open interest was around $75,000 and $80,000, the same two levels now defining the weekend’s downside and upside scenarios.

    U.S.-traded spot Bitcoin ETFs recorded nine consecutive days of net inflows through Aug. 27, totaling roughly $3 billion. That source of demand pauses over the weekend because ETF creation and redemption activity follows the same weekday schedule as U.S. equity trading.

    CME shifted to 24/7 trading in late May, with only a weekly maintenance window interrupting the schedule. Regulated institutional derivatives can now respond directly to Saturday and Sunday price moves, well before the Sunday evening Globex reopening that previously marked the return of futures activity.

    As a result, Bitcoin enters the weekend with one of its strongest recent demand channels offline while the market that once remained largely dormant is still fully active.

    Key Bitcoin Price Levels Traders Are Watching

    Above the current price, $80,000 is the key trigger. A sustained reclaim would suggest that buyers absorbed the Aug. 28 hawkish shock and turned the failed breakout into a bear trap.

    That move could open a path toward the Aug. 28 high near $81,300 and then toward the $82,000–$83,000 zone, where fresh options positioning overlaps with technical resistance.

    Below the market, $77,000 plays the same role in reverse. Bitcoin’s Aug. 28 low was printed near $77,078. A loss of that level followed by sustained acceptance below it over several hours would shift the setup from consolidation toward continued downside.

    The initial target would be $75,000–$75,500, an area that already carries heavy options interest from the Aug. 28 expiry.

    A deeper break below $75,000 could expose the low $70,000s, with $72,000–$73,000 emerging as the next significant target if selling pressure holds. The $69,000–$70,000 region remains a longer-term support zone.

    Reaching that area over a single weekend would likely require a larger liquidation event or an additional macroeconomic shock beyond the Aug. 28 repricing.

    Bitcoin Price Targets From Citi and Bernstein

    Citi cut its 12-month Bitcoin target to $82,000 from $112,000 in July, reduced its ETF inflow assumption to zero, and placed its recession-driven bear case near $53,000. That makes the weekend’s $82,000–$83,000 upside zone notable in its own right because it now overlaps with a major bank’s full-year base case from only eight weeks ago.

    Bernstein’s longer-term outlook is far above the levels relevant to this weekend. The bank has pointed toward $150,000 by mid-2027 and as high as $500,000 in a debasement-driven bull case.

    That forecast applies to an entirely different timeframe and provides context for where Bitcoin could trade over the coming years.

    Bitcoin Bull and Bear Cases for the Weekend

    The bullish scenario has Bitcoin reclaiming $80,000 and clearing the Aug. 28 high. CME’s continuous futures market could reinforce that move through the weekend even without support from ETF flows.

    Under that path, $82,000–$83,000 becomes the next major test, while the failed breakout above $81,000 could be interpreted as a shakeout within an intact uptrend.

    The bearish scenario has Bitcoin losing $77,000 and establishing genuine acceptance below the level, forcing out buyers who chased the move above $80,000 earlier in the week.

    In that case, $75,000–$75,500 would become the immediate target. A further breakdown there could open $72,000–$73,000 as the market prices in a correction that has grown beyond the Aug. 28 single-day rate shock.

    Bitcoin’s next major move could be decided before U.S. ETF desks reopen Monday, with regulated futures now trading continuously through the weekend.


  • Bitcoin Gains Continue, but One Analyst Remains Cautious: “I Haven’t Seen What I’m Looking For Yet”

    Bitcoin Gains Continue, but One Analyst Remains Cautious: “I Haven’t Seen What I’m Looking For Yet”

    Bitcoin’s recent cryptocurrency market recovery has revived bullish expectations, but on-chain data suggests the market may still face further downside. Alphractal founder Joao Wedson said Bitcoin may not have reached the cycle’s ultimate price bottom, warning that the BTC price could fall to $53,000 or lower if historical patterns repeat.

    Wedson’s analysis focused on the MVRV Z-Score, an on-chain indicator used to assess market value, realized value and investor behavior. He said on-chain metrics reflect how investors behave during periods of market euphoria and fear, making them relevant for evaluating Bitcoin’s broader market cycles.

    Bitcoin’s 2018 Crash Offers a Historical Comparison

    Wedson compared Bitcoin’s current market structure with the 2017–2018 cycle. According to his analysis, the MVRV Z-Score formed three major peaks during the 2017 bull market before Bitcoin reached its all-time high.

    After Bitcoin peaked and began to decline, the indicator formed a base between approximately 0.25 and 1.16. Wedson noted that many market participants did not expect another sharp drop at the time. However, Bitcoin fell again in November 2018, reaching approximately $3,180.

    During the 2024–2025 period, the MVRV Z-Score also formed three separate peaks, Wedson said. He added that enthusiasm around those peaks was more limited than in 2017 because the market had become more complex than in previous cycles.

    Following Bitcoin’s recent decline from its peak, the MVRV Z-Score formed a base in an area similar to the one observed in 2018. Wedson said the indicator has recently risen again, with Bitcoin’s price moving higher alongside it.

    “MVRV Z-Score Has Not Yet Fallen into Negative Zone”

    Wedson identified the indicator’s failure to enter the negative zone as the primary risk. Historically, that zone has been associated with major Bitcoin cycle lows.

    Wedson stated that based on the available data, he constantly asked himself the same question: If the MVRV Z-Score needs to go down, will the Bitcoin price follow the indicator?

    Based solely on on-chain data, the Alphractal founder said there are not enough signals to confirm that Bitcoin’s current decline represents the ultimate market bottom.

    Wedson said Bitcoin may need to fall to at least approximately $53,000 or even lower for the conditions he is monitoring to be met.

    The analyst emphasized that his assessment was not financial advice. He said it was a direct examination of the data rather than a challenge to the current bullish narrative in the market.

    Recalling that most market participants also did not anticipate another sharp decline in 2018, Wedson said the key question was whether the current Bitcoin cycle would end in a similar way to previous cycles.

    At this stage, Wedson said, on-chain indicators point to continuing downside risks rather than definitively confirming that “the bottom has been reached” for Bitcoin.

    This is not investment advice.

  • Bitcoin Rally Stalls, but Long-Term Sentiment Remains Bullish

    Bitcoin Rally Stalls, but Long-Term Sentiment Remains Bullish

    Bitcoin fell to $76,877 on Friday after Federal Reserve Chair Kevin Warsh delivered a hawkish keynote at Jackson Hole, confirming the resistance zone that had limited the cryptocurrency earlier in the week.

    September rate-hike expectations rose to approximately 56%, up from about 35% a day earlier, after Warsh said the Federal Reserve still has “work to do” on inflation. Despite the sell-off, Myriad traders continued to favor Bitcoin rising to $84,000 over falling to $55,000.

    Bitcoin declined from an overnight high of $81,455, surrendering most of its double-digit weekly gain. The high was reached within a resistance zone that had already capped several attempted breakouts this year.

    Myriad: How high will Bitcoin go? Click to make your prediction.

    Warsh’s Jackson Hole speech drives Bitcoin lower

    Warsh marked his 100th day as Fed chair by offering markets no fresh policy guidance, but his comments were enough to pressure risk assets. In his keynote, he said the Fed needs to see inflation moving clearly toward its target and doing so at a sufficient pace before it can declare its work complete. Until then, the central bank still has “work to do.”

    Traders interpreted the remarks as hawkish. According to the CME Group’s FedWatch tool, the probability of a September rate hike increased to 55.7% from 35.4% the previous day.

    The move also affected leveraged crypto positions. CoinGlass data showed approximately $481 million in liquidations across the cryptocurrency market during the 24 hours surrounding the speech. More than $360 million involved long positions caught off guard by Bitcoin’s decline. Bitcoin ended Friday at $77,557, down 3.39%.

    Bitcoin price analysis: What the charts show

    From a technical perspective, the pullback looks more like a consolidation phase than a confirmed trend reversal. Bitcoin’s Relative Strength Index stands at 69.7, below the overbought level above 80 that preceded Tuesday’s rejection. Meanwhile, the Average Directional Index is near 39.5, still indicating a strong trend rather than a broken one.

    Bitcoin remains within the bullish move that carried it from the June low near $68,858 to this week’s high around $81,455. If selling intensifies, traders are likely to monitor the $73,670-$75,157 area first. A close below that zone would put both the 50-week moving average and the June breakout structure under pressure.

    On the upside, the $81,000-$82,500 area remains the key resistance shelf. Bulls need to reclaim it to establish a path toward fresh highs.

    Myriad traders continue to favor Bitcoin at $84,000

    The longer-term bullish outlook is reflected in Myriad’s “BTC next move” market, which has been active since late February. The market has recorded $231,000 in trading volume and has no fixed resolution date.

    Its two outcomes—a move to $84,000 or a decline to $55,000—have repeatedly exchanged the lead since spring as Bitcoin’s price moved sharply in both directions. That pattern changed this month: the probability of the $84,000 outcome rose by 31.7 percentage points to 77%, compared with 23% for the $55,000 scenario. Friday’s rejection from resistance did not materially alter that split.

    Myriad: Where does Bitcoin go next? Click to make your prediction.

    The last time traders were this bullish was around April.

    Bitcoin’s fundamental support remains intact

    The fundamental case for higher Bitcoin prices has not significantly changed. U.S. spot Bitcoin exchange-traded funds recorded $2.8 billion in inflows over eight consecutive days through Wednesday, their longest such streak since April.

    The demand followed a Treasury Department announcement that it would at least double its purchases of long-dated bonds beginning September 9. The move supports a segment of the bond market that has faced weak demand since June. Lower long-term yields and a weaker dollar revived the “debasement trade” that helped Bitcoin climb from approximately $62,000 to $80,000 this month.

    Warsh’s remarks did not change that backdrop. He outlined no explicit interest-rate path and instead highlighted an inflation condition the Fed has not yet met.

    Why Bitcoin traders should watch the bears

    In the short term, the market setup still calls for caution. Warsh’s rejection of forward guidance leaves traders without a clear policy signal until the Fed’s next rate decision. Bitcoin therefore remains vulnerable to headline-driven volatility around every inflation report released before then.

    The PCE price index is increasing at an annual rate of 3.7%, nearly twice the Fed’s 2% target, and Warsh provided no timetable for inflation to return to that level.

    Bitcoin has already faced multiple rejections at the current resistance zone in recent months. Warsh’s speech gave bulls no clear reason to expect the Federal Reserve to make the next attempt at a breakout easier.

    Disclaimer

    The views and opinions expressed by the author are for informational purposes only and do not constitute financial, investment, or other advice.

  • Bitcoin Rejects $81,500 as Whales Build Massive Sell Wall at $81K

    Bitcoin Rejects $81,500 as Whales Build Massive Sell Wall at $81K

    Bitcoin lost momentum after briefly breaking above $81,000 as traders awaited Federal Reserve Chair Kevin Warsh’s inaugural Jackson Hole speech. The cryptocurrency fell soon after reaching the key resistance level for the second time this week, echoing its Aug. 25 retreat after bitcoin climbed above $80,000 for the first time in more than three months.

    Market data showed bitcoin reaching a high of $81,455 shortly after 9:30 p.m. Thursday, temporarily overcoming bearish pressure that had intensified since Tuesday. A sharp sell-off then erased the gains recorded on Aug. 27, pushing bitcoin to a session low of $78,442 at around 10:15 a.m.

    More than an hour after Warsh’s speech, bitcoin dropped to a new low of $76,877 before quickly recovering above $77,000 and testing $78,000.

    Bitcoin’s Weekly Gains Narrow as Liquidations Rise

    The retreat reduced bitcoin’s weekly gain to 2% and lowered its market capitalization to $1.58 trillion from more than $1.61 trillion. Despite the pullback, bitcoin remains on track for double-digit monthly gains following its sharp rally between Aug. 19 and Aug. 21.

    In the derivatives market, bitcoin’s reversal less than 24 hours after reclaiming $80,000 triggered $107 million in liquidations across long and short positions. Data from Coinglass showed a relatively even split, with $50 million in long positions and $57 million in short positions wiped out. Across the wider cryptocurrency market, approximately $300 million in leveraged positions disappeared.

    According to market analysis outlet Cryptoreviewing, bitcoin’s early-morning surge to $81,500 followed by an immediate decline below $79,300 contributed to $465 million in 24-hour liquidations. That figure was significantly higher than the standard derivatives losses indicated by exchange data alone.

    In a post on X, Cryptoreviewing said bitcoin swept the upside liquidity zone between $80,400 and $81,600 almost perfectly but failed to hold above $80,000. The failure weakened short-term momentum and shifted the near-term market bias back toward caution.

    Bitcoin Order-Book Liquidity Skews Lower

    Cryptoreviewing also highlighted a sharp imbalance in liquidity distribution. Approximately $5.7 billion is positioned below the market between $75,000 and $78,500, compared with about $2.8 billion above between $81,500 and $84,000. The analysis said the imbalance leaves a deeper bitcoin pullback as a meaningful higher-timeframe risk.

    On lower timeframes, the largest liquidity pockets are concentrated around $78,600 and $79,100 below the market, and $81,300 and $81,900 above it. The analysis identified these levels as the most likely sweep zones in the near term.

    In its order-flow analysis, Cryptoreviewing said whales were maintaining significant sell walls between $80,800 and $83,000. Large bids remained stacked around $78,000 to $79,000 and at lower levels, suggesting institutional buyers were continuing to buy dips while bitcoin faced a formidable ceiling for further gains.

    Open interest has rebuilt, futures traders are adding exposure, and the Coinbase Premium has turned positive. However, weakening spot demand suggests leverage is returning faster than organic buying.

    Warsh Rejects Forward Guidance

    In his address, Warsh reiterated his rejection of “forward guidance”—the signaling strategy favored by previous Federal Reserve chairs—arguing that persistent inflation continues to threaten economic momentum despite recent positive data.

    He called for a return to traditional central banking, with interest rates adjusted as economic conditions change to maintain price stability without destabilizing employment.

    The Iran war and surging crude oil prices have clouded the outlook for U.S. economic growth. However, Warsh maintained a resilient tone, pointing to unprecedented corporate spending on technology and artificial intelligence infrastructure as a powerful counterweight.