Category: Coins

Digital assets, cryptocurrencies, blockchain, and currency news.

  • Shiba Inu’s (SHIB) 87 Trillion Threshold Is on the Verge of Breaking Down

    Shiba Inu’s (SHIB) 87 Trillion Threshold Is on the Verge of Breaking Down

    Shiba Inu exchange reserves are nearing a major on-chain milestone, with holdings just below 87 trillion $SHIB. The latest data shows approximately 86.9973 trillion tokens in exchange-linked wallets, leaving a gap of about 2.7 billion $SHIB. Relative to the total reserve, that difference is negligible.

    Rising exchange reserves could pressure $SHIB

    Shiba Inu exchange reserves could move above 87 trillion without any extraordinary transfers. Reserves increased by a further 0.04% over the past 24 hours, but that rise would not necessarily be bullish for $SHIB.

    Exchange reserves measure the amount of an asset held in wallets associated with cryptocurrency exchanges. Sustained growth generally means more tokens are immediately available for trading and potential selling. Conversely, declining reserves can indicate that tokens are moving into private custody.

    Current flow data also favors exchanges. Total $SHIB inflows stand at 271.53 billion tokens, compared with outflows of 222.25 billion. This leaves netflow positive at approximately 34.47 billion $SHIB.

    Some conflicting signals remain. The seven-day moving average of mean exchange outflows has declined 40.62% to roughly 502.1 million $SHIB. Although total outflows increased by 0.5%, the ordinary mean outflow rose by 0.51%. This suggests there is no significant withdrawal wave capable of rapidly reducing exchange reserves at present.

    Shiba Inu price remains near key support

    The 87 trillion reserve threshold is particularly important because of recent $SHIB price action. After recovering from the $0.000005 region, Shiba Inu is trading at approximately $0.00000518. That price is close to both the shorter-term average at $0.00000501 and the 100-day EMA at $0.00000498.

    $SHIB has therefore maintained its immediate technical support, although upside momentum remains limited. The Relative Strength Index is near 54, pointing to neutral-to-moderately bullish momentum rather than an overheated market.

    The 200-day EMA at $0.00000570 remains the more significant resistance level. A recent move above that threshold was quickly rejected. Selling pressure could become more difficult to absorb if exchange reserves firmly exceed 87 trillion while inflows continue to outpace outflows.

    For now, the 87 trillion level is primarily psychological. The more important factor will be whether reserves continue rising after the threshold is crossed while $SHIB struggles to move decisively away from $0.000005.

    Source: cryptonews.net
  • SEC Proposes Broad Update to Decades-Old Transfer Agent Rules With Blockchain Nod

    SEC Proposes Broad Update to Decades-Old Transfer Agent Rules With Blockchain Nod

    The US Securities and Exchange Commission (SEC) has proposed the most significant overhaul in decades of the rules governing transfer agents, as blockchain-based recordkeeping and tokenized securities gain traction in US financial markets.

    The proposed SEC transfer agent rules would update requirements for registration, recordkeeping, securities safeguarding and transfers. They would also introduce new compliance measures addressing risks linked to increasingly digital and automated market infrastructure.

    “Market participants are actively seeking to bring blockchain-native, or ‘onchain’ transfer agents into the U.S. market,” the SEC said, citing potential applications including blockchain-based recordkeeping, tokenized fund administration and cross-chain interoperability.

    The agency said its current regulatory framework does not adequately address these developments. In particular, the SEC identified risks involving cybersecurity, operational resilience and the protection of securities and investor records.

    Under the proposal, transfer agents would face expanded reporting obligations and additional compliance standards. The changes would include requirements covering restrictive legends on securities and the use of third-party service providers.

    SEC’s proposed Transfer Agent Rules. Source: SEC

    SEC transfer agent rules date back decades

    The SEC said its transfer agent rules have not undergone substantive updates since the late 1970s and early 1980s, when the industry still depended heavily on paper certificates and manual recordkeeping.

    The regulatory agency is seeking public comment on the proposed changes. Comments will be due 60 days after the proposal is published in the Federal Register.

    Related: CFTC chair says agency will move forward with crypto regulation if CLARITY fails

    SEC advances broader securities rule changes

    The SEC is “on a mission to simplify its rules,” according to an analysis from law firm Cahill Gordon & Reindel that was sent to clients on Tuesday.

    In May, the SEC proposed three major changes to public-company reporting and securities rules. The proposals would allow companies to choose semiannual reporting, simplify the current filer classification system and expand access to streamlined registered securities offerings.

    Last week, the SEC sent a proposed overhaul of custody rules for investment advisers and investment companies to the White House for review. The potential changes include provisions on how firms hold crypto assets for clients.

    The proposed custody changes could establish clearer standards for investment advisers and funds holding digital assets while they comply with federal securities regulations.

    Magazine: Does the Bitcoin rally mean we haven’t wasted our lives in crypto?

  • ‘DOGE Safe’: Dogecoin Wallet Issues Migration Alert Ahead of Asset Support Cutoff

    ‘DOGE Safe’: Dogecoin Wallet Issues Migration Alert Ahead of Asset Support Cutoff

    Dogecoin wallet MyDoge has announced that it will end support for Doginals and DRC-20 assets on September 17, 2026, following the planned shutdown of the Dogecoin API operated by its third-party infrastructure provider, Maestro.

    Doginals are digital assets inscribed on the Dogecoin blockchain, similar to Bitcoin Ordinals-style inscriptions. Maestro has announced that its Dogecoin API services will shut down on September 18, 2026, prompting MyDoge to suspend related support one day earlier.

    🚨 Important notice regarding Doginals and DRC-20 support in MyDoge.Maestro, the third-party infrastructure provider used by MyDoge for Doginals and DRC-20 support, has announced the shutdown of its Dogecoin API services on September 18, 2026. As a result, MyDoge will suspend…
    — MyDoge (@MyDoge) August 31, 2026

    MyDoge described the development as an ‘unexpected and inconvenient change’ for asset holders and said it aims to provide clear guidance ahead of the support deadline.

    Users holding Doginals or DRC-20 assets in MyDoge are urged to migrate those assets to compatible wallets before September 17, 2026.

    Regular DOGE transactions are not affected

    MyDoge said the advisory does not apply to regular $DOGE holdings or other supported assets. Users do not need to move their $DOGE out of the wallet, and standard Dogecoin transactions will continue as normal.

    The wallet provider also said that the end of Doginals and DRC-20 support will not delete the assets from the Dogecoin blockchain. Affected assets will remain associated with users’ addresses onchain, but MyDoge will no longer have the infrastructure needed to display or send them after September 17.

    As a result, users may be unable to access or recover affected assets through MyDoge after the deadline. MyDoge recommends transferring them to a compatible wallet beforehand.

    MyDoge shares migration safety tips

    MyDoge has advised affected users to rely on official links, confirm that their chosen wallet supports the specific Doginals or DRC-20 assets they hold, and consider sending a small test transaction before transferring the full balance.

    Users should also beware of unsolicited messages, links, accounts offering migration assistance, and anyone requesting seed phrases or private keys. MyDoge said it will never ask users to provide those sensitive details.

    MyDoge is reviewing possible options for supporting Doginals and DRC-20 assets again in the future. However, the wallet provider has not confirmed a replacement service or timeline, so users should treat September 17, 2026, as the migration deadline.

  • Shiba Inu (SHIB) Forms Bull Flag: Can It Erase a Zero Soon?

    Shiba Inu (SHIB) Forms Bull Flag: Can It Erase a Zero Soon?

    Traders have identified a bull flag pattern on the Shiba Inu (SHIB) price chart, raising the possibility that the meme cryptocurrency could remove a zero from its price in the coming days.

    A bull flag typically forms after a sharp upward move, followed by a period of downward-sloping consolidation. Traders often view the pattern as a potential continuation setup, particularly when the price breaks above the flag’s upper boundary on strong volume.

    “$SHIB is making Bull Flag,” said crypto trader $SHIB Knight. “Good chance to delete a zero in the coming days.”

    $SHIB is making Bull Flag. Good chance to delete a zero in the coming days.

    — $SHIB KNIGHT (@army_shiba), September 1, 2026

    In cryptocurrency market terminology, “deleting a zero” means removing one zero after the decimal point. For Shiba Inu, that would potentially mean reaching $0.00001.

    At the time of writing, SHIB was trading at $0.000005162, up 3.35% over the previous 24 hours but down 4.25% over the past week.

    The broader market is consolidating after a short squeeze drove cryptocurrency prices higher over the past week. However, the pause has not significantly weakened crypto’s relative strength, with most digital assets trading in positive territory over the last 24 hours.

    Crypto market open interest remained stable near $137.42 billion, while trading volume fell by nearly 14%. The data suggests traders are adding neither significant long nor short positions and are waiting for a clearer directional signal.

    Can Shiba Inu Reach $0.00001?

    Shiba Inu recovered from a three-day decline that took the price to a low of $0.00000488 on August 30, marking its second consecutive day of gains. The rebound had pushed SHIB to an intraday high of $0.00000523 at press time, with the price now approaching the daily 200-day moving average at $0.00000537.

    A break above the daily 200-day moving average could put $0.00000553 and $0.00000575 in focus, followed by $0.00000623. A decisive move above those levels could open the way toward $0.00001017, potentially removing a zero from Shiba Inu’s price.

    A potentially bullish market signal has also emerged as the Korean premium turns positive, suggesting that Korean investors may be returning to the cryptocurrency market.

    According to CryptoQuant, the Korea premium had remained negative for the longest period in its history before recently beginning to turn positive. The shift indicates that investors in the Korean market are starting to show increased interest in cryptocurrencies.

  • CME Becomes Largest XRP Futures Venue as Open Interest Surges to 400 Million XRP

    CME Becomes Largest XRP Futures Venue as Open Interest Surges to 400 Million XRP

    CME Group has overtaken Binance as the largest venue for $XRP futures open interest by notional value, highlighting a shift toward regulated markets as professional trading activity increases.

    CME Leads the $XRP Futures Market

    CME’s $XRP futures open interest increased from 284 million $XRP on August 17 to 387 million $XRP on Aug. 31, a rise of approximately 36% in two weeks. During the same period, $XRP climbed from about $0.99 to $1.38, posting a gain of nearly 40%.

    CME moved ahead of Binance on Sept. 1 based on the notional value of $XRP futures open interest. Data from CoinGlass showed that CME held approximately 410,000 $XRP contracts worth about $530 million. Binance had roughly 375,000 contracts valued at approximately $510 million.

    CME now represents about 17% of total $XRP futures open interest, up from approximately 10% in mid-August. Its market share therefore increased by 7 percentage points in roughly two weeks.

    The shift is notable because it occurred alongside a nearly 40% increase in the price of $XRP, pointing to stronger participation from professional market participants.

    Total $XRP Futures Open Interest Falls

    Across all exchanges, however, the broader $XRP futures market moved in the opposite direction. Total futures open interest declined from approximately 2.77 billion $XRP to 2.34 billion $XRP between Aug. 17 and 31, representing a drop of about 16%.

    Exchanges outside CME accounted for most of the decline. Their combined futures positions fell by approximately 533 million $XRP, or 21%, during the same period. CME continued adding positions while traders on other platforms reduced their exposure.

    This created an unusual market pattern: $XRP rose nearly 40% even as total futures open interest dropped 16%. Strong rallies often coincide with rising open interest as traders establish leveraged positions. In this case, the market reduced its overall leveraged exposure while CME’s share continued to expand.

    The trend suggests that the recent $XRP rally may not have relied heavily on speculative leverage from offshore exchanges. Stronger spot demand and increased participation from professional traders may instead have played a larger role.

    $XRP ETF Inflows Strengthen Institutional Demand

    Recent $XRP ETF flows also point to growing institutional interest. U.S. spot $XRP ETFs recorded $110.49 million in net inflows during the week ending Aug. 28. It was their strongest weekly inflow of 2026 and lifted cumulative net inflows to approximately $1.66 billion.

    Goldman Sachs also returned to the $XRP ETF market during the second quarter. Its Q2 13F filings showed approximately $87.4 million in exposure across five spot $XRP ETFs, making Goldman the largest disclosed holder among the institutions mentioned. Jane Street and Millennium Management followed.

    Goldman had fully exited its $XRP ETF positions in the previous quarter before rebuilding exposure across five funds in Q2. Its return, together with rising CME futures activity, indicates that regulated investment products are becoming an increasingly important part of the $XRP market.

    Hedge Funds Hold Net Short Positions

    CFTC data through Aug. 25 shows that professional investors have not all adopted a bullish stance. Leveraged funds held 892 long contracts and 3,206 short contracts, leaving them with a net short position equivalent to approximately 116 million $XRP.

    The net short position increased from roughly 57 million $XRP the previous week. However, the data does not necessarily mean that hedge funds are simply betting against $XRP.

    Dealers and asset managers moved in the opposite direction. Dealers increased their net-long exposure by nearly 60 million $XRP, while asset managers added approximately 28 million $XRP in long exposure.

    Source: cryptonews.net

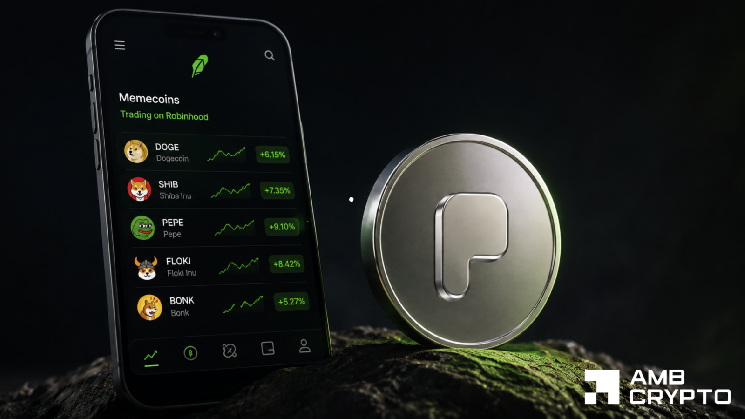
  • PONS Crypto Rises 46% as Market Cap Surpasses $300 Million—Is a $1 Billion Valuation Next?

    PONS Crypto Rises 46% as Market Cap Surpasses $300 Million—Is a $1 Billion Valuation Next?

    $PONS Price Rally Continues as Robinhood Chain Activity Surges

    $PONS debuted on Robinhood Chain after several launchpads became operational, but it has emerged as the leading platform by trading volume, revenue and price performance.

    The altcoin has reached new highs each day since August 23. $PONS gained 49% over the past 24 hours and 425% over the past seven days, while trading volume remained elevated at approximately $116 million.

    What Is Driving the $PONS Rally?

    Growing market reach is one of the main factors behind the token’s surge. $PONS has been listed on multiple decentralized and centralized exchanges. One day after its debut on Hyperliquid DEX, the token was listed on Bybit, where its perpetual contracts offer leverage of up to 20x.

    Analysis of activity on Robinhood shows that $PONS ranks among the platform’s top-trending products for both activity and sentiment. It accounts for 7% of Robinhood’s mindshare, behind Ethereum [ETH], Bitcoin [BTC] and Solana [SOL].

    According to KAITO AI, two-thirds of all tokens launched on Robinhood Chain went through $PONS. More than 517,000 tokens have been created, with combined trading volume exceeding $4 billion.

    Source: KAITO AI

    $PONS has also generated the highest fees of any launchpad on the chain, with daily revenue exceeding $500 million. The platform used 80% of those fees to buy back the token, tightening its supply.

    As the buyback and burning activity continued, nearly one-third of the token supply was permanently removed.

    Whale Holdings Support $PONS Momentum

    Capital inflows have remained strong even among whales who have already secured substantial gains. For example, a whale who purchased both $CASHCAT and $PONS continued to hold profits from the latter.

    After selling the entire $CASHCAT position and locking an initial $113,000 stake in $PONS, the whale still held 9.1 million $PONS tokens, representing $4.20 million in unrealized profits.

    Source: Lookonchain

    Bonk Guy, who bought 1% of the supply when the token had a $6 million market capitalization, is also still holding. The position generated $5 million in profits last week.

    Can $PONS Reach a $1 Billion Valuation?

    Continued interest from whales and key opinion leaders could help $PONS approach a $1 billion valuation. The token has posted new highs for 10 consecutive days, while its Bollinger Bands point to elevated volatility.

    The cumulative volume delta also confirms strong buying activity. More than 2.18 million $PONS tokens had been purchased at press time.

    Source: $PONS/USDT on TradingView

    However, the psychological $0.50 level could present a short-term challenge. If buyers push the token above that threshold, $PONS could open a path toward $1.

    Key Takeaways

    • $PONS gained 49% in 24 hours and reached a new peak near $0.49, while platform trading volume exceeded $4 billion.
    • The token has maintained a 10-day rally as bulls target a $1 billion valuation.
    • The $0.50 level could become a key test if buying momentum begins to weaken.
  • August Was Crypto’s Best Month—But These Bearish Signs You Probably Missed Could Signal Trouble

    August Was Crypto’s Best Month—But These Bearish Signs You Probably Missed Could Signal Trouble

    August was crypto’s strongest month of 2026 so far, but the rally may be less robust than price charts suggest. While Bitcoin and altcoins posted strong gains, profit-taking, leverage and weakening U.S. demand point to a fragile market recovery.

    Crypto market performance in August 2026

    Bitcoin ended August up 24.5%, marking one of its strongest monthly performances of the year. However, data from CryptoRank showed that the combined market capitalization of the top 100 altcoins grew even faster, rising 26.5%.

    The gains were also broad-based rather than concentrated among a handful of leading tokens. The average altcoin rose 24.5%, while the average gain remained a solid 17.1% after excluding outliers. This suggests that smaller and mid-sized cryptocurrencies participated in the rally instead of simply following Bitcoin’s lead.

    Source: CryptoRank/X

    DeFi lending activity also surged

    Decentralized finance lending recorded a significant increase during the period. Active loans across major DeFi protocols climbed from $20.1 billion in June to $26.1 billion in August, representing 30% growth in just two months.

    Aave [AAVE] accounted for more than half of the total, with $12.5 billion in active loans. Morpho [MORPHO] and Spark [SPK] held the next-largest shares.

    The increase indicates that capital is being deployed across DeFi, rather than the market’s gains being driven solely by speculative price momentum. Rising lending activity suggests broader participation across crypto markets.

    Profit-taking creates risks for the crypto rally

    Despite the strong performance, the rally showed signs of vulnerability. Bitcoin rose from approximately $63,000 to $81,500 in just two weeks, prompting many long-term holders to take profits.

    Profit-taking surged twice in a single week, producing some of the year’s heaviest sell-off days outside the January crash. Selling pressure has continued since then.

    Source: CryptoQuant

    U.S. demand also turned positive for several days near the end of August before quickly fading. At around the same time, funding rates reached a yearly high, indicating that traders were relying heavily on leverage.

    Source: CryptoQuant

    The combination of elevated leverage, sustained profit-taking and declining U.S. demand makes the broader crypto rally more fragile than its headline gains imply.

    August crypto market outlook

    Crypto recorded its best year-to-date month in August, with Bitcoin and altcoins both delivering substantial gains and DeFi lending activity accelerating. However, the rally’s underlying strength remains uncertain as investors take profits and U.S. demand weakens.

  • Rain Protocol’s SDK v2 Lowers the Barrier to Creating Prediction Markets

    Rain Protocol’s SDK v2 Lowers the Barrier to Creating Prediction Markets

    Anyone can debate with friends whether a candidate will win an election, a company will beat earnings expectations, or a celebrity couple will stay together. Building a functioning prediction market where participants can stake money on those outcomes is far more complex.

    Prediction markets require infrastructure for creating markets, matching trades, managing liquidity, settling positions, and determining what happens when an outcome is challenged. Until now, much of that work has been concentrated within a small group of platforms that operate the markets themselves. As prediction markets gain users and expand into new applications, attention is shifting from who can trade on these platforms to who can build them.

    Rain Protocol launches SDK v2 for prediction market builders

    Rain Protocol is addressing that challenge with the second version of its software development kit. The permissionless prediction market protocol has launched SDK (Software Development Kit) v2, enabling developers and AI agents to create and operate independent prediction market platforms on networks such as Arbitrum One. The release also includes migration guides for existing users moving from version 1 to version 2.

    SDK v2 incorporates core infrastructure directly into the protocol, including market creation, trading, settlement, resolution, disputes, and appeals. This reduces the amount of work developers need to do at the infrastructure level, allowing them to focus more on the product layer—such as deciding which markets to create and how users will interact with them.

    AI agents can build and operate prediction markets

    The new SDK is designed for human developers as well as AI agents. Machine-readable documentation and built-in agent skills are intended to help AI coding tools understand the protocol and build on it with greater independence. As AI agents take on more software development tasks, Rain expects them to potentially move beyond assisting developers and play a role in creating and operating prediction markets themselves.

    Roy Shaham, CEO of Rain Protocol said, “As the market expands, we expect the biggest shift to come from users being less passive and increasingly a part of the building process. Our goal with SDK v2 is to give developers the freedom to build new types of markets, explore new ways they can be used, and shape them around their own ideas, and we’re eager to see what our community builds with it.”

    On-chain order books added alongside AMM trading

    SDK v2 also expands the available trading infrastructure by adding an on-chain order book alongside Rain’s existing automated market maker (AMM). Builders can use either system depending on the needs of a market. An AMM can provide automated liquidity, while an on-chain order book allows buyers and sellers to place orders that are matched directly on the blockchain.

    The choice may be significant for markets with different liquidity levels, trading volumes, and user behaviors. Other updates improve the user experience after a market goes live. Users can approve a session once rather than authorize every individual action, while builders can receive real-time updates about trades and other market activity.

    The SDK also enables users to convert collateral into Yes and No positions, then convert those positions back into collateral without changing the market price.

    If prediction markets continue expanding beyond a small number of major platforms, the category’s next phase could be shaped as much by the people building markets as by those betting on them. Rain Protocol’s SDK v2 reflects that shift by making prediction markets easier to build, not just use.

    Source: cryptonews.net

  • Shiba Inu Coin Drops 20%: Could September Trigger SHIB’s Next Rally?

    Shiba Inu Coin Drops 20%: Could September Trigger SHIB’s Next Rally?

    Shiba Inu (SHIB) has erased more than 20% of its late-August gains, but the pullback could create an accumulation opportunity if historical market patterns repeat.

    On a broader timeframe, the memecoin has been gradually recovering lost ground in the second half of 2026, as indicated by its rising channel in purple. However, attempts to hold above the key 200-day moving average (MA) at $0.0000069 have failed, reinforcing that a bullish breakout remains elusive.

    Still, the channel structure could remain intact if the broader cryptocurrency market extends its upward momentum.

    Source: $SHIB/USDT, TradingView

    Could September favor Shiba Inu again?

    Beneath the short-term uncertainty and gradual price action, several bullish signals are emerging for Shiba Inu.

    Cyclical patterns, particularly during the early stages of a bull market, have historically favored Shiba Inu and memecoins more broadly. In 2023, for example, SHIB consolidated at $0.00000678 before surging 70% to $0.000011 by mid-December. During the second leg of the 2024 rally, $SHIB rose 165% to nearly 0.00003.

    During those periods, the broader memecoin market gained 78% and 713%, respectively. So far, the broader memecoin index tracked by VanEck’s MarketVector has climbed 9% from its recent lows. If historical patterns hold and memecoin activity accelerates, $SHIB could follow the same trend.

    Source: MarketVector

    SHIB accumulation remains steady

    Spot-market demand for the memecoin has remained stable despite the broader sell-off in early 2026. This is reflected in the increase, followed by the recent stabilization, of SHIB supply held outside exchanges.

    The data suggests that $SHIB experienced significant accumulation during the crypto winter.

    Source: Santiment

    A similar ‘calm before a storm’ appeared before Shiba Inu’s explosive run from September to November 2024. However, $SHIB’s disinflation and token-burn program slowed considerably in late August and early September.

    Nearly 100M $SHIB tokens were incinerated in early August. Since then, the burn rate has fallen to 1.8M tokens, representing a 98% decline. This contrasts sharply with the 350% increase in $SHIB’s burn rate recorded during July.

    Source: Shiba burn tracker

    Key levels for a potential SHIB rally

    Overall, September could become a strong accumulation period if the market repeats the pattern seen before previous bull runs. However, the 98% decline in the burn rate needs to reverse to strengthen bullish sentiment heading into the fourth quarter.

    An extended rally could receive confirmation if $SHIB reclaims $0.000007. That level also corresponds with the 50-week moving average and has acted as a key barrier to rallies throughout 2026.

    • $SHIB has erased more than 20% of its August gains, but September could provide a springboard for a fourth-quarter rally if history repeats.
    • The $SHIB burn rate has fallen 98%, from 100M tokens to just 1.8M over the past 30 days.
  • Flare (FLR) Joins Top Gainers With 15% Rally as Price Eyes $0.010

    Flare (FLR) Joins Top Gainers With 15% Rally as Price Eyes $0.010

    Flare Price Rally Targets $0.0082 and $0.0084 as Bullish Structure Emerges

    Flare ($FLR) has joined the market’s top gainers with a 15% rally, pushing its price to approximately $0.0065 at the time of writing. Market analysis suggests the advance could continue and potentially establish a new high if the token clears key structural resistance levels.

    Flare’s Bullish Cup-and-Handle Pattern Faces Key Resistance

    $FLR’s recent price action has formed a cup-and-handle pattern, a structure often viewed as a bullish precursor when the price breaks above its neckline. For Flare, that neckline is positioned at the horizontal resistance level of $0.0075.

    A decisive move above $0.0075 could open the way for further gains. The bullish outlook identifies three key price levels: $0.0082 initially, followed by $0.0084, while the most optimistic scenario places $FLR at $0.010. Momentum will be important in determining how far the rally can extend.

    The main hurdle remains the neckline resistance. Clearing that level could determine whether Flare enters a sustained upward move. Even a rally from the current price to the neckline would represent roughly 10% upside.

    Source: TradingView

    Technical Indicators Point to Strength

    Flare’s technical indicators are also showing improved market strength, supporting the possibility of continued upside.

    At the time of this report, the Aroon Indicator shows the Aroon Up line, marked in orange, above the Aroon Down line. The two readings stand at 92.86% and 7.14%, respectively.

    When the Aroon Up line remains above the Aroon Down line, the price has a greater chance of continuing to form higher swings. The most bullish configuration would occur if Aroon Up reached 100% while Aroon Down fell to 0.00%.

    The Accumulative Swing Index (ASI) is also trending upward, indicating a bullish market structure. Although the ASI has ticked slightly lower, as marked in red, the move is more likely to reflect a temporary pullback than the start of a broader market correction.

    Source: TradingView

    Spot Market Demand Could Support the FLR Rally

    Spot market activity could play a decisive role in determining whether Flare’s rally continues. At the time of this report, demand for $FLR had surged significantly.

    CoinGlass data shows that netflow reached approximately $325,000, suggesting that more FLR moved out of exchanges and into private wallets for longer-term holding.

    Source: CoinGlass

    If the trend continues and outflows remain higher than inflows, the movement of capital could support $FLR’s attempt to reach a new high in the near term.

    Flare Price Outlook

    Flare’s bullish cup-and-handle structure puts $0.0082 and $0.0084 in focus, with $0.010 possible if buying momentum strengthens. Strong spot-market demand and rising exchange outflows could further support the rally as buyers push $FLR toward a new high.