Category: Coins

Digital assets, cryptocurrencies, blockchain, and currency news.

  • Shiba Inu Burn Activity Surges 1,307% in 24 Hours

    Shiba Inu Burn Activity Surges 1,307% in 24 Hours

    Shiba Inu Burn Rate Surges 1,307% as 46.25 Million SHIB Tokens Permanently Removed from Circulation

    Shiba Inu’s circulating supply contracted significantly over the last 24 hours following a massive token burn event that permanently removed tens of millions of SHIB from the market. According to on-chain data tracked by Shibburn, the network recorded a substantial four-figure percentage increase in its daily burn rate amid consistently growing network activity.

    46.25 Million SHIB Sent to Dead Wallets in Single Day

    As of Tuesday, September 8, blockchain data confirms that a total of 46.25 million SHIB tokens were transferred to irretrievable dead wallets over the preceding 24-hour period. This large-scale burn activity drove a 1,307% surge in the daily burn rate, signaling heightened on-chain engagement within the Shiba Inu ecosystem.

    The aggressive reduction in supply has pushed the weekly burn volume past 126 million SHIB, representing an approximate value of $678 at current trading prices.

    Price Action Diverges from Burn Momentum

    Despite the bullish implications of reduced token supply, SHIB’s price momentum has shown signs of slowing. The asset is currently trading slightly above the $0.0000052 mark and moving in negative territory for the session. Market analysts note that while large burn events reduce the available supply for sale—potentially boosting demand and improving scarcity—the metric alone cannot sustainably drive price appreciation.

    The current divergence between aggressive supply reduction and stagnant price action is not considered unusual by analysts, as token burns represent only one factor among many influencing market valuation.

    Supply Dynamics and Network Growth

    The latest burn figures underscore a tightening supply dynamic for the leading meme token. By permanently removing tokens from circulation, the network effectively increases the scarcity of remaining SHIB, a mechanism often viewed favorably by long-term holders. However, sustained price movement typically requires concurrent catalysts such as increased adoption, broader market recovery, or fundamental ecosystem developments.

  • Clarity Act Faces Setback: Key Details on Stalled US Cryptocurrency Legislation

    Clarity Act Faces Setback: Key Details on Stalled US Cryptocurrency Legislation

    CLARITY Act Faces Critical Senate Vote Hurdle as Republican Senators Warn of Potential Failure

    The CLARITY Act, legislation designed to establish a comprehensive regulatory framework for the cryptocurrency market in the United States, encounters a significant obstacle ahead of a pivotal Senate procedural vote expected on September 15. Two Republican senators have signaled that the bill may not pass in its current form, raising the prospect of a substantial delay for federal crypto regulation.

    Republican Senators Express Doubts on Bill’s Viability

    Speaking to Semafor, Senator Mike Rounds (R-SD) indicated that the current state of the CLARITY Act “does not look positive for its future.” His colleague, Senator Thom Tillis (R-NC), issued a more explicit warning, stating that the legislation’s fate hinges entirely on negotiations with the White House. Tillis cautioned that if the administration does not act to resolve disputes over ethics provisions, “the CLARITY Act will fail.” This marks the first time a Republican lawmaker has publicly assessed the bill as likely to fail in next week’s proceedings.

    Ethics Provisions Emerges as Key Sticking Point

    The primary friction point centers on ethics regulations covering the president and his family—a core demand from Democratic lawmakers. Two Democratic officials informed Semafor that minimal progress has been made on this front. Democrats are insisting that specific ethics clauses addressing cryptocurrency holdings and activities for the president and his family be incorporated into the Act.

    White House Maintains Support Amid Impasse

    Despite the mounting skepticism on Capitol Hill, the White House maintains its commitment to the legislation. A spokesperson affirmed that President Donald Trump is “committed to seeing the law pass through Congress” and emphasized that the United States “must protect its competitiveness in the digital asset space.”

    September 15 Procedural Vote Requires 60-Vote Threshold

    The Senate is scheduled to hold a critical procedural vote on the CLARITY Act next week. To advance past this initial stage, the bill must secure at least 60 votes. A failure to reach this threshold would significantly delay the effort to create comprehensive federal oversight for the digital asset industry, making the upcoming vote a decisive moment for the future trajectory of U.S. crypto regulation.

    This article does not constitute investment advice.

  • $100 Oil Could Be Bitcoin’s Next Problem

    $100 Oil Could Be Bitcoin’s Next Problem

    Oil Surges Toward $100 as Iran Tensions Escalate

    Brent crude reached a seven-week high near $99 a barrel this week, while West Texas Intermediate climbed above $92. The rally follows Iran’s announcement that it plans to declare a maritime “exclusion zone” around the Strait of Hormuz, warning it will stop ships attempting to pass without permission. This escalation comes after U.S. strikes targeted three Iranian oil tankers over the weekend. Iran has promised a “more intense” response, and Brent prices have surged close to 20% over the past month.

    Why Rising Crude Creates an Inflation Problem

    Oil functions as more than transportation fuel. It feeds directly into shipping costs, plastics manufacturing, fertilizer production, and food supply chains. When crude prices spike this rapidly, the increases appear at gas pumps within days and in grocery bills within weeks. U.S. inflation was already running above the Federal Reserve’s 2% target before this latest geopolitical flare-up. Fed Chair Kevin Warsh has maintained a hawkish stance through the summer, and traders are now pricing in genuine odds of a rate hike rather than a cut, a scenario that appeared unthinkable a year ago.

    The Federal Reserve Faces a Policy Trap

    The Fed balances two sometimes conflicting mandates: controlling inflation and maintaining a healthy labor market. A cooling jobs picture typically argues for lower rates. However, if oil-driven inflation continues climbing, cutting rates risks exacerbating price pressures. Should oil remain near $100, the Fed may delay cuts it would otherwise implement, or hold rates higher for longer than markets currently anticipate. Some forecasters now place the probability of a September rate hike above 50%.

    How Higher Rates Pressure Bitcoin

    Bitcoin offers no yield comparable to bonds or savings accounts. When interest rates and Treasury yields rise, investors gain a superior risk-free alternative, prompting capital to flow out of assets like Bitcoin and into fixed income or cash. Higher rates also tighten overall financial system liquidity, the total pool of money available to chase risk assets. Reduced liquidity generally translates to weaker demand for Bitcoin. When U.S. strikes on Iranian tankers pushed oil higher this week, Bitcoin slipped toward $79,700. A similar pattern emerged on September 2, when renewed conflict drove Brent higher and Bitcoin fell roughly 1.5%.

    Bitcoin’s Safe-Haven Narrative Faces Reality Check

    A Middle East war might appear to be the type of event that drives investors toward Bitcoin as a hedge. In practice, that correlation has not materialized. Bitcoin has largely moved in tandem with equities during this conflict, declining when tensions escalate and stabilizing when they ease. Geopolitical fear alone does not drive capital into Bitcoin. Instead, Bitcoin responds to the direction of interest rates, yields, and overall market liquidity. Geopolitical events matter to Bitcoin only to the extent they alter those financial conditions.

    Potential Bullish Reversal Scenario

    One scenario could eventually benefit Bitcoin. If sustained $100+ oil chokes consumer spending and slows the economy severely enough, the Fed may ultimately be forced to cut rates aggressively to support growth, even with inflation remaining elevated. Should expensive energy damage growth sufficiently to compel aggressive monetary easing, the resulting easier financial conditions could become supportive for Bitcoin. However, a sharp economic slowdown could still pressure risk assets before that liquidity benefit emerges.

    The Critical $100 Oil Threshold

    The $100 per barrel mark represents a psychological and policy inflection point. Below that level, this episode likely remains a volatility event: Bitcoin dips on headlines and recovers as tensions ease. Above it, and sustained, the situation becomes a macroeconomic problem that reshapes Fed policy for months. In that environment, Bitcoin’s trajectory depends less on Iran and more on what Jerome Powell’s successor decides to do next.

  • Solana Tests $100 Support as Whale Traders Bet on Price Rebound

    Solana Tests $100 Support as Whale Traders Bet on Price Rebound

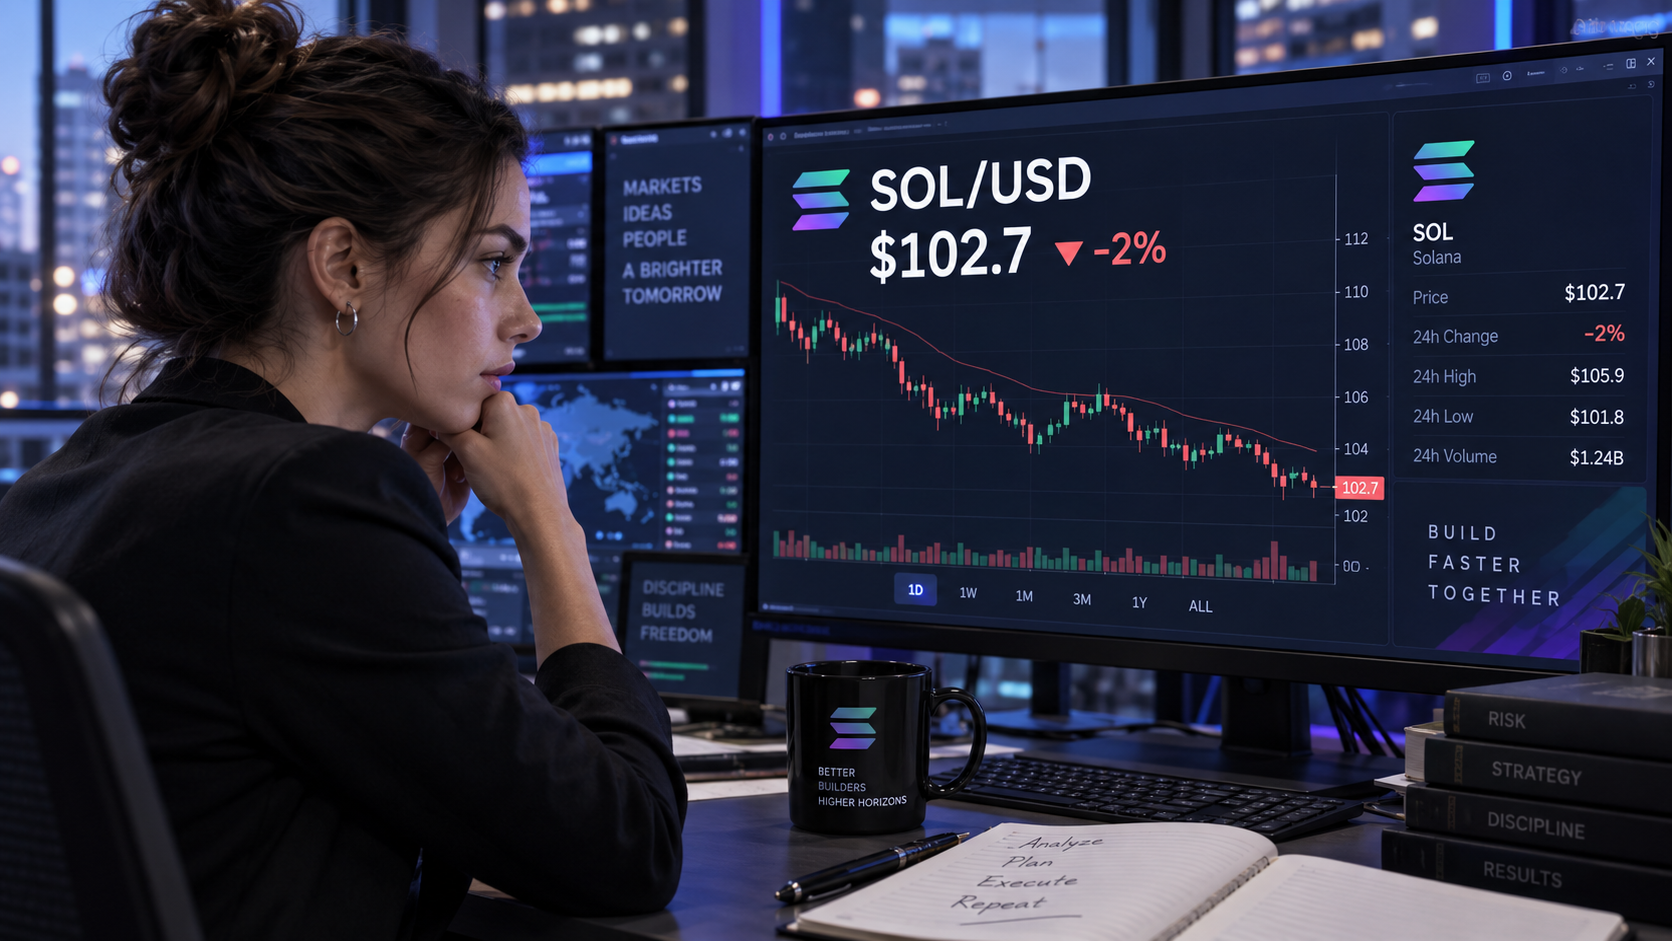
    Solana (SOL) slipped 2% on Tuesday, trading near $102, yet a cluster of large derivatives traders is positioning for a continuation of the asset’s recent recovery. Five whale addresses on Hyperliquid collectively opened $9.11 million in SOL long positions between September 7 and September 8, according to CoinGlass data.

    Whale Long Positions Signal Confidence Ahead of Network Upgrade

    The concentrated bullish exposure suggests these traders expect Solana to extend the rebound that began on August 17. Their combined $9.11 million commitment reflects confidence that the upcoming network improvement could spark renewed buying demand. Long positions profit when the underlying asset rises, though they carry liquidation risk if SOL resumes its decline. While the activity of a few large traders does not guarantee a rally, sizable whale moves often influence sentiment, especially ahead of a major protocol change.

    Solana’s September 9 Upgrade Expands Transaction Capacity

    The scheduled upgrade will raise the maximum transaction size from 1,232 bytes to 4,096 bytes. This increase allows developers to pack more instructions into a single operation, bundling processes that previously required multiple separate transactions. By more than tripling the size limit, Solana aims to support more complex applications and reduce the need to split related instructions across several transactions.

    Additional context on the upgrade can be found in this post by Scott Melker.

    Broader Derivatives Metrics Remain Bearish

    Despite the whale long positions, Solana’s wider futures market continues to show caution. SOL’s funding rate sits at a positive 0.0025%, meaning long holders are paying shorts to maintain their trades — a sign of stronger demand for bullish positions. However, the long-to-short ratio stands at 0.94, indicating short accounts outnumber long accounts. This reading reinforces the view that the five Hyperliquid whales are taking a contrarian stance against prevailing futures sentiment.

    Demand for SOL derivatives has also weakened. Trading volume fell 10% to $6.58 billion, while open interest declined 1.21% to $6.47 billion. Lower volume signals reduced trading activity, and declining open interest shows leveraged positions are being closed. Together, these metrics suggest futures traders are reducing exposure as SOL approaches its upgrade.

    Institutional Demand Paints a More Constructive Picture

    On the institutional side, Solana exchange-traded funds have recorded inflows for ten consecutive weeks. This streak indicates that demand through regulated investment products remains resilient despite weaker futures activity. The result is a divided market outlook: whale positioning and ETF inflows favor an eventual recovery, while negative funding, falling open interest, and a sub‑one long‑to‑short ratio point to short‑term caution. SOL’s reaction to the September 9 upgrade could determine which side gains control.

    Technical Analysis: Symmetrical Triangle Points to $124 Resistance or $84 Support

    On the four‑hour chart, SOL is trading within a symmetrical triangle — a pattern that reflects tightening price action and can break out in either direction. The formation’s projected height is approximately 16%. A decisive break below the lower trendline could send SOL down a similar percentage toward $84. Before that target comes into view, sellers would need to push price below the psychological support at $100.

    Conversely, a clear move above the triangle resistance at $107 could trigger a 16% rally toward $124. Momentum currently leans toward sellers: the Relative Strength Index sits at 44, below the neutral 50 level, and its lower lows indicate growing selling pressure. Solana’s immediate outlook therefore hinges on the triangle’s boundaries. Holding $100 and breaking above $107 would strengthen the whale‑backed bullish scenario, while losing triangle support could expose SOL to a decline toward $84.

  • Solana Price Holds $102.93 as Hourly Momentum Turns Bearish

    Solana Price Holds $102.93 as Hourly Momentum Turns Bearish

    Solana Price Analysis: SOL at $102.93 Faces Cooling Momentum Amid Bullish Daily Structure

    As of September 8, 2026, Solana (SOL) trades around $102.93, positioned at a critical juncture between an intact daily uptrend and mounting short-term pressure. The token sits above all major daily exponential moving averages (EMAs) — EMA20 at $98.79, EMA50 at $90, and EMA200 at $89.26 — while the daily RSI14 reads 61.1, signaling healthy momentum. However, the MACD histogram has turned negative at -0.6, indicating cooling conditions within the broader bullish trend.

    Key Market Metrics at a Glance

    • Current Price: $102.93 (SOL/USDT)
    • Daily EMA Stack: EMA20 $98.79 | EMA50 $90 | EMA200 $89.26 (bullish alignment)
    • Daily RSI14: 61.1
    • Daily MACD Histogram: -0.6 (negative)
    • 1-Hour RSI14: 38.78
    • Total Crypto Market Cap Change (24h): -3.78%
    • Fear & Greed Index: 69 (Greed)
    • DEX Fee Growth (30-day): Raydium +316.68%, Orca +233.26%, HumidiFi +122.81%

    Daily Structure: Bullish Trend Losing Steam

    Solana’s daily trend remains classified as bullish, with price comfortably above all three key moving averages stacked in proper order. This alignment confirms buyers have controlled the multi-week narrative, with pullbacks remaining shallow relative to the trend. The daily RSI14 at 61.1 sits in healthy territory — not overbought, suggesting room for extension before exhaustion concerns arise.

    However, the MACD tells a different story: the MACD line at 5.52 has fallen below the signal line at 6.12, producing a negative histogram of -0.6. This signals momentum cooling off even while the trend structure stays intact — a classic sign of a pause or shallow correction inside an uptrend rather than an outright reversal.

    Bollinger Bands frame the current range with a mid-band at $100.74, upper band at $110.71, and lower band at $90.77. Price hovers just above the midline, nowhere near either extreme, indicating no volatility squeeze forcing immediate directional resolution. Daily ATR14 at 5.23 confirms ample room for movement once direction is decided. Daily pivot levels — pivot point $103.30, resistance R1 at $104.16, support S1 at $102.07 — place current price just under the pivot, essentially a coin-flip zone for the next directional push.

    1-Hour Chart: Momentum Flips Neutral-to-Weak

    The hourly timeframe shows a clear shift. The regime reads neutral with a compressed, indecisive EMA stack: EMA50 ($104.21) above EMA20 ($103.76) above EMA200 ($103.28). RSI14 has dropped to 38.78, leaning toward weakness and suggesting short-term sellers have controlled the immediate tape.

    Hourly MACD confirms the softness: line at -0.52, signal at -0.43, histogram at -0.09 — all negative, pointing to building bearish momentum. Price presses toward the lower Bollinger Band ($102.35) versus the mid ($103.85) and upper ($105.34) bands. Hourly ATR14 at 0.62 shows this pressure occurs in a relatively contained range. The hourly pivot cluster — pivot $102.85, R1 $103.09, S1 $102.69 — is extremely tight, meaning price is pinned near equilibrium awaiting a catalyst.

    15-Minute Chart: Bearish but Possibly Losing Conviction

    The execution-level view is officially labeled bearish with a textbook EMA stack — EMA20 ($103.09) below EMA50 ($103.51) below EMA200 ($104.21). RSI14 at 43.41 isn’t oversold, just soft, consistent with a market drifting lower without panic selling.

    The MACD here is the interesting piece: line at -0.24 versus signal at -0.25, with a histogram essentially flat at 0. This represents a bearish setup losing downside conviction — momentum flattening rather than accelerating. Bollinger Bands are tight (mid $103.04, upper $103.51, lower $102.57) and ATR14 has compressed to just 0.33, the lowest volatility reading across all three timeframes. Low ATR plus flattening MACD on the smallest timeframe often signals compression before an expansion move, direction undetermined until the break.

    Reading the Tension Between Timeframes

    The core conflict is a daily uptrend undergoing a short-term corrective pause, where lower timeframes contest the bullish structure without yet breaking it. The daily chart says trend is up, RSI has room, and structural bias favors buyers. The hourly chart says momentum has curdled and sellers control the immediate tape. The 15-minute chart is bearish by regime label but shows signs of running out of downside energy.

    None of these three stories perfectly agree. What this really looks like is a daily uptrend undergoing a normal short-term corrective pause — the kind of pullback typical inside a larger bullish structure — but one that hasn’t yet resolved back in the bulls’ favor on lower timeframes.

    Bullish Scenario: Reclaiming Key Levels

    A reclaim of the daily pivot at $103.30 and the hourly EMA200 near $103.28 would signal buyers stepping back in across all timeframes. A push through daily R1 at $104.16 would open the door toward a retest of the upper daily Bollinger Band near $110.71, with the daily EMA structure and RSI14 above 60 providing underlying support.

    This scenario gains credibility if broader market conditions stabilize after the recent 3.78% pullback in total crypto market cap, and if on-chain activity across Solana’s DEX ecosystem keeps expanding.

    Invalidation: A daily close back below S1 at $102.07 that holds, especially paired with daily RSI slipping under 50, would suggest the correction is deeper than a simple pause and put the bullish structure genuinely at risk.

    Bearish Scenario: Deeper Correction Toward Daily EMA50

    Should hourly and 15-minute weakness deepen — meaning price loses hourly S1 at $102.69 and can’t reclaim the 15-minute EMA200 near $104.21 — the path of least resistance shifts lower. A slide toward the daily EMA50 near $90, or even the lower daily Bollinger Band at $90.77, becomes a realistic target, particularly if the broader market’s -3.78% mcap drop turns into sustained risk-off rather than a one-day flush.

    Invalidation: A reclaim of the hourly EMA50 ($104.21) alongside the 15-minute EMA50 ($103.51), combined with the MACD histogram flipping positive on both timeframes, would signal sellers have lost control and hand momentum back to bulls.

    Context Beyond the Charts: On-Chain Activity Tells a Different Story

    On-chain activity on Solana’s DEX layer paints a more constructive picture than the token’s short-term price action. The Fear & Greed Index currently reads 69 (Greed) — a sentiment backdrop that doesn’t fully square with a market cap down nearly 4% in a day. That gap between sentiment and price action can produce sharp, fast moves once it resolves.

    DeFi fee data across Solana-based decentralized exchanges shows sustained growth: Raydium AMM fees up 316.68% over 30 days, Orca DEX fees up 233.26%, and HumidiFi up 122.81%, per fee-tracking data. This sustained activity growth suggests real usage isn’t fading even while the token’s short-term price action chops around — a detail that matters more for the macro thesis than for tomorrow’s candle.

    Positioning and Risk: A Coiled Market Waiting for a Catalyst

    Solana currently sits in a genuinely two-sided setup. The daily trend hasn’t broken, but shorter timeframes actively contest it, and compressed volatility on the 15-minute chart (ATR14 at just 0.33) suggests the market is coiling for a move rather than committing to one.

    Traders leaning bullish on the daily structure should recognize they’re fighting hourly and 15-minute momentum in the near term. Those leaning bearish on short-term weakness need to respect that the larger trend, EMA alignment, and RSI room remain stacked against them. Volatility compression rarely lasts — when it releases, moves tend to be quicker than recent price action suggests.

    Given mixed signals across timeframes and a broader market that just shed nearly 4% of its capitalization in a day, this moment calls for patience over conviction, and for waiting on confirmation rather than anticipating which side wins the argument.

    FAQ

    What is Solana’s price today?

    As of September 8, 2026, Solana is trading at approximately $102.93, sitting above its daily EMA20 at $98.79, EMA50 at $90, and EMA200 at $89.26, with all three moving averages stacked in proper bullish order.

    Is Solana’s daily trend still bullish?

    Yes, the daily trend remains classified as bullish with all three key EMAs stacked in proper order and RSI14 at a healthy 61.1. However, the MACD histogram has turned negative at -0.6, signaling momentum is cooling inside the larger uptrend rather than reversing it.

    What are the key support and resistance levels for Solana?

    The daily pivot sits at $103.30, with resistance R1 at $104.16 and support S1 at $102.07. The upper daily Bollinger Band is at $110.71, while the lower band sits at $90.77. On the hourly chart, the pivot is at $102.85 with S1 at $102.69.


    Disclaimer: This article is for informational purposes only and does not constitute financial advice, an investment recommendation, or a solicitation to buy or sell any financial instrument or cryptocurrency. The analysis provided is not indicative of future results. Investing in crypto assets and financial markets carries a high risk of capital loss. Always do your own research (DYOR) and consult a qualified financial advisor before making any decision.

    Article produced with the assistance of artificial intelligence and reviewed by the editorial team.


  • Bitcoin ETFs Still $1 Billion Short of Breaking Even in 2026

    Bitcoin ETFs Still $1 Billion Short of Breaking Even in 2026

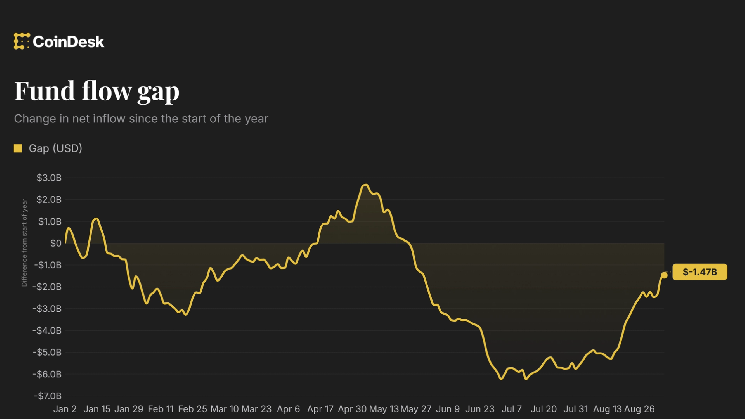
    Investor appetite for U.S.-listed spot bitcoin exchange-traded funds (ETFs) has surged in recent weeks, yet cumulative flows for 2024 remain deeply negative.

    Strong Summer Inflows Fail to Offset Spring Selloff

    Data from SoSoValue shows a dramatic turnaround in August, which attracted a massive $3.52 billion in fresh capital. Momentum carried into September, adding another $770.15 million through the early part of the month. While the winning streak signals that the worst of the mid-year market doldrums may be over, the broader arithmetic reveals a persistent deficit.

    Despite the recent rally, the funds are still down roughly $1 billion on a year-to-date basis. The primary driver of this lingering shortfall is the brutal two-month stretch in May and June, when institutional capital exited the funds at an alarming pace. June alone wiped out a staggering $4.51 billion, completely erasing the gains accumulated during March and April. Consequently, bulls still have significant ground to cover before ETF flows break even for the year.

    Macro Catalysts Loom as Critical Test

    Market participants are now focused on whether the positive momentum can withstand upcoming macroeconomic events. “The key test now is whether those inflows survive this week’s CPI and Treasury buyback,” analysts at crypto exchange Bitfinex said in a note to CoinDesk.

  • Curve’s Soft Liquidation Model Helps Borrowers Survive Market Drawdowns

    Curve’s Soft Liquidation Model Helps Borrowers Survive Market Drawdowns

    Curve Finance Soft Liquidation Data Reveals Borrowers Recover After Weeks in Liquidation

    New on-chain data from Curve Finance shows that hundreds of borrowers spent days or weeks in a partially liquidated state before their positions recovered, challenging the conventional assumption that liquidation equals immediate loss.

    How Soft Liquidation Works on Curve

    Unlike traditional hard liquidation — where a position is closed outright once collateral value drops below a threshold — Curve’s crvUSD lending markets use a soft liquidation mechanism. When a borrower’s collateral value falls into a specific price band, the protocol automatically converts a portion of that collateral into crvUSD stablecoins to reduce debt.

    The unusual finding is that these conversions happen while the loan remains open. A position can stay partly liquidated for extended periods and still recover if market prices reverse.

    Curve Finance Market Context

    Curve Finance operates as a major decentralized finance (DeFi) protocol specializing in stablecoin swaps and lending. According to DefiLlama data:

    • Total deposits: Approximately $1.35 billion
    • 30-day DEX volume: Roughly $3.4 billion
    • 30-day protocol fees: About $4.3 million
    • 30-day protocol revenue: Approximately $1.15 million
    • Active loans outstanding: Roughly $46 million

    Costs and Risks Remain for Borrowers

    Soft liquidation is not cost-free. The data indicates borrowers can still lose money through:

    • Trading fees during collateral conversion
    • Rebalancing costs
    • Accrued interest
    • Repeated price movements in both directions

    A position can still progress to hard liquidation if adverse price action continues. Even when prices recover, the borrower may not return to their original position due to accumulated costs and slippage.

    Key Takeaway for DeFi Lending

    Curve’s data establishes that on this system, crossing into liquidation does not mean a loan is dead. Hundreds of borrowers experienced extended periods in soft liquidation — days or weeks — before their positions recovered, demonstrating a materially different risk profile compared to traditional lending protocols.

  • Bitcoin Slips to $78,800 as BNB, DeFi Tokens Buck Selloff

    Bitcoin Slips to $78,800 as BNB, DeFi Tokens Buck Selloff

    Bitcoin Slips Below $79K as Macro Pressures Weigh; BNB Chain Tokens Lead Gainers

    Bitcoin (BTC) traded around $78,800 on Tuesday, down 0.42% since midnight UTC and 0.75% over the past 24 hours, according to CoinDesk data. The decline leaves the largest cryptocurrency 4.1% below the $82,320 resistance level it failed to breach last week. Ether (ETH) held relatively steady at $2,490, shedding just 0.02%, while Solana (SOL) dipped 0.06% to $103.77.

    Market Breadth Mixed as BNB Ecosystem Outperforms

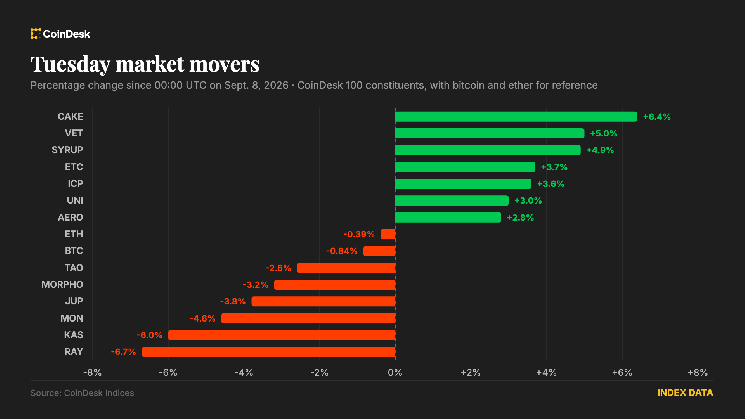
    Among the 100 assets in the CoinDesk 100 Index, 42 traded in negative territory. BNB Chain tokens emerged as notable exceptions, with BNB rising 2% to $754 since midnight. Related assets CAKE (PancakeSwap) and SYRUP also advanced, benefiting from a rotation into the BNB Chain ecosystem.

    The CoinDesk 5 Index slipped 0.47%, while the broader CoinDesk 20 Index edged up 0.2%. The CoinDesk Memecoin Index outperformed with a 0.41% gain.

    Derivatives Signal Caution Amid Macro Headwinds

    Taker Flow Remains Bearish

    The buy-sell ratio of takers—traders who remove liquidity by executing at market prices—in crypto futures stayed bearish. Major tokens came under pressure from rising oil prices, speculation around Federal Reserve rate increases, and elevated bond yields.

    Open Interest Flat, Volume Rises 5%

    Twenty-four-hour open interest (OI) remained largely unchanged at $141 billion, but trading volume climbed 5% to $149.85 billion. The divergence suggests increased churn rather than fresh positional conviction, indicating traders are rotating capital without adding significant new leverage.

    Aerodrome’s AERO Leads Top-100 Gainers with 17% Surge

    Decentralized exchange Aerodrome Finance’s native token AERO surged 17% in 24 hours, topping the leaderboard among top-100 assets by market value. The rally coincided with a sharp rise in futures open interest to a record 129 million tokens, a combination that points to a buildup of long positions supporting the spot-price move.

    Positive CVD Confirms Aggressive Buying

    AERO’s bullish momentum is reinforced by a positive 24-hour open-interest-adjusted cumulative volume delta (CVD), signaling that buyers are executing market orders more aggressively than passive limit orders.

    Injective’s INJ Mirrors Bullish Futures Structure

    INJ, up 10%, displays a similar bullish futures setup, lending credibility to its spot-price breakout above $6—a level that has acted as a supply zone since mid-June, capping previous advances.

    Bitcoin Futures OI Rises Despite Price Drop

    Overall Bitcoin open interest remains below the 700,000 BTC mark, reflecting still-low appetite for leverage. However, open interest in major USDT- and USD-margined futures increased to 265,000 BTC from 257,000 BTC even as spot prices fell to $78,700 from $80,000. The uptick suggests some traders may have initiated short positions anticipating further downside.

    Bears Dominate Most Majors; AVAX, XLM, DOGE Show Strength

    Negative 24-hour cumulative volume deltas across most major tokens indicate bears are leading price action. Exceptions include Avalanche (AVAX), Stellar (XLM), and Dogecoin (DOGE), which posted positive CVDs.

    Volatility Indexes Calm; Deribit Options Lean Bullish Short-Term

    Bitcoin and ether volatility gauges remain near recent lows, signaling no scramble to buy options or hedge positions. On Deribit, weekly-expiry calls dominated 24-hour volume rankings for both BTC and ETH, reflecting short-term bullish expectations despite the broader bearish taker flow.

    Token Movers: CAKE, VET, SYRUP Lead; RAY, KAS, TAO Lag

    • PancakeSwap (CAKE): +4.9% since midnight UTC, +7.5% over 24 hours to $2.29, extending a rally driven by BNB Chain rotation and the exchange’s tokenized-stocks initiative.
    • VeChain (VET): +8% on the day, +9% over 24 hours to $0.00735.
    • SYRUP: +8% to $0.23, placing three DeFi and enterprise-chain names atop the gainers board while major assets sold off.
    • Raydium (RAY): -5.5% since midnight to $1.10, tracking Solana’s decline.
    • Kaspa (KAS): -4.7% to $0.034, unwinding most of a weekend surge that made it a top 24-hour gainer on Monday.
    • Bittensor (TAO): -1.5% on the day, -3.7% over 24 hours to $256, after leading the market on Sunday.
    • Aerodrome (AERO): +18% over 24 hours to $0.64, though momentum cooled to a 2.8% gain since midnight.
    • Jupiter (JUP): -3.8% to $0.24, a second consecutive heavy session following Monday’s 9% drop with no clear catalyst identified.
  • Tom Lee Outlines $6,000 Ethereum Scenario, Cites 4 Catalysts

    Tom Lee Outlines $6,000 Ethereum Scenario, Cites 4 Catalysts

    Bitcoin dipped below the $80,000 threshold as markets brace for upcoming U.S. inflation data and rising expectations of a Federal Reserve interest rate hike. While altcoins displayed mixed performance, Ethereum consolidated around the $2,480 level.

    BitMine President Tom Lee Identifies Four Catalysts for Ethereum Upside

    In a recent interview, BitMine President Tom Lee outlined a bullish case for Ethereum, suggesting the asset could climb to approximately $6,000. Lee cited four key catalysts that he believes could drive significant appreciation in the $ETH price.

    First Catalyst: The CLARITY Act

    Lee highlighted the CLARITY Act as the most critical development, describing it as the most important legislation expected to define the regulatory framework for cryptocurrencies in the United States. He projects that the bill’s passage in September could substantially increase Wall Street’s engagement with the crypto market. According to Lee, removing regulatory uncertainty would clear the path for major financial institutions to expand their operations in the digital asset space.

    Second Catalyst: Sidelined Capital Re-entering the Market

    The second catalyst involves the unwinding of idle capital and short positions that have remained on the sidelines. Lee noted that some investors exited the crypto market following the previous downturn. A sustained price recovery could compel these participants to re-enter. He specifically pointed to investors anticipating a potential cycle bottom in October based on the traditional four-year crypto cycle; if the market maintains strength, these investors may be forced to cover positions earlier than planned, adding upward pressure on prices.

    Third Catalyst: Asian Capital Rotation

    Lee identified a rotation of Asian capital toward crypto assets as the third driver. He observed that investors in markets such as South Korea, who had previously concentrated on local equities, are refocusing on cryptocurrencies. Lee believes this inflow could boost demand across the market, with Ethereum standing as a primary beneficiary.

    Fourth Catalyst: Institutional FOMO into Quarter-End

    The final catalyst centers on corporate FOMO (fear of missing out). Lee argued that if Ethereum sustains its momentum through the end of the third quarter in September, underperforming fund managers may pivot into $ETH and other digital assets to salvage fourth-quarter returns. This institutional chasing of performance could trigger a notable price rally.

    The $6,000 Price Target Scenario

    Lee’s $6,000 price target is derived from a valuation model based on the ETH/BTC trading pair. He calculates that if the ratio rises from current levels to 0.04 while Bitcoin reaches $150,000, Ethereum would trade near $6,000. Lee characterized this scenario as conservative, noting that the ETH/BTC ratio peaked near 0.08 during the 2021 bull market. He maintains that the four catalysts outlined above provide fundamental support for such a move.

    Disclaimer: This content is for informational purposes only and does not constitute investment advice.

  • Bitcoin Price Stalls Below $78K as ADX Falls to 12

    Bitcoin Price Stalls Below $78K as ADX Falls to 12

    Bitcoin price traded just below $78,000 on Sept. 1 after retreating from the $81,000 area. Fading trend strength, Federal Reserve rate concerns and nearby liquidation clusters kept BTC locked in a narrow range.

    Bitcoin price consolidates after a 25% August rally

    According to data from crypto.news, Bitcoin ($BTC) was trading near $77,978 at press time, down about 0.8% on the day and roughly 1.9% over the past week. The cryptocurrency had pulled back from a local high near $81,300 while holding above the $77,700–$77,800 area.

    The decline followed an almost 25% advance in August, Bitcoin’s strongest monthly performance since November 2024. Profit-taking increased as buyers struggled to move the price through the $81,000–$82,000 resistance zone.

    Bitcoin’s daily chart shows the cryptocurrency holding most of its August breakout despite the recent pullback. The price remains well above Supertrend support at $72,310, while the indicator continues to show a bullish trend on the daily timeframe.

    Bitcoin price daily chart — Sep. 1 | Source: crypto.news

    However, Bitcoin has repeatedly failed to sustain moves above $80,000. These rejections have kept the price inside a short-term range, with neither buyers nor sellers showing enough strength to take control.

    The daily relative strength index stands at 68.02. Although the reading remains above the neutral 50 level, it has fallen below its moving average at 76.83, indicating that bullish momentum has cooled since the August surge.

    Fed concerns and ETF outflows limit Bitcoin demand

    The pullback coincided with a more cautious US macroeconomic backdrop. Federal Reserve Chair Kevin Warsh said at Jackson Hole that policymakers would have “work to do” if inflation failed to move toward the central bank’s 2% target at a sufficient pace.

    Warsh’s comments increased expectations that the Fed could consider another interest-rate increase. Higher rates can pressure Bitcoin by raising the return available on government debt and reducing investors’ willingness to hold risk assets that generate no cash flow.

    US spot Bitcoin exchange-traded funds recorded about $201.8 million in net outflows on Aug. 28, according to SoSoValue data. The withdrawal ended a nine-session inflow streak that had brought more than $3 billion into the funds.

    Institutional demand has not disappeared. Strategy disclosed that it purchased 4,603 $BTC for approximately $370 million between Aug. 24 and Aug. 30 at an average price of about $80,318.

    The US-listed company now holds 845,050 $BTC. However, its latest purchase has not been enough to push the market back above the company’s recent acquisition price.

    Bitcoin liquidity builds on both sides of the range

    CoinGlass’s one-week Bitcoin liquidation heatmap shows substantial leveraged positions building above and below the current price.

    Bitcoin liquidation heatmap | Source: CoinGlass

    The closest large upside clusters sit around $79,500, $80,500 and $81,500–$82,000. A move into those areas could force short sellers to close positions, adding buying pressure and potentially accelerating a breakout.

    The clearest downside liquidity is concentrated between approximately $76,500 and $77,000. Another pool extends toward $75,000, making the broader $75,000–$77,000 zone a possible target if Bitcoin loses its current floor.

    Pseudonymous analyst Eliz also identified $81,000–$82,000 and $75,000–$77,000 as the two main liquidity areas. The analyst said the market had not received a sufficiently strong liquidity influx to produce a reliable directional setup.

    The heatmap does not predict which cluster Bitcoin will reach first. Instead, it identifies areas where forced position closures could increase volatility once the price exits its present range.

    Weak ADX points to continued Bitcoin range trading

    Bitcoin’s 4-hour chart supports the consolidation outlook. The Bollinger Bands place their midpoint at $78,242, slightly above the current price.

    Bitcoin price 4-hour chart — Sep. 1 | Source: crypto.news

    The upper Bollinger Band stands at $79,062, while the lower band is near $77,422. Bitcoin is trading in the lower half of the channel but has not produced a confirmed close below its lower boundary.

    A break above $79,062 would put $80,000 back in focus, followed by the heavier liquidation zone around $81,000–$82,000. The daily chart places the next major resistance level near $82,842.

    A daily close above $82,842 would clear the recent high and could confirm that the August rally has resumed. Until then, repeated rejections below that level leave Bitcoin vulnerable to another range reversal.

    On the downside, a sustained break below $77,422 would expose the liquidity cluster near $76,500–$77,000. Losing the broader $75,000 level could open a deeper pullback toward daily Supertrend support at $72,310.

    The 4-hour average directional index has dropped to 12.26. Readings below 20 generally show that an asset lacks a strong trend, supporting the possibility of further sideways trading until Bitcoin breaks one of the range boundaries.

    For US investors, ETF flows and interest-rate expectations remain the main near-term catalysts. A return to sustained spot ETF inflows could help buyers challenge $82,000, while renewed outflows or stronger rate-hike expectations could increase pressure on the $75,000–$77,000 support area.