Category: Coins

Digital assets, cryptocurrencies, blockchain, and currency news.

  • South Korea Stock Scam Losses Reach $250 Million

    South Korea Stock Scam Losses Reach $250 Million

    South Korean Retail Investors Lose $250 Million to Stock-Tip Chatroom Fraud in First Half of 2026

    South Korean retail investors reported approximately $250 million in fraud losses connected to stock-tip chatrooms during the first six months of 2026, according to police data cited by Reuters on September 16. Authorities investigated 3,506 cases involving 336 billion won (roughly $246.57 million at the exchange rate used in the report). The monetary amount represents a 19.8% increase compared to the same period in 2025, while the number of investigated cases rose 4.1%.

    Market Volatility Fuels Scam Activity

    The surge in fraud coincided with extreme volatility in South Korea’s equity market. During the January-to-June period, the KOSPI became the world’s best-performing stock benchmark before plummeting as much as 44% from its June 19 peak. Lawyers specializing in financial fraud told Reuters that scam operators exploited both the excitement during the rally and the subsequent market uncertainty to persuade inexperienced investors to transfer money.

    Police emphasized that the 3,506 figure counts investigated cases, not individual victims. A single case can involve multiple victims, so the case count does not equal the number of people who lost money. The 336 billion won figure represents the total money involved in cases investigated during the six-month window.

    Investor Participation Remains Elevated

    Retail engagement across South Korean financial markets has stayed high. Research released in September showed a 95.7% year-over-year increase in online search interest tied to stocks and cryptocurrencies, though the study measured search activity rather than actual investment losses. Separately, leveraged trading losses among younger investors drew scrutiny during sharp market moves, but those figures concern leveraged positions and remain distinct from the police fraud data covering stock-tip chatrooms.

    Fake Chatrooms Exploit Trusted Names and Bogus Apps

    Police and lawyers described a recurring pattern: fraudsters post comments beneath videos from well-known brokerage analysts or financial influencers, then direct users toward private chatrooms. Some groups charge subscription fees for purported stock recommendations; others convince members to transfer money for investments.

    A Seoul police investigation announced in June illustrated how one overseas network allegedly operated. Yonhap reported that police arrested 10 people accused of taking roughly 9.9 billion won from 59 South Koreans between February 2024 and February 2026 through an operation based in Cambodia. Investigators said members posed as securities-company employees and steered users toward fake brokerage applications. According to Edaily, victims were shown fabricated balances and investment returns while operators promoted supposed AI-selected stocks and claims of returns reaching 600%.

    Police said links placed beneath videos from genuine financial personalities were used to move potential victims into private Naver Band groups. Inside the groups, fake investors reportedly posted fabricated success stories designed to make the schemes appear credible.

    Victim Warns Others: “Doubt Every Tip You Are Given.”

    One investor interviewed by Reuters said he entered a Naver group after seeing a TikTok video he believed had been posted by an executive at a securities company. The 47-year-old logistics worker, identified by the pseudonym Jay, said he eventually transferred 60 million won after being told an investment opportunity could produce a 600% return.

    After the group stopped communicating and disappeared in April, Jay filed a criminal complaint with police and a civil claim against the holder of the bank account that received his money. Police declined to discuss his individual case. His warning to new investors was direct: “doubt every tip you are given.”

    Regulators Expand Warnings and Platform Checks

    South Korea’s Financial Services Commission (FSC) announced on September 2 that financial authorities had launched a nationwide campaign focused on safer financial activity and investment fraud prevention. The FSC said illegal operators had impersonated investment professionals, used AI-generated material, distributed fake news, and promoted high-return or principal-protection claims before collecting investors’ money and disappearing.

    The campaign is scheduled to run through the end of 2026 across social media, government websites, mobile applications, and public display systems. The regulator said government agencies, banks, and financial-sector associations would distribute warning material through their own communication channels.

    Earlier in 2026, the Financial Supervisory Service (FSS) issued consumer warnings concerning illegal stock-tip rooms that impersonated securities-company employees and distributed links leading to private chats or fake investment applications. A January alert urged investors to be cautious when unknown operators tried to move conversations into closed groups or requested installation of unfamiliar trading software.

    On March 23, the FSC announced an intensive reporting and investigation period targeting financial influencers suspected of front-running recommended stocks, spreading false market information, or circulating fabricated corporate developments. The regulator said suspected violations could be referred to investigators when available evidence supported enforcement action.

    Police Collaborate With Online Platforms on Detection

    Yonhap reported in June that the National Police Agency was sharing newly identified scam tactics with companies including Naver and Kakao so the platforms could strengthen their detection systems. Police said losses associated with investment-tip rooms stood at 41.3 billion won in May, down 26.1% from the average monthly level recorded during the first quarter.

    Cambodia-Linked Case Awaits Further Court Action

    The Cambodia investigation remains one of the clearest criminal cases connected with tactics found in stock-tip chatrooms. Kyunghyang Shinmun reported that suspects allegedly divided tasks among callers, people posing as brokerage workers, translators, and fake investors who posted success stories inside the groups. Police secured approximately 273 million won in suspected criminal proceeds before indictment, according to MBC reporting. Investigators said efforts were continuing to trace higher-ranking members of the organization.

    The Financial Supervisory Service told Reuters that it does not maintain a separate dataset covering illegal stock-tip chatroom cases because criminal investigations fall under law-enforcement agencies. The regulator did not answer the news agency’s question on whether new investor-protection rules were being prepared.

    Naver said it takes action against fraudulent chatrooms after receiving reports and has been strengthening monitoring. Jeonbuk Bank, which held the account involved in Jay’s complaint, said it was aware of ongoing fraud cases and would continue improving fraud-detection measures. Police said the Cambodia-based case involving 10 suspects had been referred to prosecutors and was awaiting a court date.
  • Chainflip Resets TRON USDT Provider Balances to Zero After $736,000 Exploit

    Chainflip Resets TRON USDT Provider Balances to Zero After $736,000 Exploit

    Chainflip will set affected liquidity providers’ active TRON $USDT balances to zero under a restart plan responding to the 736,442.17 $USDT exploit it disclosed on Sept. 12.

    The cross-chain swap protocol will first record each provider’s pre-migration balance separately on-chain, preserving the amount Chainflip says it owes even though the active account will read zero. Repayment remains pending.

    By Sept. 16, Chainflip said swaps and quoting had resumed across the rest of the network while TRON remained excluded. The service restart leaves providers on the affected route waiting for both the accounting migration and a recovery process.

    Chainflip said the attacker removed the $USDT from its TRON vault between 01:44 and 03:10 UTC on Sept. 12 by causing six liquidity-provider withdrawals to be paid twice.

    The attack exploited how the protocol read instructions attached to TRON transfers. Chainflip said the attacker submitted a transaction its validators had already signed and added a malformed memo. Software monitoring the transfer interpreted the memo as a failed swap and issued a refund on top of the ordinary withdrawal.

    The protocol said the TRON vault now holds far less $USDT than providers are owed. The restart plan therefore separates the live account balance from the amount tracked for recovery.

    How Chainflip Will Account for the Shortfall

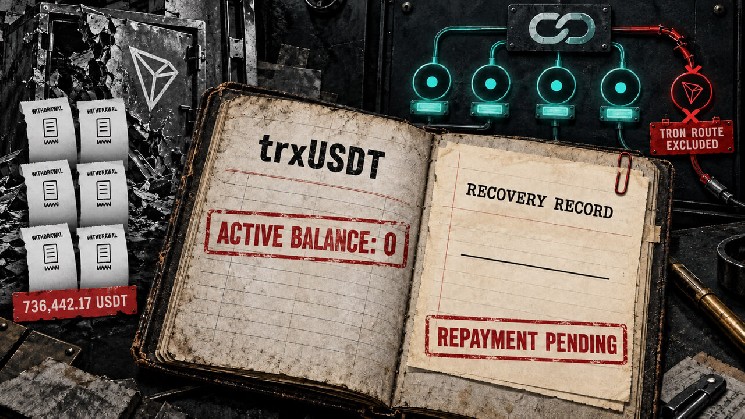
    An infographic outlines Chainflip’s TRON $USDT recovery after the exploit, including service separation, position unwinding, balance migration, and pending LP reimbursement.

    Chainflip’s migration plan calls for closing its open TRON/$USDT orders and strategies and unwinding related loans and lending positions. The protocol and its software release use the label “trxUSDT” for $USDT on TRON.

    Each provider’s pre-migration trxUSDT amount will then be written to a separate on-chain balance before the active account balance is reset. Chainflip said this separate record keeps the amount owed available for future payouts.

    The recorded amount is distinct from a completed reimbursement, and the provider’s live trxUSDT account will display zero after the migration.

    Chainflip has pledged to make affected providers whole. Its public updates do not identify a funding source or payout schedule, document completed payments, or state a definitively recovered amount.

    The protocol said it patched the vulnerability by limiting which TRON transfers can carry swap instructions in a memo. The new logic accepts memos attached to a plain TRX transfer or a direct TRC-20 token transfer. It excludes transfers wrapped inside another contract call, blocking the route used to trigger the extra refund.

    Chainflip said all other funds were unaffected. The disclosed shortfall, position unwind, and balance reset apply specifically to trxUSDT liquidity providers.

  • Operation Meteor Invites Community Input on Neo’s Five-Year Market Strategy

    Operation Meteor Invites Community Input on Neo’s Five-Year Market Strategy

    Neo Council Launches Operation Meteor to Define 2026-2031 Strategic Market Focus

    The Neo Council has officially launched Operation Meteor, an open call for community input into a structured process designed to define Neo’s strategic market focus for the 2026-2031 period. Announced by COZ on September 15, the initiative evaluates potential market opportunities against 16 formal criteria scored by Council members, with two participation windows open through September 25.

    Decision Framework, Not a Single Decision

    Operation Meteor serves as the public-facing phase of the broader Meteor initiative, which NNT first covered in August as a structured attempt to establish a unified product strategy. The process aims to produce a ranked shortlist of market opportunities rather than a single winner-take-all outcome, through transparent, evidence-led scoring by the 21-seat Neo Council.

    The COZ blog post describes Meteor as “Neo’s open, structured initiative to evaluate global market opportunities, assign strategic priority, and establish unified focus for Neo’s growth over the next 5 years.”

    The framework centers on 16 evaluation categories spanning five broad themes:

    • Market viability: timing, staying power, customer pain
    • Competitive positioning: Neo’s distinctive strengths, differentiation, defensibility
    • Commercial sustainability: revenue path, ecosystem activity, token demand
    • Execution feasibility: speed to proof, MVP realism, technical capacity, legal risk
    • Strategic value: learning velocity, future options, narrative clarity, market attention

    Council members will assign relative weights to these categories, determining which dimensions carry the most strategic importance. A seven-person research team will then package five to ten market opportunity dossiers, which the Council scores against the weighted criteria using a Delphi-style consensus process.

    Two Lanes for Community Participation

    The initiative offers two structured participation windows for community members:

    Research Lane

    Ecosystem participants can submit candidate market opportunities to the research team through mid-October. Submissions follow a structured format covering the market or problem name, Neo’s strategic fit, and the customer pain point being addressed. Channels for submission include GitHub Discussions, the Neo Community Discord, r/NEO, and X under the #NeoMeteor hashtag.

    Governance Lane

    Running from September 14 to 25, this window allows Council members to vote on category weighting. Community members are encouraged to lobby Council members on how to prioritize the evaluation criteria—for example, whether to weight market attention and hype more heavily than long-term defensibility, or fast MVP speed over deep infrastructure leverage.

    Research Team Composition

    The Neo Council nominated a seven-person research team to compile the market opportunity dossiers:

    • Dylan Grabowski (NNT)
    • Malcolm Lerider (Ecosystem)
    • John Wang (Neo Global Development)
    • Jimmy Liao (R3E Network)
    • Vitor Coelho (Neo Research)
    • Ivan Poon (Switcheo Labs)
    • Lunar Strategy

    Malcolm Lerider has already released Phase 0 research findings on September 4, pitching Neo as “the verifiable>July NeoPod AMA that Neo needs to “stop boiling the ocean” and “focus on a market segment and build a purpose-built product,” noting the network has operated without a targeted go-to-market strategy since 2017.

    The initiative runs alongside the ongoing founder governance dispute between Da Hongfei and Erik Zhang, though Meteor has secured backing from both Zhang and Neo Global Development, along with core developers and a number of Council members.

    The full Operation Meteor community call to action can be found at: https://coz.io/blog/inside-operation-meteor-community-call-to-action/

  • XRP Slides Below $1.30 Support as Traders Turn Bearish Short-Term

    XRP Slides Below $1.30 Support as Traders Turn Bearish Short-Term

    Ripple’s XRP token suffered a sharp 9.82% single-day decline on Tuesday, September 15, dropping from $1.42 to $1.28. The sell-off caught many market participants off guard, as the altcoin had spent much of late August repeatedly testing the $1.45 local resistance zone.

    Derivatives Data Signals Waning Speculative Interest

    According to data from CryptoQuant, XRP’s Open Interest (OI) has contracted significantly over the past month. OI fell from $1.128 billion in late August to $871 million at the time of writing, representing a 23% decline equivalent to roughly $257 million.

    This reduction in open derivatives contracts coincided with XRP’s rejection from the $1.50 higher-timeframe supply zone. The data suggests that derivatives positions were either voluntarily closed or forcibly liquidated in large numbers. The combination of decreasing speculative interest and a price slide below the $1.30 support level paints a cautious picture for the near term.

    Institutional Demand vs. Market Headwinds

    On-chain metrics reveal a divergence between institutional appetite and price action. Throughout September, XRP spot ETF flows have remained positive, with growing fund balances acquiring more tokens and reducing available supply.

    Despite this institutional demand, price action has lagged. AMBCrypto reported earlier this month that the disconnect was partly attributed to declining Bitcoin (BTC) prices, as the broader market priced in increasing odds of a rate hike.

    Key Technical Levels Under Pressure

    The $1.30 level had been identified as a critical short-term support zone. However, aggressive selling in the futures markets—accompanied by the declining Open Interest—overwhelmed buyers, causing XRP to lose this foothold in recent sessions.

    Daily Timeframe Structure and Fibonacci Analysis

    Analyzing the XRP/USDT pair on TradingView, the daily swing structure remains technically bullish. An earlier downtrend established a lower high at $1.184 (dotted green line), which was subsequently breached by the August rally, flipping the market structure to the upside.

    Price action has since tested the 61.8% Fibonacci retracement level. At the time of writing, the former $1.30 support is being retested as resistance. Without a renewed influx of strong demand across both spot and futures markets, XRP could continue its retracement toward the $1.14 level.

    Exchange Supply Ratio Holds Steady

    The exchange supply ratio—which measures the proportion of XRP’s circulating supply held on centralized exchange wallets—declined steadily from April through July. Since then, the metric has stabilized around 2.6%.

    If the ratio resumes its previous downtrend, analysts typically interpret it as a sign of accumulation and a shift of coins into cold storage. Conversely, a further price decline accompanied by a rising supply ratio would undermine the current bullish bias, which has already been damaged by the rejection at the key $1.50 supply zone.

    Summary

    • XRP failed to breach the $1.50 supply zone and dropped below the $1.30 support level.
    • Derivatives data shows increased sell pressure and declining speculative interest, signaling short-term bearish sentiment.
    • Spot ETF inflows remain positive, highlighting a divergence between institutional accumulation and current price weakness.
    • Technical structure suggests a potential retracement toward $1.14 if buying pressure does not return.
  • Solana Price Today: SOL Holds $100 as Bullish Trend Battles Fading Momentum

    Solana Price Today: SOL Holds $100 as Bullish Trend Battles Fading Momentum

    Solana Price Analysis: $SOL Holds $100 as Momentum Fades Despite Bullish Structure

    As of September 17, 2026, Solana ($SOL) trades near $100.08, a level that has become a genuine battleground between an intact daily uptrend and momentum that is clearly losing steam. The broader cryptocurrency market offers little directional clarity, with total crypto market capitalization slipping 1.36% and Bitcoin dominance climbing to 58.3%, signaling a defensive tilt across risk assets.

    Key Technical Takeaways

    • Price: $100.08, holding above EMA20 (99.54), EMA50 (93.08), and EMA200 (89.39)
    • Daily MACD histogram: -1.3, signaling fading momentum despite bullish structure
    • On-chain DEX fees surging: Raydium up 206.79%, Orca up 176.31% over 30 days
    • Bitcoin dominance: 58.3%, indicating risk-off sentiment
    • Daily ATR14: 4.09, suggesting ~4% daily swings remain the norm

    Daily Chart: Bullish Structure Meets Fading Momentum

    The daily regime remains tagged bullish, and the structure supports that assessment on the surface. Price at 100.08 trades above the EMA20 at 99.54, the EMA50 at 93.08, and the EMA200 at 89.39 — the textbook definition of an intact uptrend. The RSI14 at 53.15 sits neutral, neither overbought nor oversold, meaning no exhaustion signal is forcing a reversal, but also no strong tailwind is pushing price higher.

    The real tension appears in the MACD: the line sits at 2.11 against a signal of 3.41, leaving the histogram at -1.3. This is a daily momentum reading cooling off even while the trend structure above it stays positive — a classic setup where price remains technically in an uptrend but the fuel behind it is fading fast.

    Bollinger Bands add another layer. The mid-band sits at 101.78, with the upper band at 106.48 and the lower band at 97.07. Price at 100.08 sits just under the midline, meaning $SOL is not stretched in either direction. There is room to move toward the upper band if buyers return, but also space to slide toward 97 without breaking any structural rule.

    Moreover, ATR14 at 4.09 reminds traders this is not a quiet market. Daily ranges of roughly 4% of price mean swings in either direction should be expected, not treated as anomalies.

    Pivot Levels and Short-Term Timeframes

    The daily pivot sits at 99.64, with R1 at 100.8 and S1 at 98.91. Price currently hovers just above the pivot, placing the immediate battle between reclaiming R1 and defending the pivot itself. A drop below 98.91 would cause bulls to lose short-term footing quickly.

    The 1-hour chart complicates rather than confirms the picture. The regime here is neutral, not bullish, and RSI14 at 63.66 shows more short-term enthusiasm than the daily chart. The 1H MACD is actually positive, with the line at 0.51 against a signal of 0.3 and the histogram at +0.21 — a mild bullish signal in isolation.

    The catch: the 1H EMA200 sits at 100.52, above the current price of 100.05. This means $SOL is still trading under a key intraday resistance level even as it holds above its own 1H EMA20 at 98.95 and EMA50 at 98.94. Short-term momentum is trying to build while a bigger intraday ceiling sits just overhead.

    The 15-minute chart serves purely for execution context. It shows a bullish regime with RSI14 at 60.6, but MACD is essentially flat: line at 0.27, signal at 0.28, histogram at -0.01. This signals neither breakout nor breakdown, just indecision at the smallest timeframe while the bigger picture sorts itself out.

    Broader Market Backdrop: Risk-Off Meets On-Chain Growth

    Sentiment is not offering much directional push. The Fear & Greed Index reads 50 — squarely Neutral — aligning with a market that is technically undecided rather than gripped by euphoria or panic. Solana’s share of total crypto market cap stands at roughly 2.23%, a reminder that $SOL moves partly on its own fundamentals and partly on wider capital flows.

    Notable, however, is the divergence between that risk-off tilt and activity on Solana’s own DeFi rails. According to DefiLlama data, activity across Solana-based DEXs has accelerated hard over the past month:

    • Raydium AMM fees: up 206.79% over 30 days
    • Orca DEX fees: up 176.31% over 30 days
    • HumidiFi: up 68.28%
    • BisonFi: up 69.65%
    • PumpSwap: up 18.38%

    This is genuine on-chain usage growth happening underneath a price chart chopping around the $100 level — the kind of fundamental signal that does not always show up immediately in price but tends to matter over longer horizons.

    Bullish Scenario: What Needs to Happen

    For bulls to take control, $SOL needs to hold the daily pivot at 99.64 and push through R1 at 100.8 with enough force to flip the daily MACD histogram back toward positive territory. A decisive reclaim of the 1H EMA200 at 100.52 would go a long way toward confirming that the short-term RSI strength at 63.66 is translating into real follow-through rather than noise.

    If that happens, the next real magnet is the daily Bollinger mid-band at 101.78, with the upper band at 106.48 as the stretch target if momentum genuinely re-accelerates. This scenario gets invalidated the moment price loses the daily EMA20 at 99.54 and closes back below the pivot — at that point the bullish case on paper stops mattering much.

    Bearish Scenario: Momentum Divergence Risks

    The bearish case leans heavily on the daily MACD histogram sitting at -1.3 despite the bullish regime tag. Momentum divergences like this have a habit of resolving through price catching down to reality. If $SOL fails to reclaim the 1H EMA200 at 100.52 and rejects near the daily pivot, a slide back toward S1 at 98.91 becomes the more likely path.

    The daily EMA50 at 93.08 would serve as deeper support if that level fails to hold. This scenario would be invalidated by a strong daily close back above the Bollinger mid-band at 101.78 alongside a MACD line crossing back above its signal — a combination suggesting the momentum fade was temporary rather than the start of something bigger.

    Where This Leaves Traders

    Right now the Solana price is a study in conflicting signals rather than a clean directional call. The daily trend structure still favors bulls on paper, but the momentum underneath it is fading. The 1H chart shows price stuck under its own EMA200 even as short-term RSI runs hot. Layer on a broader market rotating toward Bitcoin and you get a setup that rewards patience over conviction.

    The ATR readings across timeframes confirm this is not a market going to sit still. Daily ranges near 4% of price mean whichever side wins this tug-of-war is likely to move fast once it does. Treating this as a wait-and-confirm environment rather than a moment to force a directional bet seems the more disciplined approach, keeping position sizing aligned with the volatility the ATR data is already flagging.

    Frequently Asked Questions

    What is Solana’s price right now?

    As of September 17, 2026, $SOL is trading at $100.08 on the daily chart, hovering just above the daily pivot of 99.64 but below the 1H EMA200 resistance at 100.52.

    Is Solana’s trend bullish or bearish?

    The daily structure remains technically bullish, with price above all three key EMAs. However, the daily MACD histogram at -1.3 signals fading momentum, creating a conflict between trend structure and momentum readings.

    What are the key support and resistance levels for $SOL?

    Immediate support sits at S1 (98.91) and the daily EMA20 (99.54). Deeper support lies at the daily EMA50 (93.08). Resistance levels include the 1H EMA200 (100.52), R1 (100.8), and the Bollinger mid-band (101.78).

    What does the MACD divergence mean for Solana?

    A bearish MACD divergence under a bullish trend structure often resolves with price correcting downward toward momentum. If $SOL fails to reclaim the 1H EMA200, a slide toward S1 at 98.91 or lower becomes more probable.


    Disclaimer: This article is for informational purposes only and does not constitute financial advice, an investment recommendation, or a solicitation to buy or sell any financial instrument or cryptocurrency. The analysis provided is not indicative of future results. Investing in crypto assets and financial markets carries a high risk of capital loss. Always do your own research (DYOR) and consult a qualified financial advisor before making any decision.

    Article produced with the assistance of artificial intelligence and reviewed by the editorial team.

  • Solana Tokenized Stock TVL Surges to $87.4M Amid DeFi Boom

    Solana Tokenized Stock TVL Surges to $87.4M Amid DeFi Boom

    Solana DeFi Growth Accelerates as Tokenized Stock TVL Hits $87.4 Million

    Solana is making significant strides in the decentralized finance sector, with its total value locked (TVL) in tokenized stocks reaching $87.4 million, according to data highlighted by CryptoTwitter commentator @tokenterminal. This marks a substantial increase from previous levels and signals burgeoning interest in tokenized assets within Solana’s ecosystem.

    Solana Captures 35.2% of Tokenized Stock Market

    The surge reflects a broader DeFi trend where innovative financial products are attracting fresh capital. As of the latest data, Solana accounts for approximately 35.2% of the total TVL in tokenized stocks, underscoring its critical role in this segment.

    This growth is particularly noteworthy because the total value locked across all tokenized stocks in DeFi has skyrocketed by over 1,960% in the past year, reaching $247.8 million. The dominance of chains like Solana, Robinhood, and BNB Chain—which collectively hold 89.5% of this market—highlights the increasingly competitive landscape in decentralized finance.

    Why Solana’s Infrastructure Matters for Tokenized Assets

    Solana is a blockchain platform designed for decentralized applications, facilitating fast and low-cost transactions. Its architecture within the DeFi ecosystem is significant, as its infrastructure supports a variety of tokenized assets, positioning it as a key player in the evolving financial landscape. The ongoing growth in Solana’s stablecoin supply further cements its position as a critical player in emerging markets.

    Key Levels for Traders to Monitor

    Market participants should keep a close eye on Solana’s developments in the DeFi space, especially as it continues to attract significant capital into tokenized stocks. With TVL rising, analysts may look for potential resistance levels around $90 million as a significant benchmark.

    The growing interest in Solana’s ecosystem may also lead to increased volatility, making it essential for traders to monitor not only price movements but also broader market sentiment.

    Data referenced in this article is based on current market trends and on-chain metrics.

  • Kaiko Data Reveals Bitcoin Volatility

    Kaiko Data Reveals Bitcoin Volatility

    Bitcoin Volatility Surges Amid Federal Reserve Policy Uncertainty

    Bitcoin’s recent volatility has surged, reflecting renewed uncertainty surrounding Federal Reserve policy decisions. According to data from KaikoData, the 30-day rolling volatility for Bitcoin spiked following the August Jackson Hole speech, eased temporarily, and then climbed again into September. This pattern suggests traders should closely monitor future Fed communications for clearer guidance on interest rates, which directly impacts market sentiment across digital asset markets.

    Mixed Signals Across Crypto Markets

    The broader cryptocurrency market indicates mixed signals, with various assets experiencing different momentum shifts. As Bitcoin grapples with climbing volatility, reduced forward guidance from the Federal Reserve adds an element of unpredictability. This uncertainty is particularly relevant for traders engaged in the derivatives market, where open interest and funding rates serve as crucial indicators of market sentiment. The potential for liquidation cascades also rises as traders navigate this volatile landscape.

    Key Data Points

    • Bitcoin’s 30-day rolling volatility spiked after the August Jackson Hole speech
    • Volatility eased before climbing again into September
    • Reduced Fed forward guidance leaves markets uncertain about interest rate trajectory
    • Traders are advised to watch for clearer Fed signals moving forward

    Market Conditions and Trading Activity

    Bitcoin’s price remains relatively unchanged as volatility increases, with no significant trading volume reported in the past 24 hours. The current market environment showcases hesitancy among traders as they respond to the Federal Reserve’s policy indications. This volatility trend may lead to increased caution in the market as traders reassess their positions amid the shifting landscape.

    As the leading cryptocurrency, Bitcoin’s price volatility and market influence make it particularly sensitive to macroeconomic policy shifts. The Federal Reserve’s policy decisions significantly affect financial markets, including cryptocurrencies, given their impact on interest rates and overall economic conditions.

    Levels to Watch

    Traders are monitoring potential shifts in Bitcoin’s volatility based on upcoming Fed announcements. Key levels to watch will be the reactions to new guidance, which could either stabilize or exacerbate current volatility trends. Risks remain high, especially if traders encounter sudden market movements that could lead to significant liquidations.

    This article is for informational purposes only and does not constitute financial advice.

  • NYDFS’s Asrow Addresses Stablecoin Regulation at Stablecon

    NYDFS’s Asrow Addresses Stablecoin Regulation at Stablecon

    At the recent Stablecon conference, New York Department of Financial Services (NYDFS) Acting Superintendent Asrow emphasized the critical role of inter-agency collaboration in shaping effective stablecoin regulation. The remarks, delivered on September 16, 2026, reinforce New York’s position as a pioneer in digital asset oversight, building on more than a decade of experience regulating virtual currencies.

    Regulatory Leadership and Collaborative Approach

    The stablecoin sector continues to expand as digital assets transform traditional financial infrastructure. Acting Superintendent Asrow’s address at Stablecon signals NYDFS’s commitment to evolving its regulatory framework through coordination with fellow regulators. This strategy aims to create a resilient environment that encourages responsible innovation while maintaining rigorous consumer protections—a proactive posture that contrasts with the more tentative regulatory timelines observed in other jurisdictions.

    Key Takeaways

    • NYDFS is spearheading stablecoin regulatory development.
    • Acting Superintendent Asrow presented at Stablecon on September 16, 2026.
    • The discussion centered on the necessity of collaboration among regulatory bodies.
    • New York leverages over ten years of virtual currency supervisory experience.
    • The framework prioritizes user safety alongside innovation enablement.

    Market Context and Implications

    The broader cryptocurrency market is currently navigating mixed momentum across various digital assets. In this environment, regulatory clarity from influential bodies like NYDFS plays a pivotal role in shaping trader sentiment and industry dynamics. As these frameworks mature, they are expected to bolster market confidence and accelerate stablecoin adoption across diverse platforms.

    NYDFS regulates financial services and products in New York, including virtual currencies. Its stablecoin framework is widely regarded as a benchmark for other jurisdictions, reflecting the state’s dual mandate to advance the digital asset ecosystem and safeguard consumers.

    Forward-Looking Considerations

    Market participants should closely monitor how NYDFS’s evolving regulatory model influences approaches in other regions. As other regulators observe New York’s proactive measures, they may adopt comparable frameworks, potentially driving increased interest and investment in stablecoins and reshaping the market landscape in the months ahead.

  • Bitcoin Faces 2022 Parallels as Federal Reserve Resumes Rate Hikes

    Bitcoin Faces 2022 Parallels as Federal Reserve Resumes Rate Hikes

    Bitcoin Bear Market Nears One-Year Mark as Fed Rate Hikes and Energy Shock Cloud Outlook

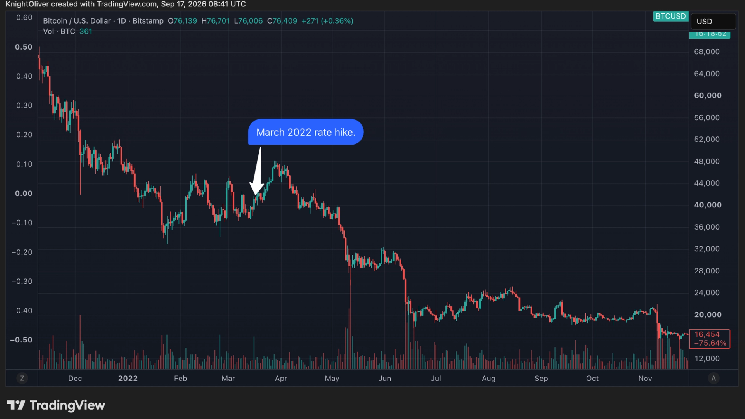
    Bitcoin’s prolonged downturn is approaching the one-year milestone, raising questions about whether a new Federal Reserve rate-hiking cycle could extend the crypto winter. The market’s recent behavior echoes the aftermath of the Fed’s initial March 2022 hike, when bitcoin rallied roughly 18% over 12 days before plummeting around 50%. That pattern suggests any near-term relief rally may give way to further losses, though a single comparable cycle offers limited predictive evidence.

    Inflation Progress Meets Fresh Energy Shock

    The Federal Reserve’s decision to raise rates on Wednesday stemmed from persistent inflation pressures. Annual headline inflation has remained above the 2% target for over five years. However, core inflation — which excludes volatile food and energy components — has eased to 2.4%, its lowest level in five years, signaling meaningful progress.

    That progress now faces a significant headwind. Escalating geopolitical tensions in the Middle East have propelled both West Texas Intermediate and Brent crude oil prices well above $100 per barrel. The surge threatens to reignite inflationary pressures and squeeze economic growth simultaneously.

    Rising Yields Amplify Pressure on Risk Assets

    Global bond yields have climbed in response, with the benchmark U.S. 10-year Treasury yield reaching 5%. The move tightens financial conditions further and adds downward pressure on risk assets, including cryptocurrencies. Bitcoin’s 2022 decline coincided with broad-based losses across equities, bonds, and metals, alongside internal turmoil within the crypto industry — a correlation that underscores its sensitivity to macroeconomic liquidity cycles.

    Key Question for Crypto Markets

    With the bear market nearing its first anniversary, market participants are weighing whether the current tightening cycle — compounded by an energy-driven inflation resurgence — will prolong the downturn or if the asset class has already priced in the worst of the macroeconomic storm.

  • Bitwise CIO: Bitcoin Rally Could Continue Unless Debt Concerns Ease

    Bitwise CIO: Bitcoin Rally Could Continue Unless Debt Concerns Ease

    Bitcoin Price Rally Driven by US Debt Concerns, Not Crypto Regulation, Says Bitwise CIO Matt Hougan

    Bitcoin’s recent price surge appears to be fueled primarily by mounting concerns over the United States fiscal outlook rather than progress on cryptocurrency-specific legislation, according to analysis from Bitwise Chief Investment Officer Matt Hougan.

    Inverse Correlation Between Regulatory Odds and Bitcoin Price

    Hougan shared a chart on social media platform X demonstrating a striking divergence between regulatory expectations and market performance. Between July 1 and September 15, the probability of the US Clarity Act passing this year plummeted from 39% to 18% on prediction market Polymarket. During that same period, Bitcoin’s price increased by approximately 38%.

    The data suggests that market expectations regarding cryptocurrency regulatory developments are not aligning with Bitcoin’s price movement. Hougan argues that concerns about the US debt outlook have become a significant factor in current market pricing.

    Clarity Act Stalls in Senate

    The Clarity Act represents one of several legislative proposals aimed at establishing a clearer regulatory framework for crypto assets in the United States. Its progress through Congress has been hindered by procedural hurdles.

    A previous cloture vote in the US Senate failed to secure the necessary support to advance the bill to the next legislative stage. The cloture procedure is designed to end debate on a bill, paving the way for consideration by the full Senate.

    Macro Factors Trump Sector-Specific News

    Hougan’s assessment indicates that Bitcoin’s recent performance is linked not only to developments within the crypto sector but also to broader macroeconomic factors, particularly the US fiscal outlook and investor debt concerns. However, the future trajectory of Bitcoin’s price depends on numerous market conditions beyond any single narrative.

    This article is for informational purposes only and does not constitute investment advice.