Author: Evan Mercer

  • XRP Faces 1522% Liquidation Imbalance as Market Selloff Catches Bulls Off Guard

    XRP Faces 1522% Liquidation Imbalance as Market Selloff Catches Bulls Off Guard

    Key Highlights

    • XRP plunged 8.18% in 24 hours after a failed breakout above $1.65, triggering a 1,522% long-liquidation imbalance totaling $29.54 million.
    • The selloff coincided with broader crypto market declines driven by surging Treasury yields and renewed Federal Reserve rate-hike expectations.
    • On-chain data from Santiment shows XRP’s 365-day MVRV at -11.75%, signaling long-term holders remain deeply underwater and historically suggesting reduced downside risk.

    XRP Selloff Wipes Out Leveraged Longs After Failed $1.65 Breakout

    XRP suffered a sharp reversal on Thursday after a week-long rally collapsed under heavy profit-taking and macroeconomic pressure. The token, which had climbed from a September 16 low of $1.24 to a local high of $1.65 on September 23—marking six green days out of eight and forming its first daily-chart golden cross of 2024—surrendered those gains in a matter of hours. At the time of writing, XRP traded near $1.45, down 8.18% over the previous 24 hours. The sudden drop caught leveraged bulls off guard, triggering $29.54 million in long liquidations against just $1.94 million in shorts, a staggering 1,522% imbalance that underscored the one-sided positioning ahead of the reversal.

    Macro Headwinds Amplify Crypto-Wide Profit Taking

    The XRP decline did not occur in isolation. Across the digital asset sector, a broad-based selloff liquidated approximately $610 million in positions over the past day as traders reduced risk exposure. The catalyst stemmed from traditional markets: U.S. Treasury yields climbed to multi-decade highs after fresh economic data strengthened the case for additional Federal Reserve tightening. Futures markets now price in a greater than 75% probability that the Federal Open Market Committee will raise rates again at its October meeting. Reinforcing that view, New York Federal Reserve President John Williams stated in London on Thursday that it would be “reasonable” to expect another interest rate hike by year-end. The hawkish rhetoric pressured risk assets globally, with crypto markets among the most sensitive to shifting rate expectations.

    On-Chain MVRV Metric Suggests Limited Downside for Long-Term Holders

    Despite the near-term technical damage, on-chain analytics platform Santiment highlights a potentially constructive longer-term setup. XRP’s 365-day Market Value to Realized Value (MVRV) ratio sits at approximately -11.75%, indicating that the average holder who acquired the asset over the past year is sitting on an unrealized loss. Historically, deeply negative MVRV readings have coincided with periods of reduced selling pressure, since fewer participants are in profit and motivated to exit. Santiment notes that “buying during that pain has historically offered better long-term setups,” implying that the current discount could represent accumulation territory if demand fundamentals improve.

    Why This Matters

    The episode illustrates how crypto markets remain tightly coupled to Federal Reserve policy expectations, with even technically bullish structures—such as XRP’s golden cross—vulnerable to abrupt macro-driven reversals. The extreme long-liquidation imbalance reveals excessive leverage on the long side, a condition that often precedes short-term volatility but can also flush out weak hands, resetting the derivatives market for a cleaner trend. Meanwhile, the deeply negative long-term MVRV provides a rare on-chain signal that long-term holders are not sitting on large paper profits, reducing the likelihood of sustained distribution from that cohort. Market participants will now watch whether XRP can reclaim the $1.55-$1.60 zone as support and whether upcoming Fed communications validate or dispel the October rate-hike narrative.

    Frequently Asked Questions

    What caused XRP’s 8% drop in 24 hours?
    A failed breakout above $1.65 triggered cascading long liquidations totaling $29.54 million, amplified by a broad crypto selloff driven by surging Treasury yields and renewed Fed rate-hike expectations.
    What does the 1,522% liquidation imbalance indicate?
    It shows that leveraged traders were overwhelmingly positioned long ahead of the reversal, with $29.54 million in longs liquidated versus only $1.94 million in shorts, reflecting one-sided bullish positioning that exacerbated the downside move.
    Is XRP oversold based on on-chain data?
    Santiment’s 365-day MVRV of -11.75% suggests long-term holders are deeply underwater, a condition historically associated with reduced selling pressure and improved long-term risk/reward, though it does not guarantee an immediate rebound.
  • XRP Pulls Back to $1.50 as 50-Day SMA, RSI, Volume Profile Levels Take Focus

    XRP Pulls Back to $1.50 as 50-Day SMA, RSI, Volume Profile Levels Take Focus

    Key Highlights

    • XRP maintains a 15.96% weekly gain despite a 6.91% daily pullback to approximately $1.50 on September 24.
    • Daily trading volume reached $6.46 billion with a market capitalization of $94.6 billion, keeping XRP as the fifth-largest cryptocurrency.
    • Technical indicators show RSI at 59 and price trading 16% above the 50-day moving average, while the volume point of control sits at $1.37.

    XRP Retreats From Weekly High While Preserving Strong Seven-Day Performance

    XRP staged a notable pullback on September 24, surrendering a portion of its recent advance as the token declined 6.91% over the preceding 24 hours to trade near the $1.50 level. Despite the intraday weakness, the asset retained a substantial weekly gain of 15.96% according to CoinMarketCap data, with CoinGecko recording a comparable 15.9% increase over the seven-day window. The cryptocurrency’s seven-day trading range extended from $1.29 to $1.66, placing the current price approximately 9.6% below the weekly high. The 24-hour range reflected similar pressure, with CoinMarketCap logging a low of $1.48 and a high of $1.63, positioning XRP near the lower boundary of its daily session.

    Market Structure and Technical Indicators Signal Underlying Strength

    Beneath the surface decline, several technical metrics suggest the broader uptrend remains intact. The daily relative strength index (RSI) registered 59 during the weekly advance, positioning the momentum oscillator above its neutral midpoint of 50 but comfortably below the conventional overbought threshold of 70. This reading indicates positive momentum without excessive speculative froth. Additionally, XRP’s price traded approximately 16% above its 50-day moving average, a widely watched trend-following indicator that supports the bullish intermediate-term structure. The volume profile’s point of control—the price level where the highest trading volume occurred within the measured range—stood at $1.37. Unlike moving averages that track price over time, the point of control identifies where actual trading activity was most concentrated. With XRP holding above this level at $1.50, and the $1.37 point of control sitting between the current price and the seven-day low of $1.29, the volume architecture reinforces the notion that buyers have defended key demand zones.

    Daily Decline Outpaces Broader Market Weakness

    The token’s intraday retreat coincided with a broader risk-off session across digital assets. CoinMarketCap reported the total cryptocurrency market capitalization contracted 2.96% over 24 hours to approximately $2.86 trillion. XRP’s 6.91% decline exceeded the aggregate market’s percentage drop, indicating the asset faced idiosyncratic selling pressure or simply higher beta relative to the market during the correction. However, the weekly comparison tells a different story. Over the seven-day period, CoinGecko recorded a 9.6% increase in the broader cryptocurrency market, while XRP advanced 15.9%, meaning the token continued to outperform the general market on the weekly timeframe despite its larger daily retreat. This divergence suggests the weekly uptrend retains credibility even as short-term profit-taking or rebalancing flows pressure the price.

    Circulating Supply and Market Position Remain Stable

    Throughout the volatility, XRP’s fundamental market structure showed no material shifts. The circulating supply stood at approximately 62.88 billion tokens, supporting the $94.6 billion market capitalization that secures its position as the fifth-largest cryptocurrency by market value. The $6.46 billion in daily trading volume reflects healthy liquidity, ensuring that price discovery remains efficient even during corrective phases. The combination of elevated volume, sustained weekly outperformance, and technical indicators holding in constructive territory frames the current pullback as a consolidation within a larger advance rather than a trend reversal.

    Why This Matters

    XRP’s ability to maintain a near-16% weekly gain while the broader crypto market rose roughly half that amount underscores persistent relative strength, likely driven by a combination of Ripple-related legal developments, institutional interest, and technical breakout confirmation above key resistance levels. The volume point of control at $1.37—now acting as support—represents a high-conviction accumulation zone where significant trading activity occurred, suggesting institutional or whale participation. The RSI at 59 indicates room for further upside before overbought conditions emerge, while the 16% premium to the 50-day moving average signals a strongly trending market. Traders and investors should monitor whether the $1.48–$1.50 zone holds as support; a break below the point of control at $1.37 would shift the near-term bias toward deeper correction. The upcoming sessions will test whether XRP can resume its outperformance or if the daily decline marks the start of a more extended consolidation.

    Frequently Asked Questions

    What is XRP’s current price and weekly performance as of September 24?
    XRP traded near $1.50 on September 24, down 6.91% in 24 hours but still holding a 15.96% gain over the prior seven days according to CoinMarketCap.
    How does XRP’s performance compare to the broader cryptocurrency market?
    On a daily basis, XRP’s 6.91% decline exceeded the total crypto market’s 2.96% drop. However, on a weekly basis, XRP advanced 15.9% versus the broader market’s 9.6% gain, indicating continued outperformance over the longer timeframe.
    What do the key technical indicators suggest about XRP’s trend?
    The daily RSI at 59 shows positive momentum without being overbought, while the price trading 16% above the 50-day moving average confirms a strong uptrend. The volume point of control at $1.37 acts as a key support level between the current price and the weekly low of $1.29.
  • Barclays, HSBC, Lloyds and Other UK Banks Test Tokenized Deposits in First Live Customer Transactions

    Barclays, HSBC, Lloyds and Other UK Banks Test Tokenized Deposits in First Live Customer Transactions

    Key Highlights

    • Seven major UK banks—including Barclays, HSBC UK, Lloyds, Monzo, Nationwide, NatWest, and Santander—executed the first live customer transactions using tokenized sterling deposits through the Great British Tokenised Deposit initiative.
    • The pilots covered two remortgage completions and a consumer marketplace purchase, demonstrating automated fund locking and release that reduces settlement delays and counterparty risk.
    • Future phases aim to connect tokenized deposits with digital assets and test delivery-versus-payment-versus-reserves settlement on the Quant-developed GBTD platform.

    UK Banks Complete First Live Tokenized Deposit Transactions

    Britain’s largest retail and commercial banks have moved tokenized sterling deposits from concept to production, processing live customer payments through a shared industry platform. The milestone, disclosed in a September 24 statement, marks the first time programmable commercial bank money has been used for genuine retail transactions in the United Kingdom. The activity was coordinated under the Great British Tokenised Deposit (GBTD) initiative, convened by the trade association UK Finance, and involved a consortium of seven institutions: Barclays, HSBC UK, Lloyds Banking Group, Monzo, Nationwide Building Society, NatWest Group, and Santander UK.

    Remortgage and Marketplace Pilots Demonstrate Programmable Benefits

    The initial pilots focused on two high-value remortgage completions and a single consumer-to-consumer marketplace purchase. In the remortgage scenarios, funds were programmatically locked at the outset and released automatically only when legal completion was confirmed, eliminating the manual coordination that typically introduces settlement latency. Notably, customers continued to earn interest on their deposits during the pre-completion period, preserving the economic characteristics of a traditional bank account. For the marketplace transaction, the buyer’s funds remained immobilized until the goods were physically received, illustrating how conditional payment logic can mitigate counterparty risk in peer-to-peer commerce.

    Quant-Built Platform Provides Shared Infrastructure

    All transactions were executed on the GBTD platform, developed by enterprise blockchain firm Quant to serve as common infrastructure for tokenized commercial bank money. The architecture is designed to allow multiple issuers to operate interoperable tokenized deposits on a single network while maintaining each bank’s independent ledger and regulatory obligations. Participants emphasized that the model retains the trust, deposit protections, and regulatory framework associated with conventional sterling deposits, distinguishing it from stablecoins or crypto-assets that operate outside the commercial banking perimeter.

    Why This Matters

    The successful live trials represent a significant step toward the Bank of England’s broader exploration of wholesale and retail central bank digital currency (CBDC) coexistence with private-sector innovation. By proving that tokenized deposits can settle real-world obligations—such as property completions and e-commerce escrow—without sacrificing deposit insurance or interest accrual, the GBTD initiative addresses a critical gap in the digital money debate. The next phase, which will link tokenized deposits to digital asset settlement and test delivery-versus-payment-versus-reserves (DvPvR) mechanics, could lay the groundwork for instantaneous, atomic settlement of tokenized securities, foreign exchange, and syndicated loan facilities, potentially reducing systemic counterparty exposure across UK financial markets.

    Frequently Asked Questions

    What is the Great British Tokenised Deposit (GBTD) initiative?
    GBTD is an industry-led program convened by UK Finance that enables participating UK banks to issue, transfer, and settle tokenized sterling deposits on a shared platform developed by Quant. It aims to bring the functionality of programmable money to commercial bank deposits while preserving existing regulatory protections.
    Which banks participated in the first live transactions?
    The seven participating institutions are Barclays, HSBC UK, Lloyds Banking Group, Monzo, Nationwide Building Society, NatWest Group, and Santander UK.
    How do tokenized deposits differ from stablecoins?
    Tokenized deposits are liabilities of regulated commercial banks, carry standard deposit insurance protections, and exist within the existing monetary and regulatory framework. Stablecoins are typically issued by non-bank entities, may not offer deposit insurance, and operate under different regulatory regimes.
  • Aptos Releases Mainnet Node v1.49.1 as Validator Upgrade Cycle Continues

    Aptos Releases Mainnet Node v1.49.1 as Validator Upgrade Cycle Continues

    Key Highlights

    • Aptos Labs has published mainnet node software v1.49.1, a production release for validators and fullnode operators that consolidates execution, consensus, storage, and state-sync improvements.
    • The release rolls forward fixes from the prior v1.49 hotfix path into a standard public build, giving infrastructure operators a stable, maintainable baseline.
    • No action is required from $APT holders; the upgrade is purely infrastructure-focused and does not involve token migrations, wallet updates, or user-facing changes.

    Aptos Labs Delivers Mainnet Node v1.49.1 for Validator and Fullnode Operators

    Aptos Labs has shipped mainnet node software v1.49.1, a production-grade release targeted squarely at validator operators, fullnode providers, indexers, and RPC services. The update packages a broad set of changes spanning execution consistency, consensus behavior, storage handling, state synchronization, and the Move runtime environment. Crucially, it also incorporates fixes that previously existed only in the private v1.49 hotfix branch, giving the operator community a single, public baseline to deploy and maintain.

    Consolidating Hotfixes into a Standard Release Path

    The v1.49.1 changelog reflects work on validator recovery, database handling, and execution determinism—areas that directly affect network stability under load. By folding the emergency hotfixes into a standard mainnet build, Aptos Labs addresses a practical operational need: validators and infrastructure providers can now move off a narrowly distributed patch branch onto a versioned release with a complete changelog. This reduces version fragmentation across the network, which is essential when multiple parties need to reproduce bugs or coordinate upgrades against the same software baseline.

    Infrastructure Upgrade, Not a User-Facing Fork

    Despite the version increment, the release carries no user-facing implications. $APT holders do not need to swap tokens, update wallet balances, or interact with migration contracts. The practical work sits entirely with node operators planning their next maintenance window. For ordinary users, the optimal outcome is invisible—a network that continues running reliably without demanding any action on their part.

    Why This Matters

    Blockchain software releases are frequently labeled “network upgrades” even when the end-user experience is unchanged. In this case, the distinction is material: v1.49.1 is an operational consolidation effort. Aptos has been iterating rapidly through the 1.49 series, and moving emergency fixes into a supported mainline release is a necessary step toward long-term stability. For validators, RPC providers, and indexers, a common software target simplifies debugging, reduces the risk of consensus divergence, and provides a clearer upgrade cadence. While Aptos continues to address broader stability challenges under heavy load, establishing a clean production baseline after a hotfix cycle is a foundational part of that work.

    Frequently Asked Questions

    Do $APT token holders need to take any action for v1.49.1?

    No. The release is strictly for validator and fullnode operators. End users do not need to migrate tokens, update wallets, or interact with any contracts.

    What changes are included in the v1.49.1 release?

    The release covers execution consistency, consensus improvements, storage and database handling, state synchronization, validator recovery logic, and the Move environment. It also rolls forward all fixes from the prior v1.49 hotfix branch into a single public build.

    Who should upgrade to v1.49.1 and why?

    Validators, fullnode providers, indexers, and RPC operators should plan an upgrade. The release provides a stable, versioned baseline with a complete changelog, replacing the emergency hotfix branch and reducing version fragmentation across the network.

  • US Banks Shift From Bitcoin to Altcoins as Three Tokens Gain Attention

    US Banks Shift From Bitcoin to Altcoins as Three Tokens Gain Attention

    Key Highlights

    • Bitcoin’s share of US banks’ cryptocurrency exposure dropped sharply from 75.8% to 44.2%, according to new Basel Committee on Banking Supervision data cited by Ledger Insights.
    • Ethereum’s allocation surged to 38.5%, while Solana (7.8%) and XRP (5.6%) entered bank portfolios as notable holdings.
    • Client-driven crypto transaction volumes at American banks jumped 93% to €6.4 billion, contrasting with a 25% decline in Europe to €1.9 billion.

    US Banks Drastically Reduce Bitcoin Exposure in Favor of Ethereum, Solana, and XRP

    New regulatory data published by the Basel Committee on Banking Supervision (BCBS) reveals a profound rotation in how financial institutions across the Americas are allocating capital across digital assets. According to analysis by Ledger Insights, Bitcoin’s ($BTC) dominance within bank cryptocurrency risk portfolios has nearly halved, falling from 75.8% to 44.2% — a shift that signals growing institutional comfort with alternative Layer 1 networks and a diversification away from the original cryptocurrency as a sole reserve asset.

    Ethereum Emerges as Primary Beneficiary of Portfolio Rebalancing

    The decline in Bitcoin’s weighting has coincided with a substantial rise in Ethereum ($ETH) exposure, which now accounts for 38.5% of banks’ crypto risk portfolios in the Americas. This near-parity with Bitcoin marks a watershed moment for institutional adoption of the second-largest blockchain by market capitalization. Additionally, Solana ($SOL) and XRP have established measurable footholds, registering 7.8% and 5.6% allocations respectively. The presence of these assets in regulated bank portfolios suggests evolving risk frameworks that now accommodate a broader spectrum of crypto assets beyond Bitcoin.

    Total Crypto Risk Exposure Remains Stable Amid Allocation Shift

    Notably, the BCBS data indicates no material change in the aggregate cryptocurrency risk held by banks during the reporting period. This stability implies that the observed rebalancing reflects strategic asset rotation rather than a net reduction in digital asset engagement. Banks appear to be actively managing concentration risk by redistributing exposure across multiple protocols, a development consistent with maturing institutional custody and risk management practices.

    Client-Driven Trading Activity Surges in Americas, Contracts in Europe

    Beyond proprietary holdings, the data captures a sharp divergence in client-facing crypto activity. Transaction volumes executed by banks on behalf of customers in the Americas surged 93% period-over-period, reaching €6.4 billion. In contrast, European banks saw a 25% decline in similar client flows, falling to €1.9 billion. The asymmetry underscores differing regulatory climates and market appetites across jurisdictions, with U.S. institutions capturing a growing share of institutional and high-net-worth crypto order flow.

    Why This Matters

    The BCBS portfolio data offers the most transparent window yet into how globally systemically important banks are treating digital assets under the evolving Basel III prudential framework. The rotation from Bitcoin toward Ethereum, Solana, and XRP suggests that regulatory capital rules — which assign higher risk weights to less liquid or more volatile assets — may be influencing allocation decisions as much as market conviction. Meanwhile, the explosion in Americas-based client volumes signals that U.S. banks are increasingly acting as on-ramps for institutional capital, even as Europe’s Markets in Crypto-Assets (MiCA) regime continues to take shape. Future BCBS disclosures will be critical for tracking whether this diversification trend accelerates or stabilizes.

    Frequently Asked Questions

    What does the BCBS data measure exactly?
    The data tracks the composition of cryptocurrency risk exposures held by banks in the Americas, expressed as percentage allocations across specific assets, as reported under Basel Committee supervisory standards.
    Did banks sell Bitcoin to buy Ethereum, Solana, and XRP?
    The data shows a shift in portfolio weightings but does not confirm net buying or selling of any specific asset, as total crypto risk exposure remained stable. The rebalancing could reflect valuation changes, new allocations, or a combination of both.
    Why did client transaction volumes rise in the Americas but fall in Europe?
    The divergence likely reflects differences in regulatory clarity, institutional adoption curves, and market structure. The U.S. has seen growing custodial and prime brokerage services for crypto, while Europe’s MiCA framework is still being implemented.
  • Crypto Casino Duelbits Goes Offline After $7 Million Hot Wallet Hack

    Crypto Casino Duelbits Goes Offline After $7 Million Hot Wallet Hack

    Key Highlights

    • Crypto gambling platform Duelbits suffered a $7 million hot wallet exploit on Thursday, prompting the site to go offline while co-founder Joe confirmed “user funds are safe.”
    • Blockchain security firm Scam Sniffer identified a suspected private key compromise affecting wallets on Ethereum, BNB Chain, Tron, and Bitcoin, with 8.1 BTC also stolen.
    • The attack mirrors the 2023 Stake.com breach, where hackers stole $40 million using the same private key compromise method.

    Duelbits Takes Platform Offline After $7 Million Hot Wallet Drain

    Crypto gambling platform Duelbits went offline on Thursday after attackers drained approximately $7 million from its hot wallets across multiple blockchains. The incident was first flagged by blockchain security firm Scam Sniffer, which reported that Duelbits hot wallets on Ethereum, BNB Chain, and Tron had sent funds to newly created addresses in what appeared to be a private key compromise. The firm later confirmed the company’s Bitcoin hot wallet also lost 8.1 BTC in the attack.

    Co-Founder Confirms Breach, Assures User Funds Secure

    Duelbits co-founder Joe addressed the incident on X, stating: “Confirming a ~$7M hack. Still investigating exactly what happened and how,” adding that “user funds are safe.” He indicated the platform would remain offline until the investigation concludes and its hot wallets are refilled. The direct acknowledgment from leadership came as on-chain data continued to reveal the full scope of the asset movements.

    On-Chain Analysis Reveals Multi-Chain Asset Losses

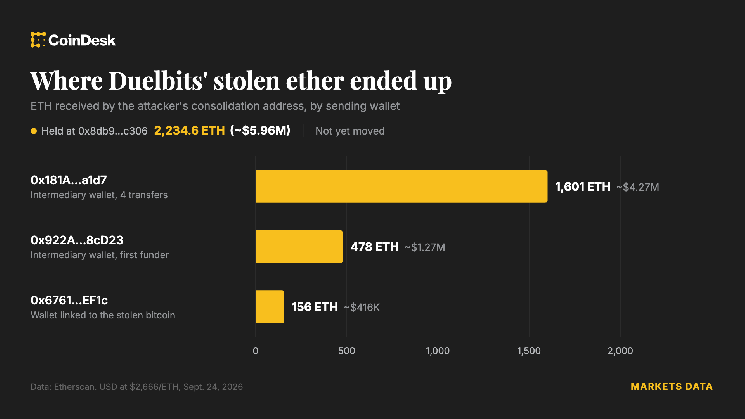
    Etherscan data shows the Ethereum wallet labeled as a Duelbits hot wallet transferred 836 ETH, approximately 593,000 USDT, 97,000 USDC, 31,500 DAI, and 12.4 billion SHIB to the attacker within minutes. The compromised Ethereum wallet now holds less than $25 in ether. Scam Sniffer’s analysis indicates the simultaneous compromise across Ethereum, BNB Chain, Tron, and Bitcoin networks strongly points to a private key breach rather than a smart contract vulnerability.

    Attack Method Mirrors 2023 Stake.com Breach

    The suspected private key compromise mirrors the methodology used in the 2023 attack on Stake.com, the largest crypto casino by volume, where hackers made off with $40 million. That incident, also attributed to a private key compromise, raised significant concerns about key management practices across the crypto gambling sector. The recurrence of this attack vector suggests persistent operational security challenges for platforms managing large hot wallet balances.

    Why This Matters

    The Duelbits hack underscores the ongoing vulnerability of centralized hot wallet infrastructure in the crypto gambling industry. Despite high-profile incidents like the Stake.com breach, platforms continue to maintain substantial assets in internet-connected wallets secured by single points of failure. The multi-chain nature of this exploit—hitting Ethereum, BNB Chain, Tron, and Bitcoin simultaneously—demonstrates how a single private key compromise can cascade across an operator’s entire treasury. For users, the incident reinforces the importance of platform solvency transparency and the risks inherent in custodial gambling platforms. Regulators and industry watchdogs will likely scrutinize whether Duelbits’ claim that “user funds are safe” holds up during the investigation and whether the platform maintains sufficient cold storage reserves to cover the hot wallet losses without impacting customer balances.

    Frequently Asked Questions

    How much was stolen in the Duelbits hack?

    Approximately $7 million was drained from Duelbits hot wallets across Ethereum, BNB Chain, and Tron, plus an additional 8.1 BTC from the platform’s Bitcoin hot wallet.

    What caused the Duelbits security breach?

    Blockchain security firm Scam Sniffer identified a suspected private key compromise as the attack vector, noting that wallets across multiple chains sent funds to newly created addresses simultaneously.

    Is Duelbits currently operational?

    No, Duelbits has taken its platform offline. Co-founder Joe stated the site will remain offline until the investigation is finished and hot wallets are refilled.

  • Coinbase Issues Warning Following XRP Rally

    Coinbase Issues Warning Following XRP Rally

    Key Highlights

    • Coinbase Markets data shows XRP one-week call/put implied volatility skew hit 9.3 volatility points, placing it in the top 5% of readings over the past year, signaling heightened bullish derivative demand.
    • XRP futures open interest surged to $4.1 billion, with CME Group overtaking Binance as the leading venue, indicating growing institutional participation in the token’s derivatives market.
    • Analysts warn the concentration of long call positions after XRP’s 15–18% weekly rally creates “crowded positioning” risk, which could amplify downside volatility if sentiment reverses.

    XRP Derivatives Signal Aggressive Bullish Positioning Amid Market Pullback

    Bitcoin’s recent ascent above $87,000 and broad altcoin strength were abruptly halted this week as surging global bond yields—reaching levels last seen in 2007—triggered a sharp risk-off move across digital assets. While major cryptocurrencies retreated from local highs, on-chain and derivatives data for XRP tell a contrasting story of intensifying speculative conviction. Coinbase Markets, the institutional-facing arm of the Nasdaq-listed exchange, published a detailed analysis highlighting an extraordinary shift in XRP options pricing that suggests professional traders are betting heavily on continued upside.

    Options Skew Reaches Extreme Bullish Territory

    According to Coinbase Markets, the one-week implied volatility spread between XRP call and put options widened to 9.3 volatility points. This metric, known as the risk reversal or skew, sits in the 95th percentile of observations recorded over the trailing twelve months. In practical terms, the premium investors are willing to pay for upside protection (calls) versus downside protection (puts) has ballooned, reflecting a consensus expectation that XRP’s recent 15% to 18% weekly gain is a precursor to further appreciation rather than exhaustion. Coinbase cautions, however, that a 9.3-point volatility differential does not mathematically translate to a 9.3% price move; it merely quantifies the intensity of directional demand in the options market.

    Futures Open Interest Hits $4.1 Billion as CME Leads Institutional Flow

    Complementing the options signal, aggregate open interest across XRP futures contracts climbed to $4.1 billion. Notably, CME Group—the primary regulated venue for institutional crypto derivatives in the United States—surpassed Binance in XRP futures volume and open interest. This shift is widely interpreted by market structure analysts as evidence that regulated, compliance-first capital is allocating to XRP with greater conviction than retail-heavy offshore platforms. The CME’s leadership position in a specific altcoin’s futures complex is relatively rare and underscores the token’s evolving status among professional allocators.

    Why This Matters: Crowded Trade Dynamics and Macro Crosscurrents

    The confluence of extreme options skew and record futures open interest introduces a classic “crowded positioning” vulnerability. When a disproportionate share of market participants holds similar directional bets—here, long calls and long futures—any catalyst that challenges the thesis can trigger a violent unwind. Forced liquidation of leveraged futures and delta-hedging by options market makers can accelerate price declines, creating a feedback loop detached from spot fundamentals. This risk is amplified by the macro backdrop: the U.S. 10-year Treasury yield piercing 4.5% has already pressured risk assets broadly. Should yields continue climbing, the high-beta nature of altcoins like XRP could see disproportionate selling, testing the resolve of the very derivatives positions that currently appear so bullish. Traders and risk managers will monitor CME positioning reports and options expiry calendars closely for signs of de-risking.

    Frequently Asked Questions

    What does a 9.3-point call/put implied volatility skew mean for XRP?
    It indicates that options market participants are paying a significantly higher premium for one-week call options versus put options, placing current demand for upside exposure in the top 5% of the past year. It reflects sentiment, not a guaranteed price target.
    Why is CME surpassing Binance in XRP futures significant?
    CME is the primary regulated derivatives marketplace for U.S. institutions. Its leadership in XRP futures suggests professional, compliance-driven capital is actively building positions, which often correlates with longer holding periods and deeper liquidity than retail-dominated offshore venues.
    What is the primary risk highlighted by Coinbase Markets?
    Coinbase warns of “crowded positioning” risk: if a large number of investors hold similar long positions simultaneously, a sudden sentiment reversal can cause exaggerated price swings as participants rush to exit, amplified by futures liquidations and options dealer hedging.

    *This article summarizes third-party market analysis and does not constitute investment advice.

  • Bitcoin Bear Markets Growing Milder, Signaling Potential Bull Market Ahead

    Bitcoin Bear Markets Growing Milder, Signaling Potential Bull Market Ahead

    Key Highlights

    • Bitcoin ETFs have shifted ownership toward financial advisers and professional investors who typically allocate around 2% of portfolios to the asset, compared to 20–30% or more for crypto-native retail investors.
    • Institutional rebalancing behavior—buying after declines and selling after surges to maintain target weights—is expected to soften sell-offs but also cap the magnitude of rallies.
    • Risk Dimensions CIO Mark Connors predicts smaller drawdowns than the 70–80% crashes of prior cycles, but warns that reduced volatility comes with moderated returns and “smaller blow-off tops.”

    ETFs Reshape Bitcoin Ownership From Retail to Professional Hands

    Before the launch of spot bitcoin exchange-traded funds, ownership of the largest cryptocurrency was concentrated among retail investors, crypto-native funds, and traders making tactical bets. According to Rasmussen, the introduction of ETFs provided financial advisers and other professional investors with a familiar, regulated vehicle to add bitcoin to traditional portfolios. This structural shift has fundamentally altered the composition of the investor base, bringing in participants who approach the asset through the lens of portfolio construction rather than speculative conviction.

    Allocation Discipline Creates Divergent Risk Profiles

    The difference in allocation size creates starkly different risk experiences. Rasmussen noted that a professional investor might allocate roughly 2% of a portfolio to bitcoin, whereas crypto-focused retail investors often commit 20%, 30%, or more of their capital to the asset. Consequently, a 50% price decline impacts these groups in vastly different ways. “If it goes down 50%, my portfolio is only down 1%,” Rasmussen said in an interview, describing how an investor with a 2% allocation might view the decline. For a retail holder with a 30% allocation, the same drop would erase 15% of total portfolio value.

    Rebalancing Mechanics May Dampen Volatility Cycles

    Beyond allocation size, the discipline of periodic rebalancing introduces a mechanical counter-cyclical force. An adviser targeting a 2% bitcoin weight may buy after a steep decline to restore the target allocation, providing a floor of demand during sell-offs. Conversely, if bitcoin surges and grows to 5% of the portfolio, that same investor may sell a portion at the next rebalancing date, creating natural supply at higher prices. This dynamic could soften the depth of corrections while simultaneously limiting the explosive upside that characterized earlier market cycles.

    Institutionalization Brings Trade-Offs: Smaller Drawdowns, Moderated Returns

    Mark Connors, chief investment officer at Risk Dimensions, expects growing institutional participation to contribute to smaller drawdowns than the 70–80% declines observed in previous bitcoin cycles. However, he cautioned that investors should not expect to get something for nothing. Connors said bitcoin’s volatility has fallen over time, but its returns have moderated as well. More institutional investors could mean “smaller blow-off tops due to rebalancing,” he said, highlighting the trade-off between reduced downside risk and capped upside potential as the asset matures within traditional financial infrastructure.

    Why This Matters

    The transition from a retail-dominated market to one with significant professional participation marks a structural maturation for bitcoin as an asset class. The introduction of spot ETFs in the United States has accelerated this shift by lowering operational and custody barriers for registered investment advisors, family offices, and institutional allocators. As these investors apply modern portfolio theory—fixed allocations, systematic rebalancing, and risk-budgeting frameworks—the statistical properties of bitcoin’s price action are likely to evolve. Historically, bitcoin’s boom-bust cycles were amplified by homogeneous, high-conviction holders prone to panic selling and euphoric buying. A more diverse holder base with differentiated time horizons and mandate constraints could produce a return profile that resembles other alternative assets: lower volatility, reduced tail risk, but also diminished alpha relative to the asset’s early years. For allocators, this raises strategic questions about bitcoin’s role in a portfolio—whether it remains a high-beta growth sleeve or transitions toward a diversifier with equity-like risk and modestly enhanced returns.

    Frequently Asked Questions

    How does a typical professional investor’s bitcoin allocation differ from a retail crypto investor’s?

    Professional investors such as financial advisers typically allocate around 2% of a portfolio to bitcoin, while crypto-focused retail investors often hold 20%, 30%, or more of their total capital in the asset.

    What effect does portfolio rebalancing have on bitcoin’s price cycles?

    Systematic rebalancing creates counter-cyclical flows: advisers buy bitcoin after price declines to restore target weights, supporting prices during corrections, and sell after sharp rallies to trim overweight positions, capping upside momentum.

    Will institutional adoption eliminate bitcoin’s volatility entirely?

    No. Mark Connors of Risk Dimensions notes that while institutional participation may reduce the severity of drawdowns compared to historical 70–80% crashes, volatility will persist and returns are likely to moderate, resulting in “smaller blow-off tops due to rebalancing.”

  • Data Proves Bitcoin Unfazed by Rising Bond Yields Long-Term

    Data Proves Bitcoin Unfazed by Rising Bond Yields Long-Term

    Key Highlights

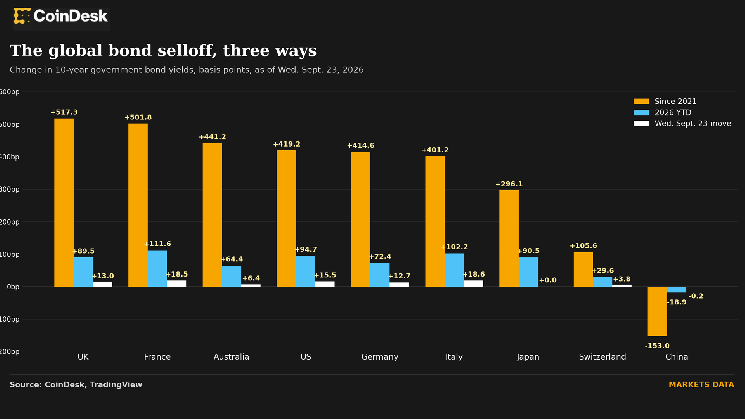
    • U.S. 10-year Treasury yield surged 15 basis points to 5.13%, the highest level since 2007, triggering global yield increases.
    • Bitcoin’s 90-day correlation with U.S. 10-year yield daily moves stands at just −0.18, with 180-day and 1-year correlations even closer to zero at −0.06 and −0.03 respectively.
    • Historical data analyzed by CoinDesk shows Bitcoin has demonstrated little to no consistent correlation with bond yields across multiple timeframes and international markets.

    Rising Yields Reignite Debate Over Bitcoin’s Macro Sensitivity

    The U.S. 10-year Treasury yield jumped 15 basis points on Wednesday to breach 5.13%, marking its highest level since the pre-financial crisis era of 2007. The move rippled across global fixed-income markets, pulling sovereign yields higher worldwide and reviving a familiar market narrative: that rising bond yields create a structural headwind for non-yielding assets like Bitcoin (BTC) and gold. The conventional logic posits that as risk-free returns become more attractive, the opportunity cost of holding zero-coupon assets increases, theoretically drawing capital away from crypto and toward government debt.

    Correlation Data Contradicts Conventional Wisdom

    While the theoretical framework appears sound on paper, empirical evidence fails to support a consistent inverse relationship. According to data analyzed by CoinDesk, the 90-day rolling correlation between Bitcoin’s daily returns and daily moves in the U.S. 10-year yield sits at just −0.18—a figure statistically indistinguishable from zero correlation. Extending the observation window does not strengthen the link; the 180-day correlation narrows further to −0.06, while the one-year correlation stands at a negligible −0.03. Across every measured timeframe, Bitcoin’s price action has exhibited virtually no linear dependence on the trajectory of U.S. benchmark yields.

    Global Yield Regimes Show Similar Disconnect

    The absence of correlation is not confined to the United States. Bitcoin has demonstrated an equally weak statistical relationship with the sovereign yields of other major economies. This global pattern suggests that Bitcoin’s valuation drivers operate independently of the interest rate channels that dominate traditional asset pricing models. Rather than functioning as a simple “risk-off” or “risk-on” proxy sensitive to the cost of capital, the asset’s historical behavior aligns more closely with a distinct, idiosyncratic return stream shaped by network adoption cycles, liquidity conditions specific to crypto markets, and evolving regulatory narratives.

    Why This Matters

    The persistent disconnect between Bitcoin and bond yields carries significant implications for portfolio construction and macro strategy. Investors and analysts who position Bitcoin strictly as a rate-sensitive speculative asset may be relying on a flawed mental model that has not held up over the asset’s history. As central banks navigate a potential “higher for longer” rate environment, understanding Bitcoin’s true correlation profile—effectively zero with respect to sovereign yields—becomes critical for accurate risk budgeting. The data suggests Bitcoin should be evaluated on its own fundamental merits and crypto-specific catalysts rather than through the lens of traditional duration risk.

    Frequently Asked Questions

    What is the current correlation between Bitcoin and the U.S. 10-year Treasury yield?

    As of the latest analysis by CoinDesk, the 90-day correlation is −0.18, the 180-day correlation is −0.06, and the one-year correlation is −0.03—all statistically near zero.

    Does Bitcoin correlate with bond yields in other countries?

    No. The data shows Bitcoin is equally uncorrelated with the sovereign yields of other nations, indicating this is a global phenomenon rather than a U.S.-specific anomaly.

    Why does the market still believe rising yields hurt Bitcoin?

    The narrative relies on theoretical opportunity cost logic: higher risk-free rates should make non-yielding assets less attractive. However, historical price data does not bear out this relationship, suggesting other factors dominate Bitcoin’s valuation.

  • Token Burns Continue for Popular Altcoin; Latest Burn Amount Revealed

    Token Burns Continue for Popular Altcoin; Latest Burn Amount Revealed

    Key Highlights

    • Polygon Foundation CEO Sandeep Nailwal announced on September 24 that 100 million $POL tokens have been permanently burned, removing approximately 1% of the total supply from circulation.
    • The tokens were sent to an inaccessible address in a process known as “token burning,” making them permanently unrecoverable and unable to re-enter the market.
    • Nailwal’s announcement did not disclose the specific reasons for the burn, its expected impact on Polygon’s token economy, or any new supply arrangements for $POL following the reduction.

    Polygon Foundation Executes 100 Million $POL Token Burn

    Polygon Foundation CEO Sandeep Nailwal confirmed on September 24 that the organization has permanently removed 100 million $POL tokens from circulation. In a social media post, Nailwal stated that the tokens were “permanently incinerated”, a phrasing that underscores the irreversible nature of the operation. The burned amount represents roughly 1% of the total $POL supply, marking a notable contraction in the token’s circulating float.

    Mechanics of the Supply Reduction

    The burn was executed by sending the 100 million tokens to an inaccessible wallet address, a standard cryptographic method for permanently destroying digital assets. Once transferred to such an address—often referred to as a “null” or “burn” address—the tokens can never be retrieved, spent, or reintroduced into the Polygon ecosystem. This operation directly reduces the total supply of $POL, the native token that powers network activities, staking, governance, and transaction fees across Polygon’s suite of scaling solutions.

    Strategic Context Remains Undisclosed

    Despite the significance of a 1% supply reduction, Nailwal’s statement offered no explanation for the decision. The post did not reference a scheduled burn mechanism, a governance proposal, a response to inflationary pressures, or any upcoming changes to $POL’s emission schedule. Similarly, the Polygon Foundation has not published details on whether this burn is a one-time event or part of a broader tokenomic redesign. The absence of forward-looking guidance leaves market participants without clarity on future supply dynamics.

    Why This Matters

    Token burns are a closely watched lever in crypto economics because they alter the supply side of the valuation equation without necessarily changing demand. For $POL, which succeeded MATIC as the ecosystem’s primary asset following the Polygon 2.0 upgrade, supply management is critical to its role in securing the AggLayer and incentivizing validators. A 1% reduction is modest in isolation, but if it signals the start of a programmatic burn schedule—similar to Ethereum’s EIP-1559 fee burn or BNB’s quarterly auto-burn—it could establish a deflationary narrative that influences long-term holder sentiment and staking yields. Until the Foundation provides a rationale or roadmap, the burn remains a discrete event rather than a confirmed policy shift.

    Frequently Asked Questions

    What exactly does it mean that 100 million $POL tokens were “permanently incinerated”?

    The tokens were sent to a cryptographic address with no known private key, making them mathematically impossible to access or spend. They are effectively destroyed and will never re-enter circulation.

    Did Sandeep Nailwal or the Polygon Foundation explain why this burn was conducted?

    No. The September 24 announcement did not include any reasoning, strategic context, or indication of whether further burns are planned.

    How does this burn affect the total and circulating supply of $POL?

    The operation reduces the total supply by approximately 1%. Since the tokens were removed from circulation entirely, the circulating supply decreases by the same amount, assuming the burned tokens were previously part of the circulating float.