Author: Evan Mercer

  • Shiba Inu (SHIB) Sees Bullish Outflows Surge 79% in 24 Hours

    Shiba Inu (SHIB) Sees Bullish Outflows Surge 79% in 24 Hours

    Shiba Inu’s exchange-flow structure has improved significantly, with $SHIB outflows rising sharply over the past 24 hours. The shift comes as the token retests the $0.000005 region, making the change in exchange activity particularly important.

    Over the last day, $SHIB outflows from centralized exchanges increased by approximately 79%, signaling a substantial acceleration in tokens leaving trading platforms.

    Shiba Inu exchange outflows outpace inflows

    The latest data shows total $SHIB outflows of roughly 447.7 billion tokens, compared with exchange inflows of only 134.95 billion. This produced a netflow of approximately negative 312.75 billion $SHIB, a pattern that is generally favorable for the token.

    $SHIB/USDT Chart by TradingView

    Withdrawals reduce the amount of Shiba Inu available for spot selling on exchanges. When outflows substantially exceed deposits, the liquid supply held on exchanges may decline. However, exchange withdrawals alone do not confirm that holders intend to accumulate $SHIB over the long term.

    Exchange data supports a bullish shift

    Additional metrics also point to improving exchange-flow conditions. The seven-day moving average for mean exchange outflows rose 127.82% to approximately 940.84 million $SHIB. The number of withdrawing addresses increased by 1.16%, while outflows associated with the top 10 transactions climbed 2.84%.

    At the same time, Shiba Inu exchange reserves fell 0.36% to about 86.95 trillion $SHIB. Those reserves declined 1.53% in U.S. dollar value.

    SHIB price tests key $0.000005 support

    The timing is significant because $SHIB is currently trading near $0.00000505. After pulling back from a spike to $0.00000620, the token is attempting to stabilize around the psychologically important $0.000005 level. The area also contains dynamic support between $0.00000497 and $0.00000499.

    As the previous rally lost momentum, the relative strength index is near 52, indicating broadly neutral momentum. Shiba Inu still faces significant resistance. Its latest attempt to move above $0.00000570, which corresponds to the 200-day moving average, was unsuccessful.

    Even so, exchange-flow data currently favors buyers over sellers. Approximately 448 billion $SHIB has left exchanges, compared with around 135 billion entering them. If these outflows continue alongside a sustained defense of the $0.000005 level, another attempt to recover the $0.0000055–$0.0000057 resistance zone could become more likely.

    Source: cryptonews.net

  • Beyond the Crypto Rally: 4 Trends to Watch This Cycle

    Beyond the Crypto Rally: 4 Trends to Watch This Cycle

    When crypto prices surge, market commentary often focuses on green candles and central bank policy. But beneath the immediate rally, a deeper structural shift is unfolding on-chain.

    Robinhood CEO Vlad Tenev brought global attention to this shift with the launch of Robinhood Chain, joining a broader movement by major platforms to bring mainstream retail equity investors directly into native on-chain execution.

    Macroeconomic stress provides the backdrop, but technological innovation is the catalyst. Beneath the price action, four key trends are defining the current crypto cycle and reshaping how global wealth is owned, accessed, and stored.

    Trend 1: The Retail Ownership Supercycle

    At a recent White House summit, Vlad Tenev summarised his platform’s mission in a single word: “ownership.” Broad asset ownership is essential to a free and prosperous society, and Robinhood Chain is putting that principle into practice.

    Novel mechanisms such as The Index illustrate how this model works. Holding the single token automatically delivers fractional tokenised equities directly to a user’s wallet. In just a few clicks, crypto-native traders can gain diversified exposure to traditional stock portfolios, extending their investments beyond crypto alone.

    Retail culture is a crucial force behind this movement. Memecoins such as Popcat, Pepe, and Doge demonstrated strong mass-market retail appetite on tier-one exchanges. Today, that same energy is driving on-chain execution.

    On Robinhood Chain, Cashcat has emerged as the leading token and unofficial mascot. Coinbase’s listing of Basecat on Base, together with community-led initiatives built around Cate on Solana, points to a broader, multi-chain “cat season.”

    These community movements are becoming a primary onboarding engine for crypto and tokenised real-world asset ownership.

    Trend 2: CeDeFi and Infrastructure Convergence

    While Robinhood Chain renewed retail interest in on-chain markets, another major development was taking shape at the infrastructure level. In previous cycles, centralised exchanges focused on building isolated, walled-garden blockchains and proprietary wallets. This cycle marks a fundamental shift toward Centralised-Decentralised Finance, or CeDeFi, through direct liquidity integration.

    Two parallel moves demonstrate this trend: Robinhood’s integration of Lighter and VALR’s integration of Hyperliquid.

    If Robinhood’s mission is to expand ownership for everyday retail investors, VALR’s focus is global access. By connecting directly to Hyperliquid’s high-performance order book, VALR gave more than two million users across Africa and emerging markets seamless access to over 200 liquid markets spanning crypto, equities, stock indices, commodities, precious metals, and foreign exchange.

    Trend 3: The Two-Phase Transformation of Money

    This expansion of global market access is laying the foundation for a much larger monetary transition. The evolution of money is unfolding in two distinct phases.

    Phase 1 is already taking place through stablecoins. While the long-term outlook for fiat currency appears bleak, stablecoins make it easier to store, transfer, and spend value. They are becoming practical payment and settlement rails for everyday users, global companies, and international trade.

    However, stablecoins only digitise fiat currency; they do not protect against chronic currency debasement. When it becomes clear to everyone that inflation is indeed not transitory, but long-lasting and ever-worsening, Phase 2 will take hold. The transition to sound money will be swift and violent, with stablecoins providing the off-ramp.

    Tokenised gold such as XAUt and, fundamentally, Bitcoin are natural destinations for this capital. The transition is still in its early stages.

    Trend 4: Agentic Finance and Human Purpose

    Alongside the evolution of money, agentic finance is gaining momentum. Autonomous AI agents and algorithmic execution systems are expected to handle increasingly complex market mechanics, liquidity deployment, and trading strategies.

    The full impact of AI on the global economy is still unfolding. Personally, I would rather focus on painting and tending a rose garden, letting the world figure out the question of AI and robots. Optimistically, that is the true promise of technology anyway: outsourcing the mundane to machines so humans can focus on service, kindness, creativity, and contemplation.

    Beyond Rotation: The Conviction Cycle

    Speculative token-hopping and short-term player-versus-player trading have shaped much of recent crypto culture. Yet, amid this cycle of constant rotation, a simple phrase is taking root: “believe in something.”

    The platforms, protocols, and participants that endure through the next phase of the market will not be those chasing fleeting trends. In addition to ownership and access, this cycle will be defined by conviction.

    About the Author

    Ben Caselin is Chief Marketing Officer at VALR.com, Africa’s largest crypto exchange and infrastructure provider by trade volume. Headquartered in Johannesburg, VALR serves over 1900 corporate and institutional clients and more than 1.9 million traders worldwide.

    Drawing on years of experience in the digital asset sector, primarily in Hong Kong, the UAE, and South Africa, Ben focuses on driving Bitcoin adoption in emerging markets. He advocates for an approach to innovation grounded in spiritual principles.

    Source: cryptonews.net

  • Ethereum Price Analysis: Nine-Day ETF Inflow Streak Keeps ETH Near $2,500

    Ethereum Price Analysis: Nine-Day ETF Inflow Streak Keeps ETH Near $2,500

    Ethereum is trading near $2,500 as institutional demand continues to support the market despite a short-term price decline. Nine consecutive days of Ethereum ETF inflows have kept buying pressure intact, while the token’s weakening on-chain activity creates a notable divergence for traders to monitor.

    Key Takeaways

    • Ethereum is trading near $2,500 after falling 3.60% in 24 hours, with nine consecutive days of ETF inflows providing support.
    • Spot Bitcoin ETFs recorded a $202 million outflow on August 28, ending their own nine-day inflow streak, while spot Ethereum ETFs attracted $102 million, according to SoSoValue.
    • ETH recently moved above its average on-chain cost basis of $2,306, giving holders an opportunity to lock in profits.
    • The Spent Output Profit Ratio (SOPR) has remained above 1 for the past week, indicating that sellers are generally realizing gains.
    • Transaction counts and active addresses have declined even as Ethereum’s price has held firm, creating a divergence that could limit momentum.

    Institutional Demand Supports Ethereum Near $2,500

    Institutional demand, rather than a sudden increase in retail buying, is helping keep Ethereum anchored near $2,500. Nine straight days of ETF inflows have offset short-term profit-taking and provided ETH with a degree of price support despite its negative 24-hour performance.

    Ethereum ETFs Record a Nine-Day Inflow Streak

    Ethereum climbed above $2,400 during a strong August rally before pulling back as traders began taking profits. Even after that decline, ETH has remained close to $2,500, with sustained ETF inflows offering the clearest explanation for its resilience.

    Consistent institutional buying can reduce the volatility typically associated with retail-led sell-offs. The latest Ethereum price action suggests that effect may be playing a role in limiting the downside.

    Bitcoin and Ethereum ETF Flows Diverge

    The difference between Bitcoin and Ethereum ETF flows on August 28 was significant. SoSoValue data showed that U.S. spot Bitcoin ETFs recorded a $202 million net outflow, ending their own nine-day inflow streak. Spot Ethereum ETFs moved in the opposite direction, attracting $102 million in net inflows on the same day.

    The contrast suggests that institutional demand may be rotating toward Ethereum, at least temporarily, while Bitcoin funds experience a pause.

    Profit-Taking Adds Short-Term Pressure

    Ethereum’s retreat after trading above $2,400 appears consistent with profit-taking following the August rally. On-chain data supports that interpretation, although it does not rule out additional short-term weakness.

    ETH Moves Above Its Average On-Chain Cost Basis

    ETH recently moved above the average on-chain cost basis of $2,306. This level is important because it marks the point at which many holders move from unrealized losses into profit.

    When Ethereum trades above that threshold, some investors may sell to secure gains. That selling can create short-term resistance even when the broader trend remains constructive.

    SOPR Shows Sellers Are Realizing Gains

    Ethereum’s Spent Output Profit Ratio, or SOPR, remained above 1 during the past week. The reading indicates that coins moved on-chain were generally sold at a profit rather than at a loss.

    A SOPR reading above 1 does not guarantee that selling will increase, but it confirms that many holders have an incentive to cash out. That helps explain Ethereum’s recent retracement.

    Ethereum Price Falls 3.60% in 24 Hours

    Ethereum is trading near $2,420.48 after falling 3.60% over 24 hours, according to the latest data. The decline follows a powerful August rally that pushed the token above $2,400 for the first time in months.

    Profit-taking after a strong rally is not unusual and, by itself, does not confirm that the broader uptrend has ended. However, ETH may need renewed buying demand to reclaim and hold above $2,500.

    Weakening Network Activity Raises a Caution Flag

    Ethereum’s price has risen faster than the network activity supporting it, creating one of the market’s most important warning signs. Rallies that are not accompanied by increasing usage can be more fragile than those driven by stronger demand for blockspace.

    Transaction Counts and Active Addresses Decline

    Transaction counts and active addresses both fell over the past week, even as ETH remained near multi-month highs. Strong rallies are often accompanied by growing network participation, but that confirmation has not yet appeared in Ethereum’s latest data.

    The decline does not eliminate the bullish case. Markets can move ahead of fundamentals, but Ethereum’s momentum could stall unless network usage begins to recover.

    Derivatives Markets Show Cautious Positioning

    Ethereum’s derivatives market reflects a similarly cautious outlook. Open interest has not meaningfully recovered after a recent leverage flush, while traders have faced significant liquidation activity during the latest period of volatility.

    Stable open interest alongside price gains generally points to hesitant positioning rather than aggressive new leverage entering the market. This suggests that traders are not yet fully convinced the rally has substantial room to continue.

    Whale Buying Emerges Near $2,500 Resistance

    Whale buying near $2,500 has attracted attention and indicates that larger holders may still see value at current levels. The activity provides a counterweight to weaker network data and cautious positioning in derivatives.

    Even so, traders are watching the $2,500 resistance level closely. A failure to break and hold above it could lead to further short-term volatility.

    Overall, Ethereum’s market is being pulled in two directions. Steady institutional inflows and whale interest are supporting ETH, while declining network activity and cautious derivatives positioning remain obstacles. The balance between these forces could determine whether Ethereum turns $2,500 into a launchpad or a ceiling in the coming days.

    Frequently Asked Questions

    What is supporting Ethereum’s price near $2,500?

    Strong institutional demand, reflected in nine consecutive days of ETF inflows, is helping support Ethereum’s price near $2,500.

    Why did Ethereum experience a short-term price pullback?

    The recent retracement appears to have been driven largely by profit-taking. Traders who bought below the $2,306 average on-chain cost basis began selling after Ethereum’s strong August rally.

    How does on-chain activity affect Ethereum’s price momentum?

    Ethereum’s transaction counts and active addresses have declined despite recent price gains. This divergence could limit sustainable upward momentum unless network usage increases.

    What does the Spent Output Profit Ratio indicate about Ethereum sellers?

    A SOPR reading above 1, as recorded over the past week, indicates that sellers moving ETH on-chain are generally realizing profits rather than losses.

  • FOMO Breaks Into the Top 5 U.S. Finance Apps, Surpassing Kalshi and Cash App

    FOMO Breaks Into the Top 5 U.S. Finance Apps, Surpassing Kalshi and Cash App

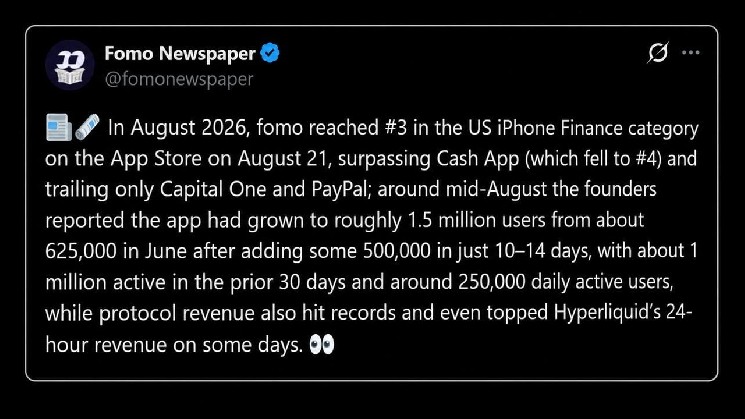
    Fomo has grown from a public beta launched in May 2025 into one of the highest-ranking finance apps in the United States, reaching beyond the crypto market to compete with established banking and payments platforms.

    Fomo Breaks Into the U.S. Finance App Charts

    Founded by Paul Erlanger and Se Yong Park, Fomo climbed into the top five U.S. finance apps on Apple’s App Store by August 21. The crypto trading app surpassed Cash App and briefly reached third place, ahead of prediction-market competitor Kalshi. It currently ranks among the top 15.

    App Store finance rankings are typically dominated by major banks and payment companies rather than crypto-native startups. Fomo’s rise into the top 15 therefore places it alongside brands with significantly longer operating histories and broader mainstream recognition.

    Fomo Raises $94 Million in Equity Funding

    In November 2025, Fomo closed a $17 million Series A led by Benchmark. Instead of presenting the round to institutional funds, Erlanger and Park created a wishlist of 200 preferred angel investors. A total of 140 investors participated, including Polygon Labs chief executive Marc Boiron, Solana co-founder Raj Gokal and former Coinbase chief technology officer Balaji Srinivasan.

    The Series A was followed by a $75 million Series B. By then, Fomo had more than 600,000 users and had processed over $4 billion in trading volume, bringing the company’s total disclosed equity funding to approximately $94 million.

    How Fomo Makes Crypto Trading Social

    Fomo’s core appeal centers less on technical charts and more on social discovery. Users can see what people they follow are trading in real time, monitor leaderboards and copy trading signals. They can also fund trades instantly through Apple Pay.

    The product is designed to make crypto trading feel more like a social media experience than a traditional financial terminal. Fomo supports trading across Solana, Base, BNB Chain, Monad and Robinhood Chain, giving the app exposure across multiple blockchain ecosystems.

    The app has earned a 4.6-to-4.8-star rating on Apple’s App Store, based on more than 14,000 reviews. On Google Play, it holds a 4.7 rating and has surpassed one million installs.

    Fomo Benefits From Robinhood Chain’s Growth

    Fomo’s expansion is closely linked to growing interest in Robinhood Chain, the brokerage’s layer-2 network. The network launched its public mainnet on July 1 and has since become one of the most closely watched efforts to bring retail trading onchain.

    Fomo is one of several consumer-focused apps seeking to capture activity on the network. Its growth forms part of a broader wave of “social trading” products built around the idea that following friends, rather than studying charts, can encourage casual users to place their first trades.

    Industry observers increasingly view apps such as Fomo as accessible entry points for a new and less experienced generation of retail traders—the same audience that helped Robinhood build its stock-trading business.

    Source: cryptonews.net

  • Gemini Wins Arbitration Over Gemini Earn Collapse as Court Finds No Misleading Conduct

    Gemini Wins Arbitration Over Gemini Earn Collapse as Court Finds No Misleading Conduct

    Cryptocurrency exchange Gemini has won an arbitration case brought by a customer over the collapse of its Gemini Earn lending program, according to a CNBC report. The arbitrator found insufficient evidence that Gemini misled customers or failed to perform adequate due diligence on Genesis Global Capital, its primary lending partner.

    How the Gemini Earn Collapse Happened

    Launched in early 2021, Gemini Earn allowed users to lend their cryptocurrency to institutional borrowers through Genesis Global Capital in exchange for interest. The program expanded quickly and attracted hundreds of thousands of customers.

    In November 2022, Gemini suspended withdrawals from Earn after Genesis experienced a liquidity crisis triggered by the collapse of FTX and broader turmoil in the cryptocurrency market.

    Genesis filed for bankruptcy in January 2023, leaving Earn users unable to access their funds. Gemini, which had promoted the product as a low-risk investment, faced significant criticism from customers and regulators. The U.S. Securities and Exchange Commission charged Gemini and Genesis in early 2023 with offering unregistered securities through the Earn program.

    What the Arbitration Ruling Decided

    The full arbitration ruling has not been made public. However, the decision found that Gemini did not breach its obligations to the customer who brought the case.

    The arbitrator also determined that Gemini had not misrepresented the risks of Gemini Earn and had taken reasonable steps to evaluate Genesis as a lending partner.

    The decision differs from earlier regulatory action. In 2024, Gemini agreed to pay a $5 million penalty to the SEC to settle charges related to the Earn program. Although the arbitration outcome could influence how other customer claims are considered, it does not establish a binding legal precedent in court.

    Gemini Earn Users Recover Most Assets

    Despite the legal disputes surrounding the program, Gemini Earn users have recovered most of their funds. In 2024, Gemini distributed cryptocurrency worth approximately $2.18 billion to Earn users, representing about 97% of the assets owed.

    The recovery followed a settlement agreement involving Gemini, Genesis and other creditors during Genesis’s bankruptcy proceedings. Gemini said distributing the assets was a priority and that it worked to return users’ cryptocurrency in kind rather than in cash to help preserve its value.

    The remaining 3% of assets remains subject to ongoing bankruptcy proceedings. Even so, the recovery rate is high compared with those seen in many other cryptocurrency bankruptcy cases.

    Why the Gemini Arbitration Ruling Matters

    The ruling highlights the legal responsibilities of cryptocurrency platforms that offer lending products through third-party partners. It indicates that partnering with an outside lender does not automatically make a platform liable for that lender’s failures when the platform has carried out adequate due diligence.

    For investors, the case reinforces the risks associated with crypto lending products, including those promoted by established cryptocurrency exchanges. The decision could also influence ongoing litigation and regulatory discussions by providing a basis for assessing due diligence standards in the crypto lending industry.

    However, the ruling applies only to the specific case. It does not remove the broader regulatory scrutiny facing Gemini and other cryptocurrency platforms.

    Frequently Asked Questions

    What was Gemini Earn?

    Gemini Earn was a cryptocurrency lending service that allowed users to earn interest on digital assets by lending them to institutional borrowers, primarily through Genesis Global Capital. The program launched in early 2021, and Gemini suspended withdrawals in November 2022.

    What did the Gemini arbitration ruling decide?

    The arbitrator found insufficient evidence that Gemini misled customers or failed to conduct adequate due diligence on Genesis. The decision favored Gemini in a case brought by one customer, but it does not create a legal precedent for other claims.

    How much did Gemini Earn users recover?

    Gemini distributed approximately $2.18 billion worth of cryptocurrency to Earn users in 2024. The distribution covered about 97% of the assets owed, while the remaining 3% remains connected to ongoing bankruptcy proceedings.

    Related Reading

    • South Korea mulls new statutory crypto body to take over DAXA functions
    • California Legislature Passes Bill to Ban Public Officials from Issuing Memecoins
    • Polymarket US Moves to Launch Bitcoin, Ethereum, and Solana Event Contracts on CFTC-Approved Platform
    • CFTC Flags Crypto ATM Risks as FBI Data Shows Scam Losses Nearly Double
    • Google’s Gemini has a branding problem, and so does the rest of AI
  • Seeker Price Prediction: SKR Open Interest Surges as September Breakout Looms

    Seeker Price Prediction: SKR Open Interest Surges as September Breakout Looms

    Seeker Price Prediction for September: Can $SKR Sustain Its Breakout?

    Seeker ($SKR) entered September with strong momentum after a sharp rally lifted the token well above its key moving averages. $SKR rose 116.70% over 24 hours and gained 274.50% over the previous week.

    The rally pushed Seeker’s price toward $0.0353 before traders began taking profits. As a result, $SKR now faces a critical test as buyers attempt to extend the breakout.

    $SKR Breakout Faces Profit-Taking

    $SKR traded near $0.02833 on August 31, while daily trading volume reached approximately $306 million. The token’s market capitalization is now close to $197 million. However, the rapid advance has also increased the risk of sharp price swings.

    On the four-hour chart, $SKR made a decisive move from the $0.01 area toward $0.0353. The token subsequently pulled back toward $0.0274 as traders secured profits. Despite that decline, the broader price structure remains strongly bullish.

    Seeker Price Dynamics (Source: TradingView)

    Seeker is also trading well above its 20-, 50-, and 100-period EMAs, which currently stand near $0.01634, $0.01213, and $0.01055, respectively. The underlying trend therefore continues to favor buyers unless $SKR loses its breakout support levels.

    The DMI also remains bullish, with buying pressure exceeding selling pressure. Nevertheless, traders should expect increased volatility following such an aggressive rally.

    Key Seeker Price Levels to Watch in September

    Open Interest Signals Rising Speculation

    Conditions in the derivatives market provide another important signal for Seeker’s September outlook. Open interest remained relatively stable throughout May and June before falling toward $6 million.

    The metric then moved sideways between approximately $5 million and $7 million during July and August. That pattern changed significantly on August 31.

    Source: Coinglass

    Open interest surged to $54.58 million as $SKR approached $0.024. The rapid increase suggests that traders opened substantially more leveraged positions.

    Higher open interest can magnify both gains and losses. Therefore, $SKR may experience larger price movements if traders begin unwinding crowded positions.

    Spot Flows Add a Warning Signal

    Spot market flows present a more cautious outlook. $SKR recorded heavy outflows during the January and February decline, with some individual readings exceeding $6 million.

    Source: Coinglass

    Flows largely stabilized from mid-February onward, with activity remaining close to neutral through much of March and August.

    However, the latest reading showed an outflow of approximately $987,670 on August 31. This suggests renewed selling pressure as Seeker enters September.

    Consequently, buyers will need strong spot demand to support another breakout. Without that demand, the token’s elevated leveraged positioning could make any correction more severe.

    Technical Outlook for Seeker Price

    Seeker’s key technical levels remain clearly defined heading into September.

    Upside levels: $0.02919 and $0.03528 are the immediate resistance levels. A decisive move above $0.03528 could open the way toward fresh highs if bullish momentum continues to expand.

    Downside levels: $0.02441 is the first major support, followed by $0.02105. A deeper support zone sits between $0.01770 and $0.01634, where the 20-day EMA offers additional technical backing.

    Will Seeker Go Up?

    Seeker’s September outlook depends largely on whether buyers can defend $0.02441 after the token’s explosive rally. A sustained recovery above $0.02919 would strengthen the bullish structure and bring $0.03528 back into focus.

    At the same time, the increase in open interest to $54.58 million points to heavier speculative positioning and could amplify volatility. The latest spot outflow of approximately $987,670 also adds a cautionary signal.

    For now, $SKR remains in a high-volatility breakout phase. Stronger spot demand and sustained momentum could support another move toward $0.03528 and beyond. Conversely, a loss of $0.02441 could trigger a deeper retracement toward $0.02105 and the $0.01770–$0.01634 support zone.

  • BOOK OF MEME Crypto Faces Timeframe Tug-of-War as Market Cap Falls 2.54%

    BOOK OF MEME Crypto Faces Timeframe Tug-of-War as Market Cap Falls 2.54%

    As of August 31, 2026, the BOOK OF $MEME crypto market is showing mixed signals as the broader digital-asset market loses momentum. Total crypto market capitalization has fallen 2.54% to approximately $2.63 trillion, while the Fear & Greed Index remains at 62, indicating Greed.

    Key takeaways:

    • $BOME’s daily RSI14 stands at 51.11, indicating neutral momentum and no clear higher-timeframe direction.
    • The hourly RSI14 is 34.14, reflecting bearish intraday pressure that diverges from the neutral daily trend.
    • Bitcoin dominance has risen to 59.74%, suggesting capital is rotating away from higher-beta assets such as $BOME.
    • The broader market’s decline, combined with still-greedy sentiment, creates a challenging backdrop for meme tokens.

    BOOK OF $MEME Multi-Timeframe Analysis

    The multi-timeframe outlook for $BOME shows a clear split between neutral daily momentum and bearish intraday conditions. No single timeframe currently provides a decisive directional signal.

    On the daily chart, BOOK OF $MEME’s RSI14 is 51.11, near the midpoint of the momentum range. This reading indicates that buying and selling pressure are broadly balanced, with the daily market regime classified as neutral rather than bullish or bearish. Such equilibrium often suggests that an asset is consolidating after a previous move and awaiting a fresh catalyst.

    The 1-hour chart presents a notably weaker picture. Its RSI14 is 34.14, and the regime is bearish. The gap between the daily and hourly readings indicates that short-term momentum has deteriorated even though the broader chart has not yet confirmed a downtrend. If hourly weakness continues, the current daily neutrality could eventually resolve to the downside.

    The 15-minute chart adds context without confirming an outright breakdown. Its RSI14 is 46.54, reflecting soft, slightly bearish momentum while remaining well above oversold levels. Selling pressure therefore does not appear exhausted, but neither does it suggest panic. A short-term bounce remains possible before the hourly trend establishes a clearer direction.

    Bullish Scenario for $BOME

    The bullish scenario would strengthen if the hourly weakness proves temporary and RSI14 recovers above 50. A shift in the 1-hour regime from bearish to neutral or bullish would align short-term momentum with the daily chart’s neutral bias and could allow $BOME to benefit from renewed risk appetite.

    This possibility is supported by the Fear & Greed Index remaining at 62 in Greed territory, indicating that market sentiment has not fully reflected the recent decline in total crypto market capitalization. A recovery in short-term momentum alongside that sentiment backdrop could support a relief move in meme-sector tokens.

    The bullish view would be invalidated if 1-hour RSI continues falling toward oversold territory below 30 while the chart records fresh lower highs.

    Bearish Scenario for $BOME

    The bearish scenario would gain credibility if hourly selling pressure spreads to the daily chart and changes its regime from neutral to bearish. A decline in daily RSI14 from 51.11 through the 50 threshold would suggest that the weakness currently visible on the 1-hour and 15-minute charts is becoming a broader trend rather than a short-term test of support.

    The macroeconomic backdrop adds weight to this risk. Total crypto market capitalization is down 2.54%, and rising Bitcoin dominance points to capital moving away from higher-beta assets. Historically, this type of market environment can weigh disproportionately on meme coins and other speculative tokens.

    The bearish outlook would weaken if daily RSI remains above 50 and the 1-hour chart stabilizes with a sustained recovery in momentum rather than a brief rebound.

    Positioning and Risk

    $BOME currently presents a two-sided setup without a clear directional advantage. The daily chart supports a wait-and-see approach, the hourly chart signals caution, and the 15-minute chart shows limited immediate panic but no meaningful strength.

    The broader market is losing value even as sentiment remains in Greed territory, creating conditions in which volatility could move sharply in either direction. The key question is whether daily neutrality or hourly weakness resolves first.

    Elevated activity across decentralized exchanges, including sharp single-day changes in fee generation among major DEXs, also indicates that on-chain trading conditions remain unstable across the market and are not limited to $BOME. Traders monitoring the token should remain flexible rather than assume that either the bullish or bearish scenario has been confirmed.

    FAQ

    What is $BOME’s current RSI on the daily chart?

    $BOME’s daily RSI14 is 51.11 as of August 31, 2026. The reading is near the midpoint of the momentum range and places the daily regime in neutral territory, meaning neither buyers nor sellers have a clear advantage on the highest timeframe.

    Is the hourly trend for $BOME bullish or bearish?

    The 1-hour chart is bearish, with RSI14 at 34.14 and the regime classified accordingly. However, the daily chart remains neutral, so the intraday weakness has not yet been confirmed as a broader downtrend. This divergence is the central feature of the current $BOME setup.

    What macro factors are influencing $BOME’s price action?

    Total crypto market capitalization has declined 2.54% to approximately $2.63 trillion, while Bitcoin dominance has increased to 59.74%, indicating a rotation away from higher-beta assets. Meanwhile, the Fear & Greed Index remains at 62 in Greed territory. This mismatch suggests that sentiment has not fully adjusted to the market pullback and could create additional headwinds for meme tokens such as $BOME.

    Disclaimer: This article is for informational purposes only and does not constitute financial advice, an investment recommendation, or a solicitation to buy or sell any financial instrument or cryptocurrency. The analysis provided is not indicative of future results. Investing in crypto assets and financial markets carries a high risk of capital loss. Always do your own research (DYOR) and consult a qualified financial advisor before making any decision.

    Article produced with the assistance of artificial intelligence and reviewed by the editorial team.

    Source: cryptonews.net

  • Tether CEO Slams BIS Push for Tokenized Bank Deposits

    Tether CEO Slams BIS Push for Tokenized Bank Deposits

    The debate over how to represent fiat money onchain is intensifying, with Tether CEO Paolo Ardoino challenging the Bank for International Settlements’ (BIS) preference for tokenized bank deposits over stablecoins.

    Ardoino criticized recent comments from Pablo Hernandez de Cos, general manager of the BIS, who argued that stablecoins are not an effective substitute for fiat money. De Cos cited concerns including limited redeemability, supply constraints, interoperability challenges and the potential facilitation of crime.

    Instead, De Cos described tokenized bank deposits as a “more direct path to harness ​tokenisation while preserving the monetary system’s foundations.”

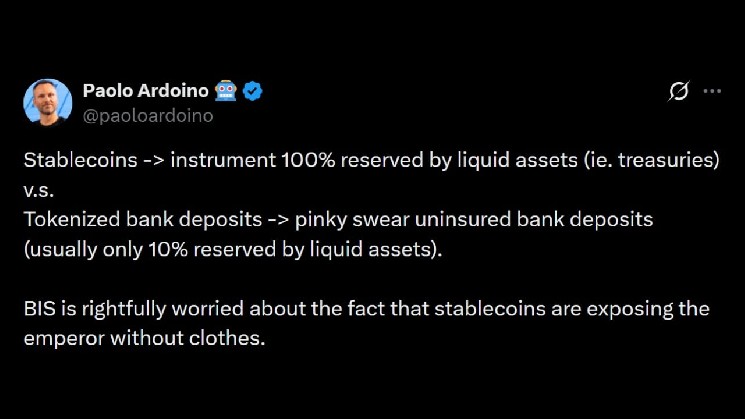
    Ardoino argued that the BIS’s concerns overlook what he views as a key distinction between the two forms of digital money. He said stablecoins are generally backed almost entirely by U.S. Treasury securities, while tokenized bank deposits are typically backed by only around 10% in liquid assets.

    “BIS is rightfully worried about the fact that stablecoins are exposing the emperor without clothes. Why someone should choose to put his savings into a fractional reserve product while stablecoins are fully reserved?” Ardoino declared.

    Stablecoin adoption expands in emerging markets

    Stablecoins have continued to gain popularity and adoption. Tether’s $USDT, with a market capitalization of more than $183 billion at the time of writing, has become an important financial product in emerging markets.

    Ardoino said there were economies “heavily relying on $USDT, for both internal and foreign commerce.”

    Stablecoins become a U.S. policy flashpoint

    The debate over stablecoins has also reached the highest levels of U.S. politics, becoming a contentious issue in discussions over the Digital Asset Market Clarity Act, known as the CLARITY ACT.

    Banks have raised concerns about deposit flight if cryptocurrency exchanges are permitted to offer rewards on stablecoin holdings. Ardoino suggested that broader awareness of stablecoin reserves could accelerate a shift away from traditional bank deposits.

    “What happens to financial system if people start realizing that stablecoins are safer and move their savings into the better asset class? We’re in the Find Out phase.” Ardoino concluded, hinting at large-scale deposits-for-stablecoins substitution.

  • Bitcoin Holds Above $78K as U.S.–Iran Clash Pushes Oil Prices Higher

    Bitcoin Holds Above $78K as U.S.–Iran Clash Pushes Oil Prices Higher

    Bitcoin traded near $77,900 on Aug. 31 as renewed fighting between the United States and Iran pushed oil prices higher and pressured global equity markets. The cryptocurrency remained relatively stable despite sharp moves across energy, bond and stock markets after U.S. strikes on Iran’s Larak Island.

    Bitcoin holds near $78,000 as oil prices climb

    Bitcoin was down approximately 0.4% over 24 hours after trading between $77,162 and $79,343. The limited move contrasted with a stronger reaction in other markets following the strikes.

    An unnamed U.S. official confirmed that American forces targeted two Iranian rocket launchers. According to Reuters, the official claimed Iran’s Islamic Revolutionary Guard Corps was preparing rockets carrying sea mines for deployment in the Strait of Hormuz.

    Iran said the attack killed and wounded soldiers and civilians. The Revolutionary Guards promised a “response and punishment,” but did not immediately provide casualty figures or details of further action.

    Brent crude climbed approximately 2.7% to $90.51 per barrel during Monday’s Asian session. West Texas Intermediate traded near $85.23 after gaining more than 2%.

    The oil price increases reflected renewed concern about shipping through the Strait of Hormuz, a key route for global oil and liquefied natural gas movements. Military activity near the waterway can therefore affect energy prices and inflation expectations.

    Asian equities declined, while Nasdaq 100 futures fell between 0.5% and 0.7% across early market readings. Gold also failed to attract sustained safe-haven demand, falling approximately 0.8% to around $4,418 per ounce in the cited market snapshot.

    Bitcoin remained close to $78,000. Its stability does not prove that $BTC has permanently become a geopolitical hedge, but it shows that the latest escalation did not trigger the immediate cryptocurrency sell-off seen during some earlier risk events.

    Bitcoin’s daily chart also pointed to short-term strength. $BTC traded near $78,084, comfortably above the Bollinger Bands’ $72,471 midpoint but below the $86,255 upper band. The bands widened after the latest rally, indicating higher volatility.

    The relative strength index stood at 69.91, just below overbought territory, after recently crossing 70. The reading reflects strong momentum but also leaves Bitcoin vulnerable to consolidation. Daily volume of about 4,200 $BTC remained below the initial breakout spike, suggesting buyers may need stronger participation to challenge $80,000.

    Bitcoin ($BTC) price chart, source: crypto.news

    Bitcoin also held above $62,000 during July’s U.S.–Iran strikes, even as oil, bonds and Asian stocks recorded larger moves.

    Bitcoin outperformed gold and Nasdaq in August

    Bitcoin gained approximately 23% during August, compared with reported advances of 9% for gold and 4% for the Nasdaq. The cryptocurrency was therefore the strongest performer among the three assets over the month.

    The broader crypto market showed less resilience on Monday. XRP declined approximately 0.8%, while Solana lost around 0.6%. Ether traded near $1,625 as traders reduced exposure to several major altcoins.

    Part of Bitcoin’s monthly performance followed renewed institutional demand through U.S. spot exchange-traded funds. The products accumulated approximately $2.8 billion across eight consecutive inflow sessions during the recovery from Bitcoin’s August lows.

    The streak ended on Friday. U.S. spot Bitcoin ETFs recorded an estimated $201.9 million in net outflows on Aug. 28, according to Farside. The reversal indicates that ETF demand should not be characterized as uninterrupted.

    Bitcoin’s rally from approximately $63,500 had previously been supported by eight consecutive ETF inflow sessions, although declining futures exposure indicated that leverage was not the only source of demand.

    Federal Reserve policy adds uncertainty to Bitcoin’s outlook

    The geopolitical escalation followed Federal Reserve Chair Kevin Warsh’s restrictive policy message at the Jackson Hole symposium on Aug. 28.

    Warsh said inflation remained too high, while labor markets were stable and economic output was solid. According to his published remarks, he said most Federal Open Market Committee members preferred to await more information before deciding whether another policy change was appropriate.

    Markets interpreted the speech as increasing the possibility of another interest-rate rise. Fed funds futures placed the probability of a September increase near 57% to 60%, up from approximately 35% before the address. The estimate represents market pricing rather than a Federal Reserve commitment.

    Higher oil prices could further complicate the outlook. Sustained energy price increases can raise transportation and production costs, making it more difficult for inflation to return toward the Federal Reserve’s 2% objective.

    Sept. 4 jobs report is the next major Bitcoin catalyst

    The next major U.S. market catalyst is the August employment report, scheduled for Sept. 4 at 8:30 a.m. ET, according to the Bureau of Labor Statistics calendar.

    Strong employment data could reinforce expectations for tighter monetary policy. A weaker report could reduce rate-hike forecasts, although the market response would also depend on wage growth and unemployment.

    Bitcoin’s immediate technical range remains between support around $77,000 and resistance extending from approximately $79,400 to $80,800. These levels are market observations rather than guaranteed reversal points.

    The durability of Bitcoin’s relative strength will depend on whether it remains stable if oil prices continue rising, equity losses deepen or interest-rate expectations move higher. ETF flows and the Sept. 4 labor report will provide the next evidence.


  • Court Orders YouTuber Choi to Repay Full Investment in Golden Goal Coin Civil Case

    Court Orders YouTuber Choi to Repay Full Investment in Golden Goal Coin Civil Case

    South Korean Court Orders YouTuber Choi Seung-jung to Repay 20 Million Won in Golden Goal Coin Case

    A South Korean court has ordered YouTuber Choi Seung-jung to repay a victim’s full 20 million won investment, plus interest, in a civil lawsuit linked to the Golden Goal coin case, according to an exclusive JTBC report.

    The ruling, issued in February, represents a significant legal setback for Choi, who is also facing criminal fraud charges involving tens of billions of won.

    Details of the Golden Goal Coin Civil Lawsuit

    The victim invested 20 million won in 2021 after Choi allegedly promised to protect the principal and secure a cryptocurrency exchange listing. Neither the listing nor a refund materialized, prompting the victim to file a damages lawsuit last year.

    During the civil proceedings, Choi reportedly argued that he was also a victim of the scheme. The court rejected that defense and ordered him to repay the investment in full, along with interest.

    Legal experts say the ruling could have wider implications for other investors seeking compensation. Hong Pureun, managing partner at Descent Law Office, said the judgment is being used as favorable evidence in other ongoing lawsuits against Choi.

    The decision could therefore help other defrauded investors pursue compensation by strengthening claims related to Choi’s alleged conduct.

    Criminal Fraud Trial and Concerns Over Choi’s Assets

    Choi’s legal problems extend beyond the civil case. He has been indicted on allegations of fraud involving tens of billions of won, and his criminal trial is ongoing.

    One Golden Goal coin victim has raised concerns that Choi may have already moved substantial funds after asset checks reportedly found nothing. The issue has created uncertainty over whether victims will actually be able to recover their investments, even if they win their lawsuits.

    The next hearing in Choi’s criminal case is scheduled for October 23. The outcome of both the civil and criminal proceedings will be closely watched by South Korea’s cryptocurrency community, where investor protection has become a major concern following several high-profile fraud cases.

    What the Ruling Means for Cryptocurrency Investors

    The case highlights the risks of cryptocurrency investments promoted by influencers and social media personalities. It also reinforces the legal risks associated with claims involving guaranteed returns, principal protection or promised exchange listings.

    For victims of similar schemes, the civil judgment offers a potential legal path to compensation. However, the reported concerns about Choi’s assets show that winning a lawsuit does not necessarily guarantee the immediate recovery of funds.

    Investors should conduct thorough due diligence before relying on investment advice from online personalities, particularly when an opportunity includes promises of guaranteed returns or a rapid cryptocurrency exchange listing.

    Frequently Asked Questions

    What is the Golden Goal coin case?

    The Golden Goal coin case involves allegations of fraud against YouTuber Choi Seung-jung and others. They reportedly solicited investments in a cryptocurrency called Golden Goal coin while promising high returns and exchange listings that never materialized. The allegations have led to both civil and criminal proceedings.

    Can other victims use the civil ruling in their lawsuits?

    According to legal experts, the ruling is being used as favorable evidence in other ongoing lawsuits against Choi. It may help establish a pattern of allegedly misleading conduct and support other victims’ claims.

    What should investors do if they suspect cryptocurrency fraud?

    Investors who suspect fraud should preserve all communications and transaction records, report the matter to financial regulators or law enforcement, and consider seeking legal advice. They should also be cautious about investment opportunities that guarantee returns or promise quick exchange listings.

    Related Reading

    • South Korean crypto exchanges delist hundreds of altcoins, raising investor loss concerns
    • South Korea’s Industrial Output Growth Slows to 3.6% in July as Manufacturing Cools
    • Upbit Won Deposits Drop 36% to $1.5B as Customer Idle Funds Leave Exchange
    • Korbit to Cover Harmony Token Shortfall After Security Incident
    • South Korean Won Gains Support from BoK Tightening, Says Commerzbank