Tag: Treasury yields

  • Bond Volatility Surges While Bitcoin and Wall Street Remain Calm

    Bond Volatility Surges While Bitcoin and Wall Street Remain Calm

    Key Highlights

    • The U.S. 10-year Treasury yield briefly touched 5.2% on Thursday before settling at 5.163%, driven by Middle East conflict pushing oil and diesel prices higher and complicating the global inflation outlook.
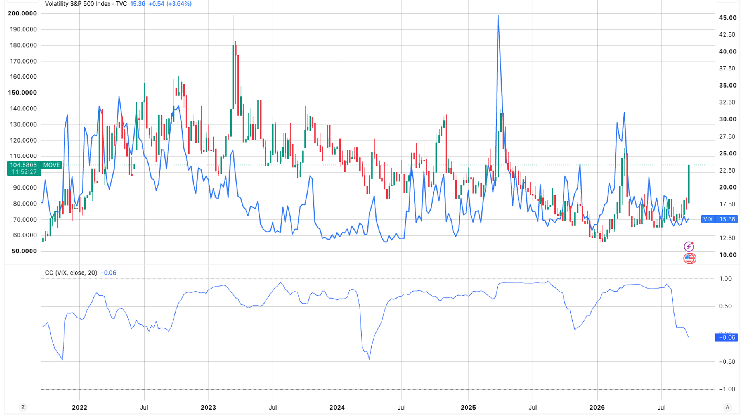
    • The ICE BofA MOVE Index ($MOVE) shows bond traders are paying significantly more for interest-rate volatility protection despite the S&P 500 rising roughly 21% since March when $MOVE was last at similar levels.
    • The 20-day correlation between the VIX and $MOVE turned negative (-0.06) for the first time since April 2024, while the BVIV-$MOVE correlation sits at -0.37, indicating a historic divergence between equity and bond volatility expectations as Bitcoin’s implied volatility hovers near yearly lows.

    Global Bond Yields Surge Amid Middle East Tensions

    A broad-based climb in government bond yields is rippling through global markets this week, with the benchmark U.S. 10-year Treasury yield briefly piercing the 5.2% threshold on Thursday before retreating slightly to 5.163%. The selloff in fixed income comes as the widening conflict in the Middle East drives crude oil and diesel prices higher, injecting fresh uncertainty into the inflation outlook and prompting traders to reassess how much further major central banks may need to tighten monetary policy. The move underscores the fragile nature of the disinflation narrative that had previously anchored market expectations for rate cuts.

    MOVE Index Signals Rising Rate Volatility Premium

    The ICE BofA MOVE Index, a widely watched gauge of expected volatility in U.S. Treasury markets, has climbed to levels last seen in March. However, the equity market backdrop has shifted dramatically: the S&P 500 stood near 6,350 when $MOVE previously traded at this level, but the index has since surged to 7,704, a gain of approximately 21%. This divergence highlights a critical shift—bond traders are now paying a considerably higher premium for protection against interest-rate swings even as equity markets rally, suggesting fixed-income participants see risks that stock investors are currently disregarding.

    Correlation Breakdown Between Asset Class Volatility

    The structural relationship between equity and bond volatility measures is showing signs of fracture. Over a 20-day rolling window, the correlation between the Cboe Volatility Index (VIX) and the MOVE Index has slipped to -0.06, turning negative for the first time since April 2024, though the reading remains statistically close to zero. The correlation between the Cboe Bitcoin Volatility Index (BVIV) and $MOVE is more distinctly negative at -0.37, marking one of its lowest readings in years. This decoupling occurs as bond volatility rises while Bitcoin’s expected volatility remains anchored near its yearly low, a dynamic that challenges traditional cross-asset hedging assumptions.

    Bitcoin’s Detachment from Yield Narrative

    Adding to the complexity, recent analysis from CoinDesk indicates that rising yields alone have demonstrated little consistent relationship with Bitcoin’s returns. The cryptocurrency’s implied volatility, as measured by BVIV, has failed to respond to the spike in rate volatility, remaining near annual lows. This suggests that Bitcoin is currently trading on idiosyncratic drivers—such as ETF flow dynamics and regulatory developments—rather than macroeconomic interest-rate sensitivity, further isolating the digital asset from traditional fixed-income turbulence.

    Why This Matters

    The simultaneous rise in bond yields and volatility premiums, coupled with a breakdown in cross-asset correlations, signals a potential regime shift for multi-asset portfolios. For institutional investors, the negative VIX-MOVE correlation undermines the traditional negative equity-bond correlation that has underpinned 60/40 portfolio construction for decades. The fact that Bitcoin volatility remains suppressed while rate volatility spikes suggests the asset is not currently functioning as a macro hedge against inflation or rate uncertainty. Market participants should monitor whether the $MOVE index sustains these elevated levels, as persistent bond volatility could force a repricing of risk assets broadly, including equities and digital assets, particularly if the Federal Reserve signals a higher-for-longer rate stance in response to energy-driven inflation pressures.

    Frequently Asked Questions

    What is the MOVE Index and why is it important?

    The ICE BofA MOVE Index ($MOVE) measures the implied volatility of U.S. Treasury securities across the 2-, 5-, 10-, and 30-year maturities. It serves as the bond market’s equivalent of the VIX, reflecting how much traders are paying to hedge against interest-rate swings. A rising $MOVE indicates growing uncertainty about the path of monetary policy and inflation.

    Why has the correlation between VIX and MOVE turned negative?

    The 20-day correlation between the VIX (equity volatility) and MOVE (bond volatility) fell to -0.06, its first negative reading since April 2024. This suggests equity traders are complacent—pricing in a soft landing and continued rally—while bond traders are hedging aggressively against sticky inflation and higher-for-longer rates, creating a rare divergence in risk perception across asset classes.

    Is Bitcoin acting as a hedge against rising yields?

    According to CoinDesk’s analysis, rising yields alone have shown little consistent relationship with Bitcoin’s returns. Currently, Bitcoin’s implied volatility (BVIV) is near yearly lows while bond volatility ($MOVE) spikes, and the BVIV-MOVE correlation sits at -0.37. This indicates Bitcoin is not currently functioning as a macro hedge against interest-rate volatility.
  • XRP Faces 1522% Liquidation Imbalance as Market Selloff Catches Bulls Off Guard

    XRP Faces 1522% Liquidation Imbalance as Market Selloff Catches Bulls Off Guard

    Key Highlights

    • XRP plunged 8.18% in 24 hours after a failed breakout above $1.65, triggering a 1,522% long-liquidation imbalance totaling $29.54 million.
    • The selloff coincided with broader crypto market declines driven by surging Treasury yields and renewed Federal Reserve rate-hike expectations.
    • On-chain data from Santiment shows XRP’s 365-day MVRV at -11.75%, signaling long-term holders remain deeply underwater and historically suggesting reduced downside risk.

    XRP Selloff Wipes Out Leveraged Longs After Failed $1.65 Breakout

    XRP suffered a sharp reversal on Thursday after a week-long rally collapsed under heavy profit-taking and macroeconomic pressure. The token, which had climbed from a September 16 low of $1.24 to a local high of $1.65 on September 23—marking six green days out of eight and forming its first daily-chart golden cross of 2024—surrendered those gains in a matter of hours. At the time of writing, XRP traded near $1.45, down 8.18% over the previous 24 hours. The sudden drop caught leveraged bulls off guard, triggering $29.54 million in long liquidations against just $1.94 million in shorts, a staggering 1,522% imbalance that underscored the one-sided positioning ahead of the reversal.

    Macro Headwinds Amplify Crypto-Wide Profit Taking

    The XRP decline did not occur in isolation. Across the digital asset sector, a broad-based selloff liquidated approximately $610 million in positions over the past day as traders reduced risk exposure. The catalyst stemmed from traditional markets: U.S. Treasury yields climbed to multi-decade highs after fresh economic data strengthened the case for additional Federal Reserve tightening. Futures markets now price in a greater than 75% probability that the Federal Open Market Committee will raise rates again at its October meeting. Reinforcing that view, New York Federal Reserve President John Williams stated in London on Thursday that it would be “reasonable” to expect another interest rate hike by year-end. The hawkish rhetoric pressured risk assets globally, with crypto markets among the most sensitive to shifting rate expectations.

    On-Chain MVRV Metric Suggests Limited Downside for Long-Term Holders

    Despite the near-term technical damage, on-chain analytics platform Santiment highlights a potentially constructive longer-term setup. XRP’s 365-day Market Value to Realized Value (MVRV) ratio sits at approximately -11.75%, indicating that the average holder who acquired the asset over the past year is sitting on an unrealized loss. Historically, deeply negative MVRV readings have coincided with periods of reduced selling pressure, since fewer participants are in profit and motivated to exit. Santiment notes that “buying during that pain has historically offered better long-term setups,” implying that the current discount could represent accumulation territory if demand fundamentals improve.

    Why This Matters

    The episode illustrates how crypto markets remain tightly coupled to Federal Reserve policy expectations, with even technically bullish structures—such as XRP’s golden cross—vulnerable to abrupt macro-driven reversals. The extreme long-liquidation imbalance reveals excessive leverage on the long side, a condition that often precedes short-term volatility but can also flush out weak hands, resetting the derivatives market for a cleaner trend. Meanwhile, the deeply negative long-term MVRV provides a rare on-chain signal that long-term holders are not sitting on large paper profits, reducing the likelihood of sustained distribution from that cohort. Market participants will now watch whether XRP can reclaim the $1.55-$1.60 zone as support and whether upcoming Fed communications validate or dispel the October rate-hike narrative.

    Frequently Asked Questions

    What caused XRP’s 8% drop in 24 hours?
    A failed breakout above $1.65 triggered cascading long liquidations totaling $29.54 million, amplified by a broad crypto selloff driven by surging Treasury yields and renewed Fed rate-hike expectations.
    What does the 1,522% liquidation imbalance indicate?
    It shows that leveraged traders were overwhelmingly positioned long ahead of the reversal, with $29.54 million in longs liquidated versus only $1.94 million in shorts, reflecting one-sided bullish positioning that exacerbated the downside move.
    Is XRP oversold based on on-chain data?
    Santiment’s 365-day MVRV of -11.75% suggests long-term holders are deeply underwater, a condition historically associated with reduced selling pressure and improved long-term risk/reward, though it does not guarantee an immediate rebound.
  • Bitcoin Faces 2022 Parallels as Federal Reserve Resumes Rate Hikes

    Bitcoin Faces 2022 Parallels as Federal Reserve Resumes Rate Hikes

    Bitcoin Bear Market Nears One-Year Mark as Fed Rate Hikes and Energy Shock Cloud Outlook

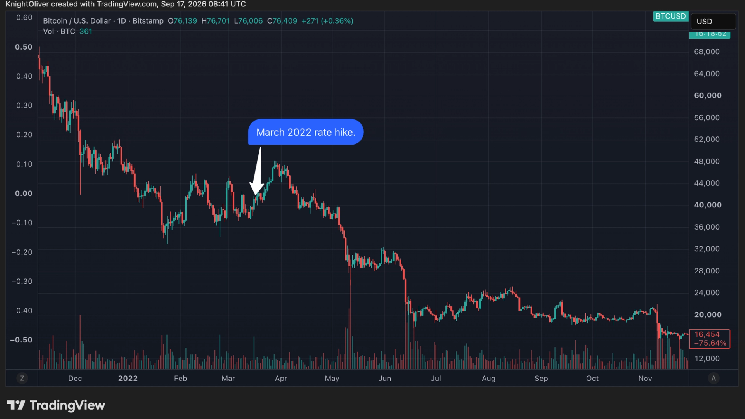
    Bitcoin’s prolonged downturn is approaching the one-year milestone, raising questions about whether a new Federal Reserve rate-hiking cycle could extend the crypto winter. The market’s recent behavior echoes the aftermath of the Fed’s initial March 2022 hike, when bitcoin rallied roughly 18% over 12 days before plummeting around 50%. That pattern suggests any near-term relief rally may give way to further losses, though a single comparable cycle offers limited predictive evidence.

    Inflation Progress Meets Fresh Energy Shock

    The Federal Reserve’s decision to raise rates on Wednesday stemmed from persistent inflation pressures. Annual headline inflation has remained above the 2% target for over five years. However, core inflation — which excludes volatile food and energy components — has eased to 2.4%, its lowest level in five years, signaling meaningful progress.

    That progress now faces a significant headwind. Escalating geopolitical tensions in the Middle East have propelled both West Texas Intermediate and Brent crude oil prices well above $100 per barrel. The surge threatens to reignite inflationary pressures and squeeze economic growth simultaneously.

    Rising Yields Amplify Pressure on Risk Assets

    Global bond yields have climbed in response, with the benchmark U.S. 10-year Treasury yield reaching 5%. The move tightens financial conditions further and adds downward pressure on risk assets, including cryptocurrencies. Bitcoin’s 2022 decline coincided with broad-based losses across equities, bonds, and metals, alongside internal turmoil within the crypto industry — a correlation that underscores its sensitivity to macroeconomic liquidity cycles.

    Key Question for Crypto Markets

    With the bear market nearing its first anniversary, market participants are weighing whether the current tightening cycle — compounded by an energy-driven inflation resurgence — will prolong the downturn or if the asset class has already priced in the worst of the macroeconomic storm.

  • Gold Draws $500B Amid Rising Yields, Threatening Bitcoin’s Dominance

    Gold Draws $500B Amid Rising Yields, Threatening Bitcoin’s Dominance

    Gold Defies Rising Yields as Central Bank Demand Reshapes Market Dynamics

    While precious metals show bearish technical signals on the charts, fundamental data reveals a striking divergence: gold has risen nearly 15% since late June even as the 10-year U.S. Treasury yield jumped almost 20% over the same period. This breakdown of the traditional inverse relationship between gold and yields suggests structural demand shifts are overriding rate sensitivity.

    Central Banks Drive Gold’s Yield Insensitivity

    According to TradingEconomics data, the 10-year Treasury yield surged approximately 20% from late June through the current quarter. Historically, such a move would pressure gold lower. Instead, gold advanced nearly 15% during the same window.

    The primary catalyst appears to be sustained central bank purchasing, which has weakened gold’s typical correlation with monetary policy expectations. Analysts observe that this institutional demand floor is “shifting the precious metal’s yield-sensitive dynamics and providing support to the metal despite high yields.”

    Record ETF Inflows Signal Persistent Appetite

    Chinese gold ETFs added 11 tonnes in August, marking the second consecutive monthly increase and bringing total holdings to 293 tonnes—the highest level since April and the third-highest on record. Year-to-date, these funds have accumulated 45 tonnes, with early September data indicating continued buying as domestic yields decline and equities weaken.

    Broader positioning data suggests over $500 billion has flowed into gold and silver combined, raising questions about whether metals are attracting fresh capital or diverting it from risk assets such as equities and cryptocurrencies.

    FOMC Positioning and Crypto Implications

    With the Federal Open Market Committee meeting approaching, investors appear to be using gold as a strategic hedge against potential Fed-driven yield volatility rather than a tactical trade. The metal’s resilience contrasts with Bitcoin’s 30% quarterly return, which has captured much of the safe-haven narrative in recent months.

    If yields remain elevated while the dollar weakens, analysts suggest gold could continue drawing capital, potentially creating additional headwinds for risk assets including crypto.

    Key Takeaways

    • Gold has decoupled from rising Treasury yields, gaining ~15% while the 10-year yield rose ~20% since late June.
    • Central bank demand is the primary structural driver, reducing gold’s rate sensitivity.
    • Chinese gold ETFs hold 293 tonnes, a near-record high, with 45 tonnes added year-to-date.
    • Over $500 billion has reportedly entered gold and silver markets.
    • Sustained gold strength could pressure risk assets, including cryptocurrencies, ahead of the FOMC decision.
  • Fed Decision to Determine Gold’s Next Move: XAUUSD Risks $4,355 Rejection or Eyes $4,388 Breakout

    Fed Decision to Determine Gold’s Next Move: XAUUSD Risks $4,355 Rejection or Eyes $4,388 Breakout

    Fed Rate Decision Looms as Key Catalyst for Gold Price Direction

    The Federal Reserve’s September 16 interest rate decision stands as the pivotal event for gold markets this week, with traders closely monitoring XAUUSD for signs of a decisive breakout or rejection following the FOMC announcement. Gold has rebounded from the $4,300 level to trade between $4,335 and $4,345 as markets price in a widely anticipated 25-basis-point rate hike.

    The central question for gold traders centers on whether Fed guidance, U.S. dollar movements, and Treasury yield reactions will push prices below the $4,355 resistance or provide sufficient momentum for a sustained break above $4,388.

    FOMC Meeting Schedule and Market Expectations

    The Federal Reserve’s September 15–16, 2026 FOMC meeting concludes with a policy announcement at 2:00 PM ET on Wednesday, September 16. The release will be followed by the Summary of Economic Projections (SEP), the updated “dot plot,” and a press conference with Chair Kevin Warsh at 2:30 PM ET.

    Markets are assigning approximately a 92% probability to a 25-basis-point rate increase, suggesting the immediate rate decision itself is unlikely to drive significant XAUUSD volatility. Instead, the gold price trajectory after the Fed decision will depend heavily on how the U.S. dollar and Treasury yields respond to the central bank’s forward guidance on the future policy path.

    Why Fed Guidance Drives Gold Price Action

    Gold’s price sensitivity to real interest rates and the U.S. dollar remains the fundamental driver. As a non-yielding asset, gold’s opportunity cost rises when real yields surge and the dollar strengthens. A hawkish surprise from the Fed could push yields higher and firm the dollar, pressuring XAUUSD lower. Conversely, a restrained or “one-and-done” policy message could ease yield and dollar pressures, supporting a relief rally in gold.

    At press time, spot gold was trading at $4,341.50, with traders awaiting either a rejection of the $4,355–$4,388 resistance zone or a move higher. The initial market reaction may involve a liquidity sweep near Monday’s $4,355 peak before a clearer directional move emerges. Key support levels to monitor if gold reverses include $4,304, $4,292, and $4,253.

    Dot Plot and Chair Warsh’s Commentary in Focus

    The updated dot plot will be scrutinized for any indication of a higher median rate path through 2026–2027. If projections signal continued tightening, or if Chair Warsh emphasizes persistent inflation risks and a readiness to hike further, Treasury yields could climb and the dollar could strengthen, creating headwinds for gold. More restrained forecasts, however, could alleviate yield and dollar pressures, allowing XAUUSD to stabilize or recover.

    Resistance Zone Analysis: $4,355–$4,388

    A Fed-driven strengthening of the U.S. dollar or rise in Treasury yields following the announcement could trigger a rejection of XAUUSD from the $4,355–$4,388 resistance zone. A price move above $4,355 that fails to hold above that level would constitute a liquidity sweep rather than a genuine breakout.

    Should rejection occur below $4,355, the resistance zone remains intact and exposes the aforementioned support levels at $4,304, $4,292, and $4,253. However, a sustained break above $4,388 would invalidate the rejection scenario and shift market attention toward the $4,443 target.

    Identifying a Liquidity Sweep vs. True Breakout

    A move above $4,355 signals a liquidity sweep rather than a legitimate gold breakout if XAUUSD quickly falls back below the level. In the event of a Fed-triggered reversal, traders should monitor $4,304, $4,292, and $4,253 as critical XAUUSD support levels.

    Conversely, sustained acceptance above $4,388 would confirm stronger upside momentum and shift the gold price forecast higher, with $4,443 becoming the next technical target. The $4,355 and $4,388 levels therefore represent the critical inflection points for gold prices following the Fed decision.

    Source: TradingView

  • Wall Street Bets on Fed Rate Hike: What It Means for Bitcoin, Bonds, and Trump

    Wall Street Bets on Fed Rate Hike: What It Means for Bitcoin, Bonds, and Trump

    Federal Reserve Poised for First Rate Hike Since 2023 Amid Inflation Pressure

    Wall Street is bracing for the Federal Reserve to raise interest rates on Wednesday, a move that would mark the first increase since 2023. The Federal Open Market Committee concludes its two-day meeting this week, and CME’s FedWatch tool places the probability of a 25-basis-point hike at 94.5%, up from under 50% just a month ago. Such a move would lift the federal funds rate to a range of 3.75%–4% from the current 3.50%–3.75%.

    Wall Street Consensus Shifts Rapidly Toward Tightening

    The shift from unlikely to near-universal expectation happened quickly. A Wall Street Journal survey published this week found nearly every major bank now anticipates a hike on Wednesday. Most institutions—including Barclays, Citigroup, JPMorgan, Morgan Stanley, and UBS—forecast 50 basis points of total tightening by year-end. Bank of America, Deutsche Bank, and RBC are more hawkish, calling for 75 basis points of tightening in 2026. Goldman Sachs sits at the dovish end of the hiking camp, penciling in only this week’s quarter-point increase. Jefferies and Oxford Economics remain outliers, forecasting a rate cut in December and in 2027, respectively.

    Higher rates increase borrowing costs, dampen spending, and pressure assets that thrive on cheap capital, such as equities and Bitcoin. They also boost yields on safe government bonds, drawing capital away from riskier investments. However, market anxiety stems less from the hike itself than from uncertainty about the trajectory of future moves. Markets are repricing now, ahead of the Fed’s communication, to account for that ambiguity.

    Inflation and Labor Data Drive the Decision

    The case for tightening rests on persistent inflation. Headline CPI ran at 3.4% annually in August, with core inflation at 2.5%—both comfortably above the Fed’s 2% target. Oil prices, elevated by the ongoing conflict with Iran, have added a layer of price pressure that neither tariffs nor rate cuts can easily offset.

    The Fed held rates steady at 3.50%–3.75% in July, but that decision passed by a narrow 9–3 vote, with three policymakers already advocating for a hike at the time. That internal split, combined with a stronger-than-expected August jobs report, tilted the committee toward tightening heading into this week’s meeting.

    Political Tension Mounts as Trump Pressures Fed Chair

    The impending hike places Fed Chair Kevin Warsh in a difficult position. President Donald Trump handpicked Warsh for the role in January and, at his swearing-in ceremony in May, urged him to be “totally independent” while making clear he expected lower rates. That expectation has not materialized—at least not in the way Trump likely meant by “totally independent.”

    In the past two weeks, Trump, Vice President JD Vance, and Treasury Secretary Scott Bessent have all publicly pushed for rate cuts. Trump went as far as threatening to halt trade with countries running surpluses with the U.S. if rates do not come down. Warsh has stated the president has had no influence on Fed decisions.

    The rate decision lands two months before the November midterms, where polls already show voters frustrated with high prices and borrowing costs. The tightening cycle arrives in part because of the tariff and Iran-conflict policies Trump himself has championed.

    Bond Markets Price In Higher-for-Longer Rates

    Bond markets have not waited for Wednesday’s announcement. The 10-year Treasury yield touched 5.04% this week, its highest level since July 2007, as traders priced in both the hike and a prolonged period of elevated rates. The two-year yield, more sensitive to Fed policy, hit its highest level since July 2024. Higher yields make Treasurys more attractive relative to risk assets and tend to strengthen the dollar—a headwind for assets like cryptocurrency that benefit from abundant liquidity.

    Bitcoin and Altcoins Enter Decision Week Under Pressure

    Crypto markets approach the Fed decision already weakened. On Tuesday, Bitcoin traded around $75,700, down roughly 3.2% on the day after the Clarity Act—crypto’s long-awaited market structure legislation—failed a Senate cloture vote. Bitcoin remains well below its September peak near $82,000.

    Technical analysts highlight $73,200 as a critical level: a daily close below it could open the door to $71,000 and even $66,900, negating the bullish structure that recently triggered a golden cross pattern.

    Bitcoin price data. Image: TradingView

    Not all analysts view a hike as purely bearish. Some argue a quarter-point move aimed primarily at anchoring long-term Treasury yields—rather than genuinely tightening financial conditions—could leave crypto’s medium-term outlook largely intact. In this view, the market’s reaction hinges on whether the decision and Warsh’s tone during the press conference surprise relative to what is already priced in.

    Higher-beta altcoins are expected to experience sharper percentage swings than Bitcoin in either direction, given thinner liquidity and heavier leverage.

    Key Events to Watch Wednesday

    The Fed’s policy statement and updated dot plot are due at 2:00 p.m. ET Wednesday, followed by Warsh’s press conference at 2:30 p.m. ET. Traders will scrutinize whether officials still pencil in just one more hike this year or something closer to the two additional moves Bank of America, Deutsche Bank, and RBC now project.

  • Bitcoin Below $77,000, Zcash Leads Losses as Traders Bet on Fed Rate Hike

    Bitcoin Below $77,000, Zcash Leads Losses as Traders Bet on Fed Rate Hike

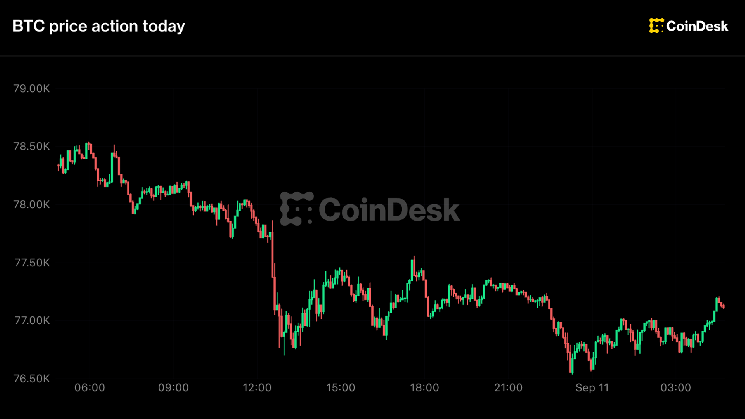
    Bitcoin hovered near a critical technical threshold Thursday as risk assets sold off broadly on surging oil prices, rising Treasury yields, and mounting expectations for another Federal Reserve interest-rate hike.

    Key Support Level in Focus

    Bitget analyst Lewis Huang marked the line before the print, saying “$76,270 is an important technical support level.” Bitcoin is now less than $800 above it.

    Energy Shock Ripples Through Markets

    Brent crude ripped above $107 a barrel, up more than 6%, with West Texas Intermediate near $102. The energy shock feeds directly into the inflation data the Fed is watching. The 10-year Treasury yield pushed toward 5% and the two-year above 4.5%.

    Gold slipped toward $4,330, the dollar index firmed near 99, and the S&P 500 closed lower at about 7,594, a fourth straight decline. Asian equity futures followed, with Japan down nearly 2%, Korea more than 3% and Hong Kong close to 1%.

    Higher Real Yields Pressure Crypto

    Higher real yields drain crypto through two channels at once. They make government debt competitive with an asset that pays nothing, and they raise the cost of carrying leverage.

    U.S. spot bitcoin ETFs are already showing it, with $120 million of outflows on Wednesday, more than double Tuesday’s, while ether, $XRP and solana funds all took in money the same day.

    CPI Data and Fed Expectations

    August CPI lands at 8:30 a.m. ET, with headline inflation expected at 3.4% year over year and core at 2.4%. Interest rate futures put the odds of a hike at the Sept. 15-16 meeting near 70%, up from roughly a coin flip two weeks ago.

  • 10-year Treasury yield tops 4.9%, highest since 2023, as oil surge raises inflation fears

    10-year Treasury yield tops 4.9%, highest since 2023, as oil surge raises inflation fears

    Treasury Yields Surge to Multiyear Highs as Oil Tops $100

    U.S. Treasury yields climbed to multiyear highs on Thursday, driven by a spike in oil prices that overshadowed a relatively benign wholesale inflation report. The benchmark 10-year Treasury note yield rose more than 6 basis points to 4.908%, marking its highest level since November 2023. This yield serves as a critical reference point for mortgage rates, auto loans, and credit card debt.

    Short- and Long-Term Yields Follow Suit

    The 2-year Treasury note yield, which is highly sensitive to near-term Federal Reserve policy expectations, reached 4.518% — its highest point since July 2023. Meanwhile, the 30-year Treasury bond yield advanced more than 4 basis points to 5.332%, reflecting broader geopolitical risk premiums. Yields move inversely to prices; one basis point equals 0.01%.

    Oil Price Spike Fuels Inflation Concerns

    The selloff in bonds accelerated after U.S. oil prices breached $100 per barrel on Thursday, stoked by fears of a prolonged Middle East conflict involving the U.S. and Iran. Higher energy costs threaten to reignite inflationary pressures, potentially altering the trajectory of interest rates.

    Wholesale Inflation Data Comes In Mixed

    Thursday’s Producer Price Index (PPI) report showed headline wholesale prices rose 0.4% in August, matching Dow Jones consensus estimates. Excluding volatile food and energy categories, core PPI increased just 0.2%, coming in below the forecasted 0.3% gain. The data did little to calm markets already focused on the oil-driven inflation risk.

    Treasury Buyback Adds to Supply Dynamics

    Yields had already risen Wednesday following an announcement by Treasury Secretary Scott Bessent that the department would buy back $6 billion of longer-dated government bonds. The operation added to the supply-side narrative pressuring longer maturities.

    Focus Shifts to CPI and Fed Decision

    With the PPI data released and the 10-year yield testing multiyear peaks, investors are now turning their attention to Friday’s Consumer Price Index (CPI) report for a clearer picture of consumer-level inflation. Next week’s Federal Reserve interest rate decision will be the next major catalyst for rate markets.

  • Stock Market Today: Live Updates on Market Moves

    Stock Market Today: Live Updates on Market Moves

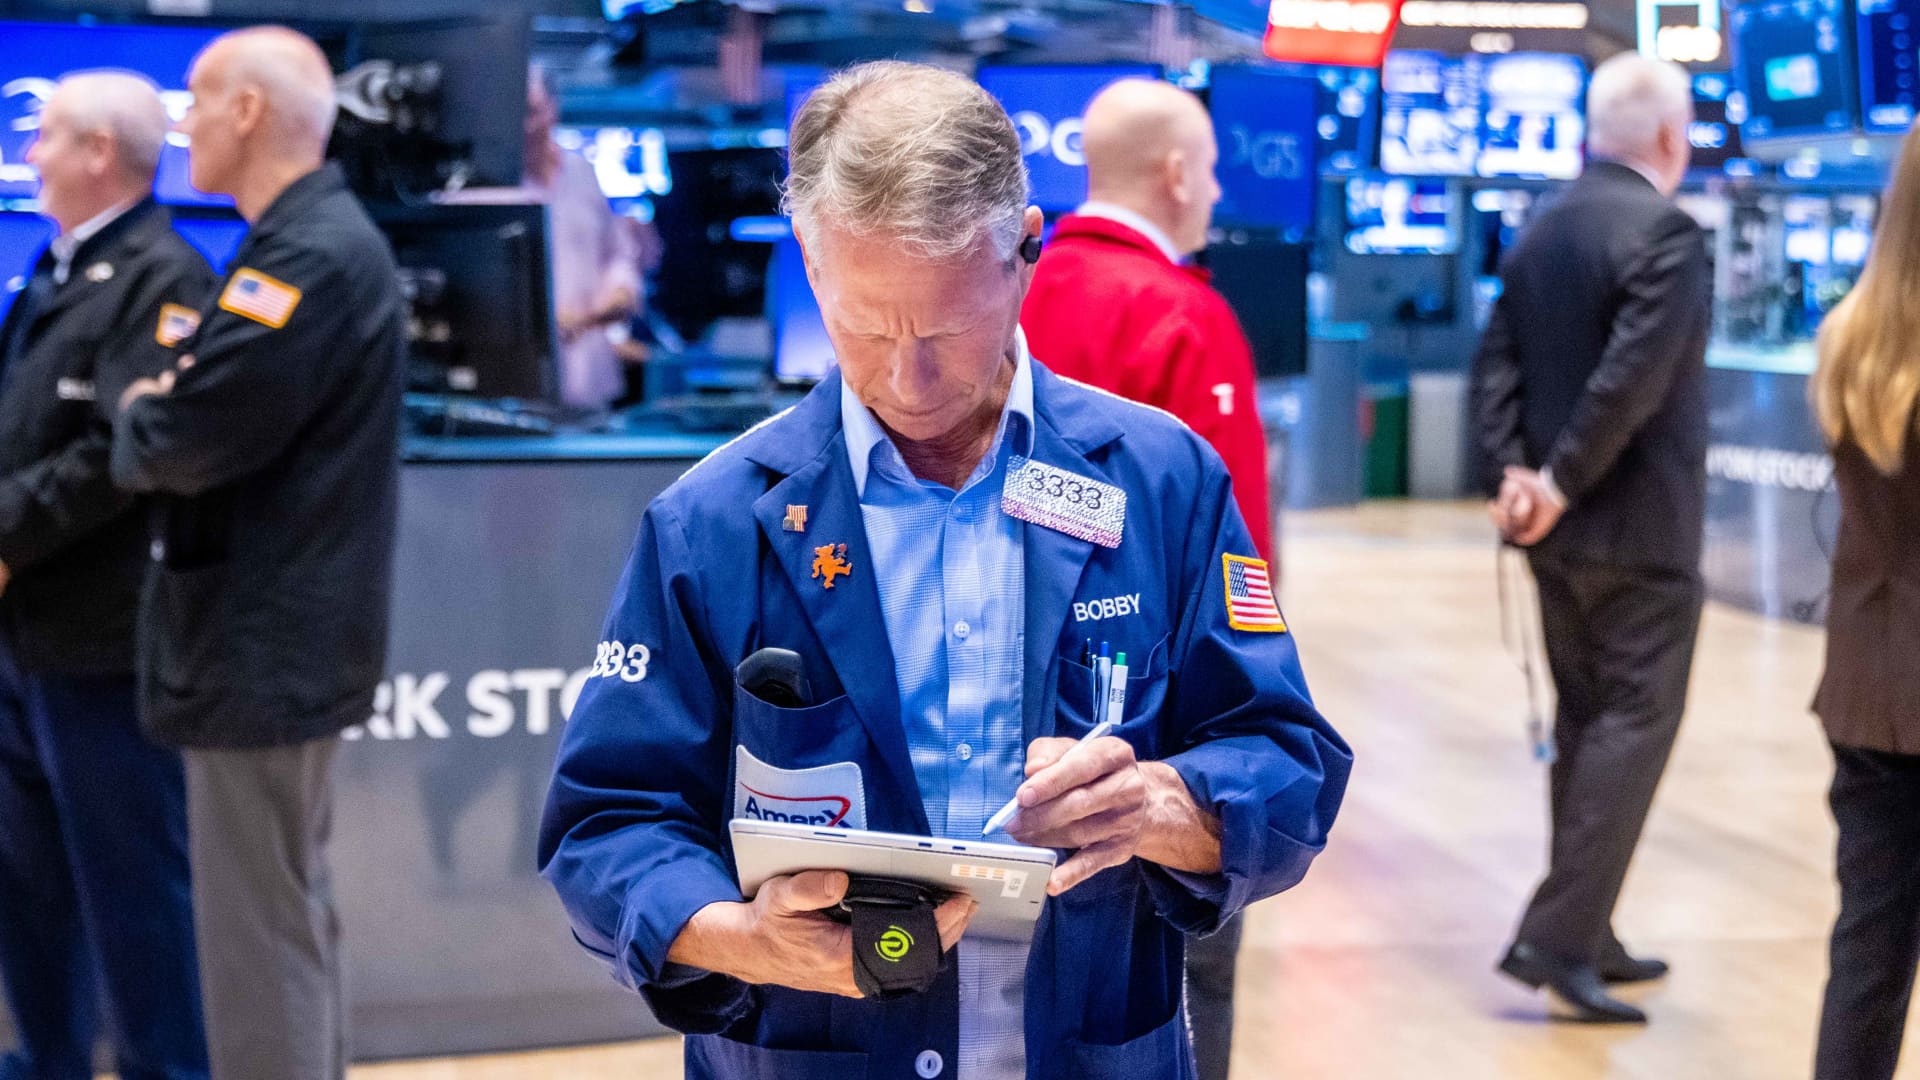
    Traders worked the floor of the New York Stock Exchange on Aug. 25, 2026, as U.S. equities slid Thursday after domestic oil prices surged past $100 a barrel. The selloff reflected mounting anxiety that a prolonged conflict in the Middle East would fuel higher inflation and keep interest rates elevated for longer.

    Major Indexes Finish Lower

    The Dow Jones Industrial Average fell 195 points, or 0.4%. The S&P 500 declined 0.6%, while the Nasdaq Composite dropped 0.9%. The three major averages extended a losing streak to three sessions.

    Oil Prices Jump on Geopolitical Tensions

    Crude prices continued to weigh on market sentiment as the war between the U.S. and Iran entered its seventh month. U.S. West Texas Intermediate futures for October delivery climbed above $100 per barrel, while the international benchmark Brent crude for November spiked above $105 a barrel.

    Treasury Yields Hit Multi-Month Highs

    The rally in energy pushed the benchmark 10-year Treasury yield above 4.9%, its highest level since November 2023. Rising yields pressured rate-sensitive growth sectors, particularly high-beta semiconductor stocks that have led the bull market.

    Chip Stocks Lead Sector Declines

    Intel shares fell 3%, and Micron Technology declined 2%, as investors worried that higher borrowing costs and energy expenses could slow economic growth and dampen demand for semiconductors.

    Wholesale Inflation Data Fails to Soothe Nerves

    A relatively tame producer price index report did little to calm fears. The PPI rose a seasonally adjusted 0.4% in August, matching the Dow Jones consensus. On an annual basis, wholesale inflation stood at 5.4%, well above the Federal Reserve’s 2% target.

    The data arrives ahead of Friday’s closely watched consumer price index. Both gauges feed into the Fed’s preferred inflation metric, the personal consumption expenditures price index, which will not be released until after the central bank’s rate decision on Sept. 16.

    Analyst Perspective: PPI Inconclusive, Oil and Yields Raise Stakes

    “The PPI release itself was inconclusive, in that doesn’t really help to settle the question of ‘hike or no hike’ from the Fed next week, but WTI oil prices surging back above $100 and Treasury yields hitting new highs is certainly raising the stakes for investors ahead of tomorrow’s crucial CPI report,” wrote Stephen Coltman, head of macro at 21shares.

    Fed Hike Probability Climbs to 74%

    Fed funds futures were last pricing in a 74% likelihood of a quarter-point rate increase following next week’s policy meeting, according to the CME FedWatch Tool.

    Treasury Buyback Announcement Adds to Pressure

    The market’s three-day slide accelerated after the Treasury Department said it would buy back up to $6 billion in longer-term debt — triple the usual amount. Less than a month earlier, the Treasury had announced it would more than double the size of its $2 billion government debt repurchase operations.

    — CNBC’s Jeff Cox and Spencer Kimball contributed to this report.

  • Bitcoin Holds Above $78,000 as HYPE Leads While Major Cryptocurrencies Slip on Hawkish Fed Bets

    Bitcoin Holds Above $78,000 as HYPE Leads While Major Cryptocurrencies Slip on Hawkish Fed Bets

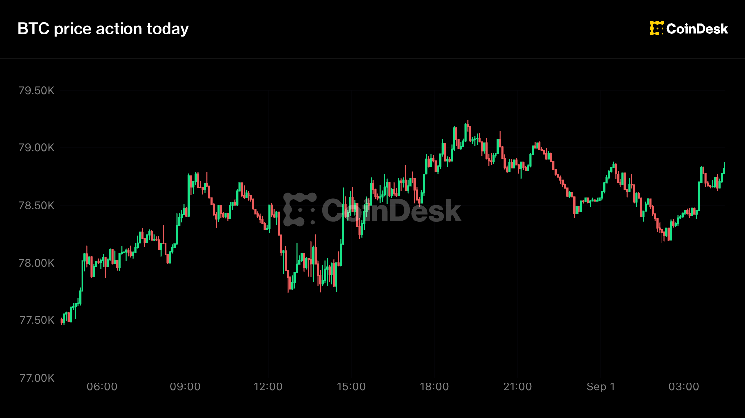
    Oil is increasingly driving the rates market, with the U.S. 10-year Treasury yield rising to 4.78%. Traders now see roughly 64% odds of an interest-rate hike at the Federal Reserve’s September 16 meeting, up from about 36% before Chair Kevin Warsh’s Jackson Hole address. Gold fell to approximately $4,435 an ounce after gaining 10% in August.

    Bitcoin has held near $78,000 following a 23% rally, a sign that may be more significant than the rally itself. “Holding around $78,000 after a 23% surge is more telling than the surge itself,” said Yusuf Fakhro, partner at ARP Digital, in an email. He added that perpetual open interest is at its lowest level since May, while U.S. spot bitcoin ETFs recorded their strongest week of demand since October 2025. Together, those trends suggest the August advance was driven by spot demand rather than crowded leveraged positions that could trigger further selling.

    Bitcoin ETF flows have since weakened. Trading firm Wintermute recorded $924 million in bitcoin ETF inflows during nine consecutive positive sessions before a $202 million outflow ended the run on Friday. Bitcoin has been rejected at the $82,000 level each time since.

    “Market’s on edge but lacks directional conviction in the short term,” said Jasper De Maere, OTC trader at Wintermute, in an email.

    U.S. jobs data could set bitcoin’s next move

    Friday’s August payrolls report will be the final major labor-market indicator released before the September Federal Open Market Committee meeting. With interest-rate hike expectations already close to two-thirds, a stronger-than-expected jobs report could push Treasury yields higher and send bitcoin back toward the overnight low of $77,200.