Tag: Technical breakout

  • SUI Jumps 16% as Volume Nears $1.7B; Traders Eye $2 Target If Conditions Hold

    SUI Jumps 16% as Volume Nears $1.7B; Traders Eye $2 Target If Conditions Hold

    Key Highlights

    • SUI token surged 16.59% in a single session as trading volume nearly doubled to $1.73 billion, signaling strong capital inflow behind the price recovery.
    • On-chain metrics remained robust with 125,038 active addresses, 12,551 new addresses, and 41.44 million transactions processed in 24 hours, while Total Value Locked held firm at $551.65 million.
    • Technical breakout above a prolonged descending channel, confirmed by Parabolic SAR flip and bullish DMI structure, opens path toward $1.3295 resistance with $2.00 as a potential extended target.

    SUI Token Stages 16.59% Rally on Doubled Volume and Surging Network Activity

    The SUI token delivered a sharp 16.59% daily price gain as trading activity nearly doubled, providing substantial market participation behind the recovery move. According to market data, the token’s trading volume expanded 94.28% to reach $1.73 billion, almost doubling alongside the price advance. This volume surge attracted significantly greater market participation than the previous session, reinforcing the relevance of SUI’s price rebound from its wider declining technical structure. The token drew substantially more capital turnover as prices recovered rather than advancing on thin activity, though the rapid uptick brought prices toward a crucial technical zone where sustained participation will be essential for further upside.

    On-Chain Metrics Provide Fundamental Backing for Price Recovery

    Beyond trading markets, the Sui network recorded considerable usage during the recent 24-hour period, adding an on-chain dimension to the rally. According to DeFiLlama analytics, AAVE’s Active Addresses on Sui hit 125,038, with the network adding 12,551 new addresses within the 24-hour window. Transaction activity provided another strong indicator, with Sui processing 41.44 million transactions over the same period. These figures suggest network participation remained exceptionally active as SUI recorded its double-digit price recovery. The address increase gave the rally an on-chain element beyond expanding trading volume, while new addresses reflected fresh traders interacting with the network during the rally period. Expanded transaction activity indicated existing users continued generating considerable on-chain activity, creating potential for stronger fundamental backing as SUI attempts to extend its recovery.

    DeFi Liquidity Holds Firm as TVL Climbs to $551.65 Million

    The Sui DeFi ecosystem preserved considerable liquidity as prices pushed higher, with Total Value Locked (TVL) climbing to $551.65 million following a modest 0.34% increase over 24 hours. Despite the modest percentage gain, the key takeaway is that ecosystem liquidity did not contract even as speculative market activity expanded rapidly. This distinction matters because a falling TVL could have weakened the fundamental outlook beneath SUI’s recovery. Instead, capital locked across Sui DeFi remained firm as both network and trading activity strengthened. The rally emerged alongside stable ecosystem liquidity rather than a noticeable withdrawal of DeFi capital. Continued TVL growth could validate this backdrop if prices continue pushing higher, though price expansion significantly outpaced the daily TVL increase, leaving technical confirmation increasingly crucial for sustained upside.

    Technical Breakout Above Descending Channel Targets $1.3295 Resistance

    On a weekly timeframe chart, SUI strengthened its technical structure after breaking above its extended descending channel during the recent price recovery. The breakout followed a price reversal from the $0.6578 support region, marking an important shift in the token’s wider price structure. Adding further support to the bullish setup, the Parabolic SAR indicator flipped below the prevailing price near $0.5597. The Directional Movement Index (DMI) structure also favored buyers, with the +DI at 30.40 positioned above the -DI signal at 14.70. The Average Directional Index (ADX) strength indicator reached 20.75, leaving room for directional strength to expand as the price breakout developed. SUI now needs to protect its position above the broken descending channel. Ultimately, the token’s price breakout gained backing from stronger trading activity, elevated network usage, and firm DeFi liquidity. If bulls defend the channel breakout, the $1.3295 resistance could become the next test before a possible move toward $2.00.

    Why This Matters

    The convergence of rising trading volume, robust on-chain activity, and stable DeFi liquidity represents a rare multi-factor confirmation for a layer-1 token recovery. Most rallies in the current market environment are driven by either speculative futures flows or isolated fundamental improvements, but rarely both simultaneously. SUI’s ability to generate 41.44 million daily transactions while adding over 12,000 new addresses suggests genuine network adoption is occurring alongside price appreciation. The TVL stability at $551.65 million is particularly noteworthy given that many competing ecosystems have seen capital rotation out of DeFi during volatile periods. From a technical perspective, the weekly descending channel breakout combined with the Parabolic SAR flip and bullish DMI alignment creates a coherent structure that could attract trend-following capital. The $1.3295 level represents the next significant horizontal resistance, and a weekly close above it would likely trigger algorithmic and systematic buying interest toward the $2.00 psychological level.

    Frequently Asked Questions

    What drove SUI’s 16.59% daily price gain?
    The surge was driven by a 94.28% increase in trading volume to $1.73 billion, supported by strong on-chain metrics including 125,038 active addresses, 12,551 new addresses, and 41.44 million daily transactions, alongside stable DeFi TVL at $551.65 million.
    What are the key technical levels to watch for SUI?
    Immediate resistance sits at $1.3295 following the descending channel breakout. The Parabolic SAR flipped bullish near $0.5597, and the token reversed from $0.6578 support. A sustained move above $1.3295 could open a path toward $2.00.
    Is the rally supported by fundamentals or just speculation?
    Both. The rally coincides with expanding network usage (41.44M transactions, rising active/new addresses) and stable DeFi liquidity (TVL at $551.65M), suggesting fundamental activity underpins the speculative volume surge.

  • Canton Network Breaks Two-Month Range; CC’s Run to $0.15 Depends on Key Zone

    Canton Network Breaks Two-Month Range; CC’s Run to $0.15 Depends on Key Zone

    Key Highlights

    • Canton Network’s CC token surged 13.59% in 24 hours, ranking as the second-best performer among large-cap altcoins behind only Ethena’s ENA (25%).
    • CC broke above a two-month consolidation range capped at $0.125, with technical targets now set at $0.150 and $0.162 if bullish momentum sustains.
    • On-chain data shows a mint/scan ratio of 61.4% on Cantonscan, while volume indicators including A/D and CMF (+0.17) confirm strong capital inflows supporting the breakout.

    Canton Network Token Breaks Two-Month Range Amid RWA Narrative Strength

    Canton Network’s native CC token delivered one of the strongest single-day performances across the large-cap altcoin spectrum, climbing 13.59% at the time of writing. Only Ethena’s ENA token, which posted a 25% gain, outperformed CC among top market-cap assets. The rally reflects a broader risk-on rotation into altcoins, amplified by a narrative specific to Canton: its positioning as an institutional-grade real-world asset (RWA) platform with a token burn mechanism that has captured market attention.

    On-chain metrics from Cantonscan reveal the network’s daily mint/scan ratio stood at 0.614, or 61.4%. While this figure signals high activity, it remains below the 100% threshold required for net deflationary pressure. Nevertheless, the combination of RWA adoption prospects and the burn narrative has provided a fundamental tailwind that distinguishes CC from purely speculative movers.

    Technical Breakout Targets $0.150 Swing High

    On the CC/USDT daily chart sourced from TradingView, the token has decisively cleared a horizontal range that had contained price action since late July. The $0.09 demand zone was tested and defended three times since August, establishing a firm base. The latest upswing pierced the $0.125 range high, a level that now transitions into potential support.

    However, the broader daily swing structure remains bearish. The $0.150 level represents the most recent lower high within the long-term downtrend; a sustained close above this mark would be the first technical confirmation of a trend reversal. Until then, the breakout carries the inherent risk of a bull trap.

    Volume Indicators Validate Buying Pressure

    Accumulation/Distribution (A/D) data shows a steady rise in buying pressure, with the indicator reclaiming levels last seen in July. The Chaikin Money Flow (CMF) reading of +0.17 further underscores significant capital inflows. These volume-based confirmations reduce the probability of a false breakout and suggest the move is backed by genuine demand rather than thin liquidity manipulation.

    Traders Eye Pullback to $0.125 for Long Entries

    Classic range-breakout playbooks suggest the former resistance at $0.125 will likely be retested as new demand before any continuation toward higher targets. This zone offers a logical entry for trend-following positions with defined risk. A retreat back inside the prior range—below $0.125—would signal a failed breakout, a scenario bulls must defend aggressively.

    To the upside, the measured move based on the range’s width projects a target near $0.162, with the $0.150 swing high acting as an intermediate milestone. Clearing $0.150 would not only validate the breakout but also initiate a higher-high, higher-low sequence necessary to declare a new uptrend.

    Why This Matters

    The CC rally highlights a converging theme in digital assets: institutional-grade infrastructure tokens with tangible revenue models—such as RWA settlement layers—are attracting capital even in choppy macro conditions. Canton Network’s focus on permissioned, privacy-preserving interoperability for financial institutions differentiates it from generic Layer 1 narratives. The burn mechanism, while not yet net deflationary, introduces a supply-side dynamic that could become increasingly relevant as network adoption scales. Traders and investors should monitor whether the $0.125 retest holds and whether on-chain activity (mint/scan ratio) trends toward deflationary territory, as both would reinforce the bullish thesis.

    Frequently Asked Questions

    What triggered the CC token’s 13.59% surge?
    The rally was driven by a combination of broad altcoin strength, growing enthusiasm for Canton Network’s institutional-grade RWA narrative, and the token’s burn mechanism, which together fueled bullish sentiment and heavy buying volume confirmed by CMF and A/D indicators.
    What are the key price levels to watch for CC/USDT?
    Immediate support sits at $0.125 (former range high). A successful retest could propel price toward $0.150 (key swing high to flip structure bullish) and $0.162 (measured-move target). A close back below $0.125 would invalidate the breakout.
    Is the CC token currently deflationary?
    No. Cantonscan data shows a daily mint/scan ratio of 61.4%, meaning new token issuance still exceeds burn activity. The ratio would need to exceed 100% for net deflationary pressure to emerge.
  • HBAR Price Surges 29%, Breaks Long-Term Resistance — $0.10 Target in Sight?

    HBAR Price Surges 29%, Breaks Long-Term Resistance — $0.10 Target in Sight?

    Key Highlights

    • Hedera’s HBAR token has surged nearly 29% from its recent low, reaching approximately $0.097 and breaking above the long-standing $0.086 resistance level.
    • The rally occurred on elevated trading volume, with the price clearing its 200-day moving average and shorter-term averages, signaling broad-based buyer participation.
    • The next critical hurdle is the psychological $0.10 level; a decisive daily close above could open the path toward the $0.109–$0.11 resistance zone seen in early June.

    HBAR Breaks Multi-Month Resistance on Strong Volume

    Hedera’s native token, HBAR, has staged a notable recovery, climbing almost 29% from its recent trough to trade near $0.097. The advance has propelled the altcoin above a persistent technical barrier at the $0.086 price level, a zone that had capped upside attempts for months. According to chart data sourced from TradingView, the token touched an intraday high of $0.099, bringing it within striking distance of the psychologically significant $0.10 threshold—a level HBAR has not managed to close above in several months.

    Volume Surge Confirms Buyer Conviction

    Adding technical weight to the move, daily trading volume expanded significantly compared to the preceding session and exceeded the average levels observed throughout August and early September. In technical analysis, a price advance accompanied by rising volume is typically interpreted as confirmation of genuine buyer interest, distinguishing a sustainable trend from a low-liquidity spike. The breakout has also repositioned HBAR above its 200-day moving average, which resides near the $0.086 mark. This long-term average previously acted as a ceiling for price action; reclaiming it suggests the current upswing may represent a structural shift rather than a fleeting bounce. Shorter-term moving averages now also sit below the current price, indicating bullish alignment across multiple timeframes.

    $0.10 Level Emerges as Pivot Point for Next Leg

    The immediate focus for market participants is whether HBAR can secure a convincing daily close above $0.10. The token stalled near $0.099 in the latest session, highlighting the resistance cluster at this round number. Should buyers overcome this hurdle, the early June supply zone between $0.109 and $0.11 becomes the next logical target—a region that previously triggered heavy selling pressure and may test resolve again. Conversely, failure to clear $0.10 could prompt a consolidation or pullback after the rapid ascent. The first line of defense on any rejection lies at $0.09, followed by the former breakout level at $0.086. A decisive break back below $0.086 would invalidate the bullish structure and raise the possibility that the recent rally overextended too quickly.

    Why This Matters

    Hedera’s price action reflects broader sentiment shifts in the layer-1 blockchain sector, where investors are reassessing valuations amid evolving macroeconomic conditions and network-specific developments. A sustained break above the 200-day moving average, confirmed by volume, is widely watched by algorithmic and discretionary traders alike as a signal of trend reversal. The $0.10 level holds outsized psychological importance; clearing it could attract momentum-driven flows and algorithmic buy programs, while failure may invite short-term profit-taking. Market participants will also monitor on-chain metrics—such as active addresses, transaction count, and staking participation—to gauge whether the price move is supported by fundamental network usage growth.

    Frequently Asked Questions

    What triggered HBAR’s recent 29% price increase?
    The rally appears driven by a technical breakout above the $0.086 resistance (200-day moving average) on significantly higher-than-average trading volume, indicating renewed buyer interest. No specific fundamental catalyst was cited in the source analysis.
    What are the key price levels to watch for HBAR next?
    The immediate resistance is $0.10. A daily close above this could target the $0.109–$0.11 zone. On the downside, $0.09 is the first support, followed by the critical $0.086 level; a break below $0.086 would negate the bullish breakout.
    Does the volume increase confirm the uptrend is sustainable?
    Rising volume during the advance is a positive technical signal suggesting broader participation. However, sustainability depends on whether buyers can defend the $0.086–$0.09 zone on any pullback and ultimately secure a close above $0.10.
  • SEI Surges 25% as Canary’s 90% Staking Plan Tightens Supply

    SEI Surges 25% as Canary’s 90% Staking Plan Tightens Supply

    Key Highlights

    • Sei ($SEI) surged 25.93% to $0.06285 after decisively breaking the $0.052 resistance level, accompanied by a 289% spike in daily trading volume to $203.44 million.
    • Canary Capital’s amended S-1 filing proposes staking approximately 90% of the ETF’s $SEI holdings, a structure that could significantly reduce circulating supply given that 42% of tokens are already staked.
    • Technical indicators show extreme overbought conditions with RSI at 87.64, while derivatives data reveals open interest near $95 million, suggesting leveraged positioning rather than spot-driven demand.

    Sei Breaks Key Resistance with Explosive Volume

    After weeks of failed attempts near the $0.052 level, Sei ($SEI) has finally executed a decisive breakout, surging 25.93% in 24 hours to reach $0.06285. The move marks a clear transition from a prolonged consolidation phase into upward momentum, according to TradingView chart analysis. Daily trading volume exploded to $203.44 million, representing a 289% increase per CoinMarketCap data, signaling broad-based market participation rather than isolated speculative activity. The volume surge suggests the breakout has attracted significant new capital, validating the technical breach of a resistance level that had repeatedly rejected price advances over recent weeks.

    Technical Indicators Signal Overbought Conditions

    Despite the bullish structure of the breakout, technical metrics warn of immediate downside risk. The Relative Strength Index (RSI) sits at 87.64, well into extreme overbought territory, indicating that buying momentum has reached unsustainable levels. Because the breakout price has moved well beyond the prior trading range, there is very little support established above the former $0.052 resistance. This structural vacuum means any profit-taking or shift in sentiment could trigger a rapid retracement. A successful retest and hold at $0.052 would validate the emerging trendline construction, but failure to defend that level could expose the token to significant selling pressure as recent buyers exit positions.

    Canary Capital ETF Proposal Introduces Supply Dynamics

    A fundamental catalyst underpinning the rally is Canary Capital’s amended S-1 registration statement for a spot $SEI exchange-traded fund. The filing proposes staking roughly 90% of the ETF’s $SEI holdings, a mechanism that would remove the majority of tokens acquired through fund purchases from open circulation. With approximately 4.2 billion of the 10 billion total tokens — 42% of circulating supply — already staked, the ETF structure would further constrain the tradable float rather than expand liquidity access. All future staking rewards would flow directly into the fund, compounding the yield-bearing allocation. BitGo has been designated as the sole custodian, streamlining operational execution while concentrating custody exposure. Larger inflows under this model could tighten liquidity further and amplify $SEI’s price sensitivity to demand shifts.

    Derivatives Market Drives Current Momentum

    While ETF headlines have fueled positive sentiment, derivatives markets remain the primary engine of current trading activity. Open interest sits near $95 million with funding rates moderately positive around 0.01%, according to CoinGlass data, indicating that leveraged traders are positioning for continued upside. However, this derivatives-heavy structure creates fragility: the recent price premium relies on expectations for the proposed ETF rather than actual creation and redemption activity, as regulatory approval and listing remain pending. Without a stronger shift toward spot-market buying, fading ETF optimism could prompt leveraged participants to unwind positions rapidly, placing recent gains under significant pressure.

    Why This Matters

    The convergence of a technical breakout, a novel ETF staking mechanism, and derivatives-driven speculation creates a unique inflection point for Sei. The Canary Capital proposal represents one of the first ETF structures to explicitly integrate native staking at scale, potentially setting a precedent for how crypto asset managers handle proof-of-stake tokens. If approved, the 90% staking ratio could effectively lock up a substantial portion of new institutional demand, creating a structural supply squeeze. However, the current rally’s dependence on futures positioning rather than spot accumulation highlights the speculative nature of the move. Market participants should monitor whether spot volume sustains above the 24-hour surge and whether the $0.052 level transitions from resistance to support — the key technical validation for a durable trend change.

    Frequently Asked Questions

    What caused Sei’s 25% price surge in 24 hours?

    The surge was triggered by a decisive break above the $0.052 resistance level that had contained price action for weeks, accompanied by a 289% volume increase to $203.44 million. Positive sentiment around Canary Capital’s proposed spot ETF with a 90% staking mechanism provided a fundamental narrative catalyst.

    How would Canary Capital’s ETF staking plan affect $SEI supply?

    The proposal to stake 90% of the ETF’s holdings would remove newly acquired tokens from circulation, further reducing the tradable float. With 42% of the 10 billion total supply already staked, this structure could intensify supply constraints and amplify price responses to demand.

    Is the current rally sustainable given technical indicators?

    Technical warning signs are significant: RSI at 87.64 indicates extreme overbought conditions, and minimal support exists above the breakout level. The rally is currently derivatives-led (open interest near $95M) rather than spot-driven, making it vulnerable to leveraged unwinding if ETF approval timelines extend or sentiment shifts.

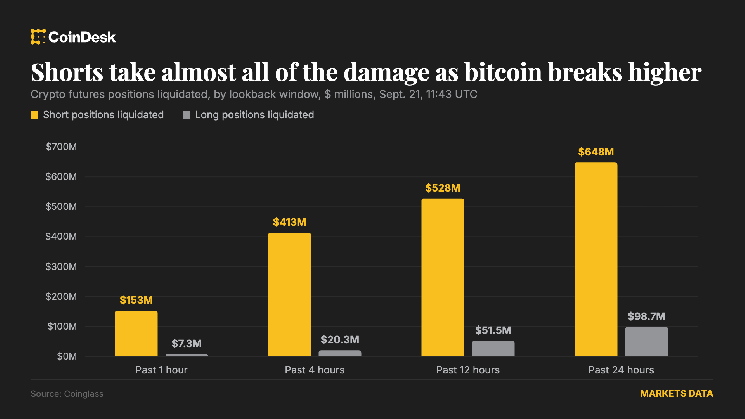
  • Bitcoin Hits $85,000 as Short Squeeze Liquidates $648 Million in Bearish Bets

    Bitcoin Hits $85,000 as Short Squeeze Liquidates $648 Million in Bearish Bets

    Key Highlights

    • Bitcoin surged 5.4% to $84,984, breaking decisively above the September range high of $82,284 set on Sept. 4.
    • The rally was fueled primarily by a massive short squeeze, with $746 million in positions liquidated over 24 hours—$647.9 million of them shorts.
    • Open interest rose 7.59% to $156 billion and volume jumped 39% to $224 billion, indicating traders are re-establishing positions rather than exiting the market.

    Bitcoin Breaks September Resistance on Heavy Short Liquidations

    Bitcoin BTC extended its breakout above the top of its September trading range on Monday, changing hands at $84,984 during the late European morning session. The move represents a 5.4% gain over the prior 24 hours and leaves the asset well clear of the $82,284 high recorded on Sept. 4, which had previously capped upside attempts throughout the month.

    Forced Buying Drives Momentum Rather Than Fresh Conviction

    According to market analysts and data from Coinglass, the rally is being propelled predominantly by forced buying stemming from a cascading short squeeze rather than an influx of new long-side conviction. Over the past 24 hours, $746 million in total positions were liquidated, of which $647.9 million were short positions. In the most recent hour alone, an additional $159.9 million in positions were wiped out, with 95% of those liquidations on the short side.

    Bitcoin shorts accounted for $277.5 million of the 24-hour liquidation total, while Ether (ETH) shorts contributed $122.8 million. The disproportionate short-side washout underscores a market that was heavily positioned for downside or range-bound price action, leaving bears vulnerable to a sharp upside repricing.

    Open Interest and Volume Signal Position Replenishment

    Despite the massive short covering, open interest across the market has risen 7.59% to $156 billion, and 24-hour trading volume has surged 39% to $224 billion. This combination—rising open interest alongside heavy liquidations—suggests that traders are actively replacing the positions being closed out rather than stepping back from the market. The data points to a structural repositioning, with new participants or existing players re-entering on the long side as the breakout confirms.

    Why This Matters

    The break above the September range high marks a technically significant development for Bitcoin, which had been consolidating in a relatively tight band for weeks. The fact that the move was catalyzed by a short squeeze rather than organic spot buying introduces a degree of fragility: if the forced buying exhausts itself without follow-through from spot accumulators, a pullback toward the former resistance—now potential support—around $82,000 could materialize. However, the concurrent expansion in open interest and volume suggests the market is not merely covering shorts but rebuilding directional exposure. Traders will be watching closely for sustained spot bid interest, funding rate normalization, and whether the $85,000 level can flip to support in the coming sessions. The next key technical hurdle lies near the late-July highs around $87,500–$88,000.

    Frequently Asked Questions

    What triggered Bitcoin’s break above the September range?

    The breakout was driven primarily by a massive short squeeze, with $746 million in positions liquidated over 24 hours—$647.9 million of them shorts—forcing bearish traders to buy back positions and accelerating upside momentum.

    Does rising open interest during a short squeeze signal bullish continuation?

    Yes. The 7.59% increase in open interest to $156 billion, combined with a 39% volume surge to $224 billion, indicates traders are replacing liquidated shorts with new long positions rather than exiting the market, suggesting conviction behind the move.

    What are the key levels to watch after this breakout?

    Immediate support now sits at the former September high of $82,284. Upside targets include the late-July highs near $87,500–$88,000. Sustained spot buying and funding rate normalization will be critical for follow-through.