Tag: S&P 500

  • Bond Volatility Surges While Bitcoin and Wall Street Remain Calm

    Bond Volatility Surges While Bitcoin and Wall Street Remain Calm

    Key Highlights

    • The U.S. 10-year Treasury yield briefly touched 5.2% on Thursday before settling at 5.163%, driven by Middle East conflict pushing oil and diesel prices higher and complicating the global inflation outlook.
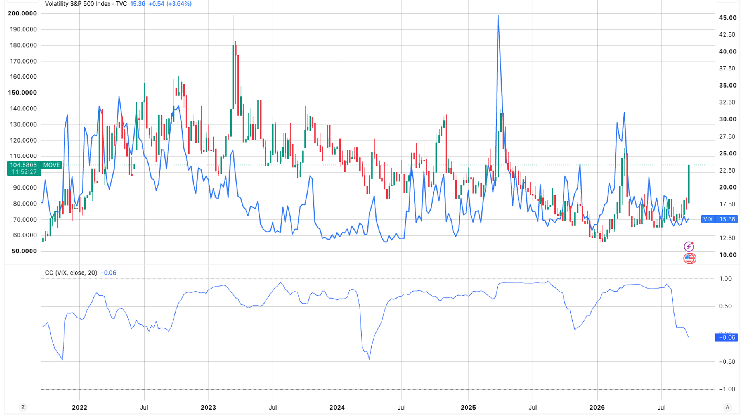
    • The ICE BofA MOVE Index ($MOVE) shows bond traders are paying significantly more for interest-rate volatility protection despite the S&P 500 rising roughly 21% since March when $MOVE was last at similar levels.
    • The 20-day correlation between the VIX and $MOVE turned negative (-0.06) for the first time since April 2024, while the BVIV-$MOVE correlation sits at -0.37, indicating a historic divergence between equity and bond volatility expectations as Bitcoin’s implied volatility hovers near yearly lows.

    Global Bond Yields Surge Amid Middle East Tensions

    A broad-based climb in government bond yields is rippling through global markets this week, with the benchmark U.S. 10-year Treasury yield briefly piercing the 5.2% threshold on Thursday before retreating slightly to 5.163%. The selloff in fixed income comes as the widening conflict in the Middle East drives crude oil and diesel prices higher, injecting fresh uncertainty into the inflation outlook and prompting traders to reassess how much further major central banks may need to tighten monetary policy. The move underscores the fragile nature of the disinflation narrative that had previously anchored market expectations for rate cuts.

    MOVE Index Signals Rising Rate Volatility Premium

    The ICE BofA MOVE Index, a widely watched gauge of expected volatility in U.S. Treasury markets, has climbed to levels last seen in March. However, the equity market backdrop has shifted dramatically: the S&P 500 stood near 6,350 when $MOVE previously traded at this level, but the index has since surged to 7,704, a gain of approximately 21%. This divergence highlights a critical shift—bond traders are now paying a considerably higher premium for protection against interest-rate swings even as equity markets rally, suggesting fixed-income participants see risks that stock investors are currently disregarding.

    Correlation Breakdown Between Asset Class Volatility

    The structural relationship between equity and bond volatility measures is showing signs of fracture. Over a 20-day rolling window, the correlation between the Cboe Volatility Index (VIX) and the MOVE Index has slipped to -0.06, turning negative for the first time since April 2024, though the reading remains statistically close to zero. The correlation between the Cboe Bitcoin Volatility Index (BVIV) and $MOVE is more distinctly negative at -0.37, marking one of its lowest readings in years. This decoupling occurs as bond volatility rises while Bitcoin’s expected volatility remains anchored near its yearly low, a dynamic that challenges traditional cross-asset hedging assumptions.

    Bitcoin’s Detachment from Yield Narrative

    Adding to the complexity, recent analysis from CoinDesk indicates that rising yields alone have demonstrated little consistent relationship with Bitcoin’s returns. The cryptocurrency’s implied volatility, as measured by BVIV, has failed to respond to the spike in rate volatility, remaining near annual lows. This suggests that Bitcoin is currently trading on idiosyncratic drivers—such as ETF flow dynamics and regulatory developments—rather than macroeconomic interest-rate sensitivity, further isolating the digital asset from traditional fixed-income turbulence.

    Why This Matters

    The simultaneous rise in bond yields and volatility premiums, coupled with a breakdown in cross-asset correlations, signals a potential regime shift for multi-asset portfolios. For institutional investors, the negative VIX-MOVE correlation undermines the traditional negative equity-bond correlation that has underpinned 60/40 portfolio construction for decades. The fact that Bitcoin volatility remains suppressed while rate volatility spikes suggests the asset is not currently functioning as a macro hedge against inflation or rate uncertainty. Market participants should monitor whether the $MOVE index sustains these elevated levels, as persistent bond volatility could force a repricing of risk assets broadly, including equities and digital assets, particularly if the Federal Reserve signals a higher-for-longer rate stance in response to energy-driven inflation pressures.

    Frequently Asked Questions

    What is the MOVE Index and why is it important?

    The ICE BofA MOVE Index ($MOVE) measures the implied volatility of U.S. Treasury securities across the 2-, 5-, 10-, and 30-year maturities. It serves as the bond market’s equivalent of the VIX, reflecting how much traders are paying to hedge against interest-rate swings. A rising $MOVE indicates growing uncertainty about the path of monetary policy and inflation.

    Why has the correlation between VIX and MOVE turned negative?

    The 20-day correlation between the VIX (equity volatility) and MOVE (bond volatility) fell to -0.06, its first negative reading since April 2024. This suggests equity traders are complacent—pricing in a soft landing and continued rally—while bond traders are hedging aggressively against sticky inflation and higher-for-longer rates, creating a rare divergence in risk perception across asset classes.

    Is Bitcoin acting as a hedge against rising yields?

    According to CoinDesk’s analysis, rising yields alone have shown little consistent relationship with Bitcoin’s returns. Currently, Bitcoin’s implied volatility (BVIV) is near yearly lows while bond volatility ($MOVE) spikes, and the BVIV-MOVE correlation sits at -0.37. This indicates Bitcoin is not currently functioning as a macro hedge against interest-rate volatility.

  • Bloomberg’s Mike McGlone Warns on Bitcoin, Reveals Condition to Save BTC

    Bloomberg’s Mike McGlone Warns on Bitcoin, Reveals Condition to Save BTC

    Bloomberg Intelligence senior commodities strategist Mike McGlone has warned that elevated equity valuations and expectations of further Federal Reserve interest rate hikes are generating strong sell signals for Bitcoin.

    Bitcoin’s Risk-Adjusted Returns Under Scrutiny

    McGlone noted that Bitcoin’s performance over the past five years has roughly matched the S&P 500 index, but with approximately three times higher volatility. He described Bitcoin as an extremely volatile and speculative digital asset that exhibits a high correlation with the stock market while competing with millions of other crypto assets.

    From a risk and portfolio management perspective, McGlone argued that Bitcoin presents a negative picture because it offers similar returns to the S&P 500 while carrying approximately three times the volatility.

    Three Key Downside Risk Factors Identified

    The analyst pointed to three factors increasing downside risks for Bitcoin:

    • Bitcoin encountering resistance around $80,000 during its recent rise
    • Futures markets pricing in approximately 70 basis points of Fed interest rate hikes over the next year
    • The S&P 500 index trading at significantly higher levels compared to its 200-week moving average

    McGlone noted that Bitcoin tends to move strongly with the S&P 500, especially during periods of decreased market risk appetite, and therefore considers BTC a high-beta asset that follows the stock market.

    Bearish Scenario: Potential Drop to $10,000

    McGlone raised a sharp long-term bearish scenario in which Bitcoin could move toward the $10,000 level, a zone that has acted as critical support multiple times in the past. A sustained decline of approximately 20% in the S&P 500 could trigger such a scenario, according to the analyst.

    However, McGlone added that for this negative scenario to be invalidated, Bitcoin needs to decouple from the stock market and consistently demonstrate strong performance. He suggested that BTC’s ability to maintain strength, particularly during a potential S&P 500 decline, could support the thesis that Bitcoin is no longer just a high-beta risk asset.

    This is not investment advice.

  • Stock Market Today: Dow, S&P 500, Nasdaq Set for Weekly Decline Ahead of Key Inflation Report

    Stock Market Today: Dow, S&P 500, Nasdaq Set for Weekly Decline Ahead of Key Inflation Report

    Key Economic Data and Earnings Set to Drive Markets as Inflation Concerns Resurface

    Investors face a packed economic calendar this week with critical inflation readings, consumer sentiment data, and notable earnings reports poised to test market resilience amid renewed concerns over energy prices and monetary policy trajectory.

    Inflation and Labor Metrics Take Center Stage

    The August Consumer Price Index (CPI) headlines the data docket. Economists forecast the headline index rose 0.4% month-over-month, accelerating from the previous 0.1% gain, while the year-over-year rate is seen holding steady at 3.4%. Core CPI, which strips out volatile food and energy components, is projected to increase 0.2% for the month — matching July’s pace — with the annual rate expected to tick down to 2.4% from 2.5%.

    Real earnings data will provide insight into household purchasing power. Real average hourly earnings were previously flat year-over-year at -0.1%, while real average weekly earnings edged up 0.1%.

    Consumer Sentiment and Inflation Expectations in Focus

    The University of Michigan’s preliminary September sentiment survey offers a real-time gauge of consumer mood. The headline index is expected to come in at 51, slightly below August’s 51.7 final reading. Current conditions are seen at 51.5 versus 51.9 previously, with expectations at 51 against 51.5.

    Inflation expectations remain elevated. The 1-year outlook previously stood at +4%, while the 5-10 year horizon is expected to hold at +3.3%, matching the prior print.

    Earnings Calendar Highlights

    Corporate reporters include The Kroger Co. (KR) and Rent the Runway (RENT), with results likely to color sector sentiment ahead of the broader reporting season.

    Overnight Headlines: Buyout Speculation, AI Anxiety, and Energy Surge

    PayPal Keeps Strategic Options Open Amid Takeover Chatter

    PayPal’s chief executive addressed persistent buyout rumors, stating the payments giant is “keeping options open” regarding its strategic direction. The comments come as the stock trades well below pandemic-era highs, fueling speculation about potential private-equity interest or a transformative deal.

    Adobe Forecast Miss Reignites AI Monetization Worries

    Shares of Adobe slumped after the software leader issued a revenue forecast that fell short of Wall Street estimates. The miss renewed investor anxiety over the pace at which generative AI features can be monetized across its Creative Cloud franchise, a concern rippling through the broader software sector.

    Trump Proposes Eliminating H-1B Grace Period for Laid-Off Workers

    Former President Donald Trump announced a proposal to end the 60-day grace period that allows H-1B visa holders to remain in the U.S. after job loss. The move would significantly tighten the window for skilled foreign workers to find new sponsorship, escalating the immigration debate ahead of the 2024 election.

    Global Bond Selloff Intensifies as Oil Rally Fans Inflation Fears

    Government bonds worldwide came under pressure as surging crude prices amplified concerns that sticky inflation will keep central banks restrictive for longer. The selloff pushed yields higher across major developed markets, pressuring rate-sensitive equities.

    U.S. Diesel Tops $6 a Gallon for First Time, GasBuddy Reports

    The national average price for diesel fuel breached $6 per gallon, a historic milestone documented by fuel-tracking service GasBuddy. The surge adds to transportation cost pressures and threatens to feed into broader consumer price indices in coming months.

  • Stock Market Today: Live Updates and Latest News

    Stock Market Today: Live Updates and Latest News

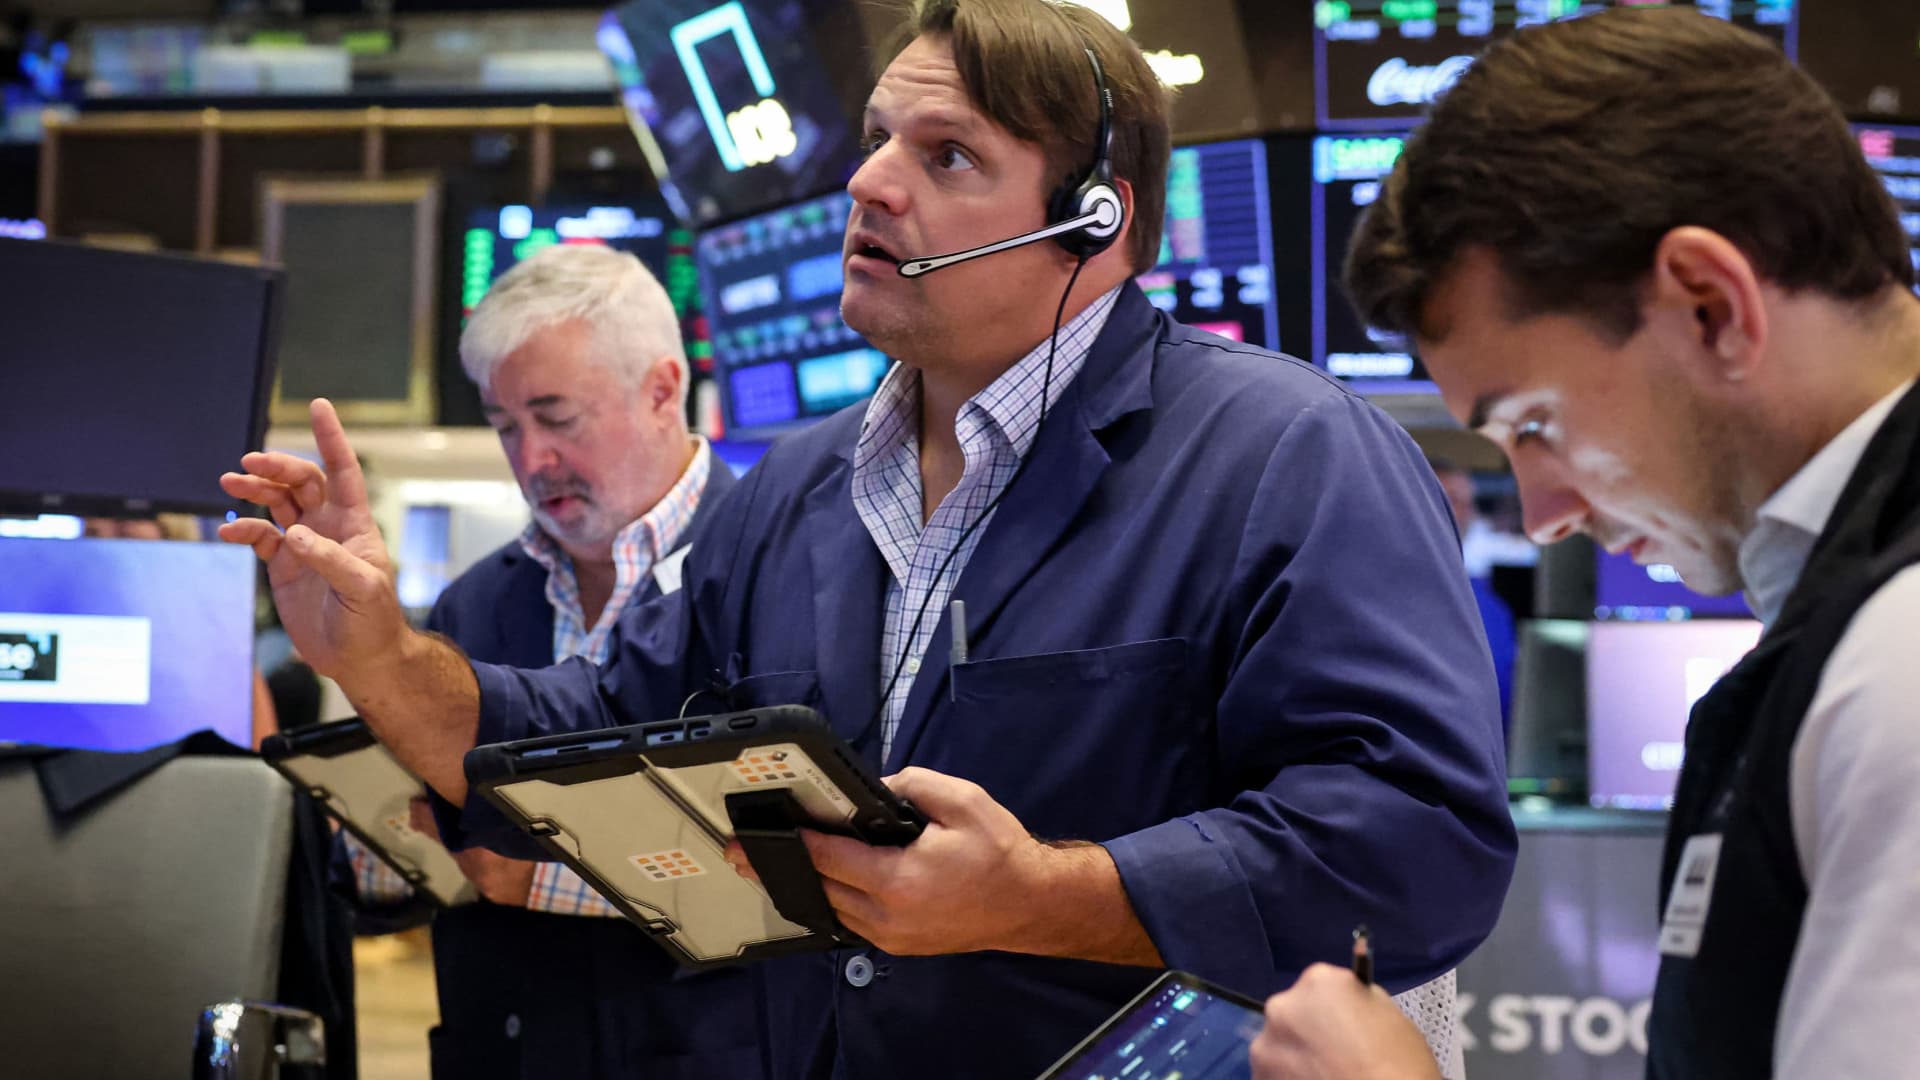
    Traders work on the floor at the New York Stock Exchange in New York City on Aug. 24, 2026.

    Stock futures fell early Tuesday after Wall Street ended the previous session lower, although the major U.S. benchmarks still recorded monthly gains.

    Dow Jones Industrial Average futures were down 0.54% at 5:08 a.m. ET. S&P 500 futures declined 0.58%, while Nasdaq-100 futures dropped 1%.

    The S&P 500 gained 2.6% in August, and the Nasdaq Composite rose 3.9%. The Dow advanced 1.3% for the month, marking its fifth consecutive monthly gain.

    Wall Street closes August under pressure

    U.S. stocks ended August on a weak note. The Dow fell more than 370 points in regular trading as oil prices rose and pushed interest rates higher after the U.S. struck two rocket launchers on Iran’s Larak Island. The S&P 500 and Nasdaq Composite also finished lower.

    “Despite trading less than 115bps from ATHs going into today’s session, the market is exhibiting signs of nervousness across myriad of indicators,” traders at Goldman Sachs wrote, pointing to new American Association of Individual Investors Sentiment Survey data.

    “This attitude toward risk is not just theoretical, investors are quite literally putting their money where their mouth is in terms of portfolio risk allocations.”

    Investors await economic data

    September has historically been a difficult month for stocks. Seasonal weakness, combined with a busy economic calendar, could keep investors cautious throughout the week.

    Manufacturing and services-sector data are scheduled for Tuesday and Wednesday. Investors will receive the August jobs report on Friday. Economists surveyed by Dow Jones expect 53,000 jobs were added during the month.

    Asian and European stocks

    In Asia, Japan’s Nikkei 225 closed 0.15% lower, while South Korea’s Kospi gained 0.23%. Australia’s benchmark S&P/ASX 200 fell 0.10%, and mainland China’s CSI 300 ended 0.30% lower.

    European stocks were broadly lower, with the regional Stoxx 600 index down 0.6% in mid-morning trading. Oil and gas stocks moved against the wider trend, rising 1.3% as they tracked gains in crude prices.

    Source: www.cnbc.com

  • S&P 500 Beats Inflation Again as 30% Earnings Growth Drives Real Returns

    S&P 500 Beats Inflation Again as 30% Earnings Growth Drives Real Returns

    The S&P 500 is on track to deliver another positive inflation-adjusted return in 2026, but the market’s gains are increasingly reliant on corporate profits holding up in a more challenging interest-rate environment.

    The benchmark index has climbed approximately 12%–13% year to date through late August, comfortably outpacing recent U.S. inflation readings. The Consumer Price Index rose about 3.4% over the 12 months through July, while the Federal Reserve’s preferred personal consumption expenditures measure increased 3.7%. As a result, stock investors have achieved a substantial positive real return after accounting for higher consumer prices.

    Corporate Earnings Are Driving More of the S&P 500 Rally

    The key question for the 2026 stock-market rally is what is supporting it.

    S&P 500 companies delivered exceptionally strong second-quarter results. FactSet reported that earnings growth reached its highest level since the second quarter of 2021, while Reuters estimated year-over-year second-quarter growth at approximately 33.5%.

    FactSet also found that 86% of companies reporting through Aug. 7 exceeded earnings-per-share estimates. That compares with five-year and 10-year averages of 78% and 76%, respectively.

    Analysts currently expect third-quarter earnings to grow by roughly 27%–28% year over year, with full-year profit growth projected at approximately 30%.

    Those results give the equity rally a stronger fundamental foundation than a market advance driven solely by expanding valuation multiples.

    Artificial intelligence remains a central part of the market’s growth story. Technology and communication-services companies have generated some of the strongest profit gains, while continued investment in AI infrastructure is supporting earnings expectations.

    AI-related stocks have repeatedly helped lift the latest rally. Nvidia and other semiconductor companies helped push the S&P 500 toward record territory in August.

    Inflation Still Matters as Stocks Rise

    A positive nominal stock-market return does not necessarily translate into the same increase in purchasing power.

    If the S&P 500 gains 13% while inflation reaches 3.5%, the simplified real return is approximately:

    13% − 3.5% = 9.5%.

    The precise inflation-adjusted calculation is slightly different because returns compound, but the subtraction offers a useful approximation.

    Comparing stock-market performance with inflation also helps place record index levels in context. Investors care not only whether the S&P 500 rises, but whether those gains increase purchasing power faster than consumer prices.

    Coinpaper’s guide to real yields explains the same concept from the bond-market perspective: inflation determines how much of a nominal investment return remains in real terms.

    Higher Treasury Yields Pose a Growing Risk

    The main challenge is that persistent inflation is keeping borrowing costs elevated.

    The 30-year Treasury yield recently traded above 5.2%, near its highest level since 2007, while the 10-year yield has remained around 4.7%. Higher Treasury yields increase the returns investors can earn from relatively low-risk government debt and raise the discount rate applied to future corporate profits.

    That pressure has already affected equities. The S&P 500 reached a record 7,798.99 on Aug. 13 before a bond selloff pushed stocks lower. The reversal was especially painful for highly valued technology and semiconductor shares.

    Federal Reserve policy represents another risk. Markets sharply increased expectations for a September rate hike after Chair Kevin Warsh reiterated that inflation remained too high. Renewed pressure on oil prices has added another potential catalyst for inflation.

    For investors, the outlook is more nuanced than the headline “stocks beat inflation.”

    The S&P 500 is still generating a strong real return in 2026, and exceptional earnings growth is providing significant support. However, sustaining that advantage will increasingly depend on corporate profits growing quickly enough to offset persistent inflation, higher bond yields and tighter financial conditions.

    Source: cryptonews.net

  • Investing in the Stock Market at the Worst Possible Time: History Offers Reassuring News for Investors

    Investing in the Stock Market at the Worst Possible Time: History Offers Reassuring News for Investors

    Over the past few years, the stock market has remained remarkably resilient. Despite several periods of short-term volatility, the S&P 500 (SNPINDEX: ^GSPC), Nasdaq Composite (NASDAQINDEX: ^IXIC), and Dow Jones Industrial Average (DJINDICES: ^DJI) have all reached new all-time highs in recent months.

    However, record stock market highs can create a hidden risk. When the next bear market arrives—and it will eventually—investors who buy at peak prices could see their portfolios fall soon afterward.

    In 2009, a “Double Down” signal flashed for the little-known chipmaker Nvidia. For the first time in years, that same “Total Conviction” signal is flashing for a company 1/100th the size of Nvidia.

    Investing near record highs can feel intimidating, and some investors may be tempted to avoid the market and wait for a pullback. But how damaging would it really be to invest at the “worst” possible moment? History suggests the outcome may not be as bad as many investors fear—with one important caveat.

    The worst recessions have one trait in common

    Even the most severe recessions, market crashes, and bear markets are temporary. Although they can cause significant short-term financial and economic damage, long-term investors have historically been rewarded for staying invested.

    For example, imagine investing in an S&P 500 ETF in October 2007, the month the Great Recession officially began. The downturn was the most severe economic contraction in the post-World War II era, and the stock market took years to fully recover.

    The most important point for investors is that a decline in value is not the same as a permanent loss of money. An S&P 500 ETF would have lost 55% of its value during the Great Recession. But an investor who stayed invested until the market recovered would not have locked in those losses.

    From October 2007 to today, the S&P 500 has generated total returns of more than 600%. If you had invested $10,000 in an S&P 500 ETF at that time and made no additional contributions, you would have more than $70,000 today.

    S&P 500 total returns since 2007

    The same pattern has appeared repeatedly throughout market history. The dot-com bubble officially burst in March 2000, creating a bear market that was arguably even more challenging for many investors. It was one of the longest bear markets in S&P 500 history, and the Great Recession struck shortly after the market began reaching new highs again.

    Even so, an investor who bought an S&P 500 ETF in March 2000—immediately before two consecutive recessions—would have earned total returns of around 722% by today.

    S&P 500 total returns since 2000

    What history teaches long-term investors

    If there is one key lesson for investors, it is that the timing of an investment matters less when the investment horizon is long enough.

    Could an investor theoretically have earned more by waiting for the bottom of a bear market before buying? Certainly. But hindsight is 20/20, and it is impossible to know in real time where the market is heading.

    Instead of waiting for the perfect buying opportunity, investors may benefit more from investing consistently and remaining in the market for the long term. Even if you invest at the “wrong” time, history indicates that the market can more than compensate for that timing over time.

    Should you buy the S&P 500 Index right now?

    Before buying stock in the S&P 500 Index, consider this: The Motley Fool Stock Advisor analyst team has identified what it believes are the 10 best stocks for investors to buy now—and the S&P 500 Index was not one of them. The 10 stocks on that list are designed for long-term growth and could generate substantial returns in the coming years.

    Netflix made the list on December 17, 2004. If you had invested $1,000 at the time of the recommendation, you would have $440,710 today.* Nvidia also made the list on April 15, 2005. A $1,000 investment at the time of that recommendation would be worth $1,335,252 today.*

    That performance is why investors pay attention. With a track record of beating the S&P 500 by nearly five times, Stock Advisor offers a distinct advantage. The latest top 10 list is available through Stock Advisor, along with access to an investing community focused on long-term results.

    See the 10 stocks »

    *Stock Advisor returns as of August 30, 2026.

    Katie Brockman has no position in any of the stocks mentioned. The Motley Fool has no position in any of the stocks mentioned. The Motley Fool has a disclosure policy.

    Source: finance.yahoo.com

  • If You’d Invested $1,000 in McDonald’s 25 Years Ago, Here’s How Much It Would Be Worth Today

    If You’d Invested $1,000 in McDonald’s 25 Years Ago, Here’s How Much It Would Be Worth Today

    McDonald’s (NYSE: MCD) has delivered market-beating returns over the past 25 years, largely because of its franchise-focused business model. A $1,000 investment in the consumer discretionary stock 25 years ago would be worth $16,670 today.

    About $10,000 of that gain came from dividends, while McDonald’s stock itself slightly underperformed the S&P 500 over the same period. The company began paying a dividend in 1976 and has increased it every year since.

    How McDonald’s franchising model drives returns

    Most McDonald’s restaurants are franchised, giving the company a more asset-light structure than restaurant operators such as Chipotle, which owns and operates all of its locations.

    Franchising is common across the restaurant industry, but McDonald’s places particular emphasis on brand consistency. Its revenue depends heavily on fees paid by franchisees, including a 4%-5% fee on sales and a minimum 4% fee for advertising and promotions.

    McDonald’s also owns the building at every restaurant. That means it continues to collect rent even when a location’s fast-food operations slow. This real estate component helps the company generate relatively steady revenue across different economic conditions.

    McDonald’s has expanded its footprint to more than 45,000 restaurants in more than 100 countries. That scale may raise concerns about market saturation, but higher rents and population growth could continue to support expansion. The company’s business model may therefore keep driving stock-price appreciation and dividend growth for years to come.

    Should you buy McDonald’s stock now?

    Before buying McDonald’s stock, investors should consider that The Motley Fool Stock Advisor analyst team recently identified what it believes are the 10 best stocks to buy now—and McDonald’s was not among them.

    The selected stocks are positioned for long-term growth and could deliver substantial returns in the coming years. When Netflix appeared on the list on December 17, 2004, a $1,000 investment made at the time of the recommendation would have grown to $440,710. When Nvidia was selected on April 15, 2005, a $1,000 investment would have grown to $1,335,252.

    Stock Advisor’s reported track record of beating the S&P 500 by nearly five times is a key reason investors follow the service. The latest top-10 stock list is available through Stock Advisor, which offers access to an investing community focused on long-term results.

    See the 10 stocks »

    *Stock Advisor returns as of August 29, 2026.

    Will Healy has no position in any of the stocks mentioned. The Motley Fool has positions in and recommends Chipotle Mexican Grill. The Motley Fool recommends the following options: long January 2028 $320 calls on McDonald’s, short January 2028 $340 calls on McDonald’s, and short September 2026 $35 calls on Chipotle Mexican Grill. The Motley Fool has a disclosure policy.

    Source: finance.yahoo.com

  • History Says All Bear Markets Share One Trait—and It’s Fantastic News for Investors

    History Says All Bear Markets Share One Trait—and It’s Fantastic News for Investors

    Investors are growing increasingly nervous as several bear market indicators flash red. The Buffett Indicator, named after Berkshire Hathaway legendary investor Warren Buffett, suggests that the U.S. stock market is historically overvalued.

    Investor sentiment is also weakening. The American Association of Individual Investors reports that 44.4% of individual investors expect a bear market within the next six months, compared with 32.9% who anticipate a bull market. The share predicting a bear market rose by 4.5 percentage points in just one week.

    Still, even if a bear market arrives soon, history offers an important reason for long-term investors to remain focused. There is no way to know exactly when the next bear market will begin, but every bear market in U.S. history has shared a significant trait.

    Bear markets are shorter than bull markets

    A bear market is generally defined as a decline of more than 20% in a broad market index such as the S&P 500, the benchmark most commonly used to gauge the health of the U.S. stock market.

    Even the most severe and longest bear markets in U.S. history have been followed by bull markets that lasted longer—often much longer. The steepest decline was the 56.8% drop during the Great Recession, while the longest was the 31-month bear market that followed the bursting of the dot-com bubble.

    The bear market following the dot-com crash lasted 31 months from peak to trough, running from March 2000 through September 2002. It was followed by a 60-month, or five-year, bull market that continued until October 2007.

    The Great Recession then brought a 17-month bear market that lasted until March 2009. That downturn was followed by the longest bull market in history, which continued for nearly 11 years before the one-month COVID-19 bear market in February 2020.

    Since the S&P 500 was created in 1957, the stock market has spent most of its time in a bull market. There have been approximately 12 total years of bear markets, compared with about 57 years of rising markets.

    Bull market gains have historically exceeded bear market losses

    By definition, each bull market since the S&P 500 was created has produced a gain greater than the loss recorded during the preceding bear market.

    For investors, the more encouraging pattern is that bull markets have typically returned at least twice as much as the preceding bear market lost. Of the 13 bull markets since the S&P 500’s creation, only one—the 1966-1968 bull market—returned less than 1.9 times the losses from the preceding bear market.

    In some periods, the difference was substantially larger. The 1982-1987 bull market returned nine times the losses from the preceding 1980-1982 bear market. The 1990-2000 bull market returned 21 times the losses from the 1990 bear market.

    History therefore suggests that any future bear market is likely to be relatively short-lived compared with the bull market that follows. Investors who remained invested in the S&P 500 through previous bear markets eventually recovered their losses and generally achieved substantial gains after the downturn ended.

    Should you invest in an S&P 500 index fund now?

    Before investing in an S&P 500 index fund, investors should consider that The Motley Fool Stock Advisor analyst team has identified what it believes are the 10 best stocks to buy now—and the S&P 500 Index was not among them.

    The Motley Fool says the 10 selected stocks could generate significant returns in the coming years. When Netflix appeared on the list on December 17, 2004, a $1,000 investment made at the time of the recommendation would have grown to $440,710. When Nvidia appeared on the list on April 15, 2005, the same investment would have grown to $1,335,252.

    Stock Advisor’s total average return is 978%, compared with 213% for the S&P 500. The service promotes its latest list of 10 stocks and an investing community for individual investors.

    See the 10 stocks »

    *Stock Advisor returns as of August 29, 2026.

    John Bromels has positions in Berkshire Hathaway. The Motley Fool has positions in and recommends Berkshire Hathaway. The Motley Fool has a disclosure policy.

    History Says All Bear Markets Have 1 Trait in Common — and It’s Fantastic News for Investors was originally published by The Motley Fool

    Source: finance.yahoo.com