Tag: Short squeeze

  • Bitcoin Surpasses $87,000, Ethereum Tops $2,800: Key Drivers Behind the Rally

    Bitcoin Surpasses $87,000, Ethereum Tops $2,800: Key Drivers Behind the Rally

    Key Highlights

    • Bitcoin surged past $87,000 and Ethereum topped $2,800 as the crypto market extended a powerful rally driven by renewed institutional demand and a massive short squeeze.
    • U.S. spot Bitcoin ETFs recorded approximately $593 million in net inflows over Thursday and Friday, reversing earlier outflows and signaling strengthened institutional appetite.
    • Futures market liquidations reached $926 million in 24 hours, with $785 million in short positions forced to close, accelerating the upward price momentum across major assets.

    Bitcoin and Ethereum Lead Broad Market Rally to Multi-Week Highs

    The cryptocurrency market sustained its vigorous upward trajectory on Monday, with Bitcoin (BTC) breaching the $87,000 threshold and Ethereum (ETH) reclaiming the $2,800 level. According to real-time data from OKX, Bitcoin traded at $87,010, marking a 7.41% gain over the preceding 24 hours, while Ethereum advanced 5.98% to $2,800.26. The synchronized rally across the two largest digital assets by market capitalization underscores a broad-based resurgence in risk appetite among both retail and institutional participants.

    Institutional Demand Rebounds as Spot Bitcoin ETFs See Heavy Inflows

    A primary catalyst for the rally was the sharp reversal of capital flows into U.S. spot Bitcoin exchange-traded funds. Data compiled by Bloomberg revealed that the cohort of U.S.-listed spot Bitcoin ETFs attracted net inflows of approximately $593 million across Thursday and Friday trading sessions. This influx substantially offset the net outflows recorded earlier in the week, renewing market confidence in sustained institutional allocation to Bitcoin as a portfolio asset. The turnaround in ETF flows is widely interpreted by analysts as a leading indicator of renewed long-term conviction among traditional finance allocators.

    Regulatory Green Light for Tokenized Shares Bolsters Sentiment

    Regulatory developments provided an additional tailwind. The U.S. Securities and Exchange Commission (SEC) granted a five-year regulatory exemption to specific platforms permitting the trading of tokenized shares on blockchain infrastructure. Market observers view this decision as a potential milestone in the integration of blockchain-based financial products into the traditional U.S. capital markets framework, potentially paving the way for broader asset tokenization and enhanced market efficiency.

    Macroeconomic Backdrop Shifts in Favor of Risk Assets

    The rally coincided with a constructive shift in the macroeconomic environment. A decline in the U.S. 10-year Treasury yield below 5%, falling oil prices, and a record-high close for the Nasdaq Composite—led by megacap technology stocks—collectively reduced the opportunity cost of holding non-yielding, high-beta assets like Bitcoin. The correlation between tech equities and crypto remained elevated, with Bitcoin outperforming the Nasdaq’s gains by a significant margin, advancing over 6% during the same risk-on window.

    Massive Short Squeeze Amplifies Gains in Futures Markets

    Perhaps the most immediate accelerant was a violent short squeeze in the derivatives market. Data from CoinGlass indicated that $926 million in leveraged positions were liquidated across the cryptocurrency complex in the last 24 hours. Of that total, approximately $785 million represented short positions, compelling bearish traders to buy back exposure aggressively as prices rose. Long liquidations were comparatively modest at roughly $142 million. Bitcoin accounted for $509 million of total liquidations, while Ethereum saw approximately $198 million wiped out. The single largest liquidation event occurred on the BTC/USDT perpetual contract on Binance, involving a position valued at roughly $11.3 million.

    Why This Matters

    The convergence of positive ETF flows, regulatory progress on tokenization, a favorable macro pivot, and a derivatives-driven short squeeze creates a multi-layered bullish structure that is more durable than rallies driven by a single catalyst. The ETF inflow reversal is particularly significant because it reflects discretionary capital allocation decisions by institutional investors, rather than speculative leverage alone. Meanwhile, the SEC’s exemption for tokenized share trading signals a potential thaw in the regulatory stance toward digital asset innovation in the United States, which could unlock a new wave of product development and capital formation. Traders should monitor whether the futures market’s open interest rebuilds on the long side—a sign of fresh conviction—or if the squeeze has exhausted near-term buying pressure.

    Frequently Asked Questions

    What triggered the latest Bitcoin rally above $87,000?
    The rally was driven by a combination of $593 million in net inflows into U.S. spot Bitcoin ETFs, a regulatory exemption for tokenized share trading by the SEC, improving macroeconomic conditions including falling Treasury yields, and a $785 million short squeeze in the futures market.
    How large were the futures liquidations during this move?
    Total liquidations reached $926 million in 24 hours, with $785 million in short positions and $142 million in long positions. Bitcoin accounted for $509 million and Ethereum for $198 million of the total.
    Does the SEC exemption mean all tokenized stocks are now legal in the U.S.?
    No. The SEC granted a five-year exemption to specific platforms for trading tokenized shares on blockchain. It is a targeted regulatory relief, not a blanket legalization of all tokenized securities.
  • Bitcoin Could Test $90,000 After Short Squeeze, but Traders Warn Leverage Is Building

    Bitcoin Could Test $90,000 After Short Squeeze, but Traders Warn Leverage Is Building

    Key Highlights

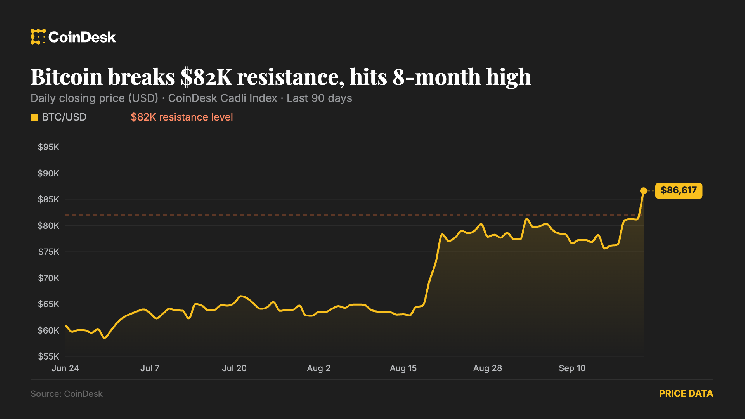
    • Bitcoin surged to an eight-month high of $86,000 on Monday, clearing the $82,000 resistance level that had capped prices since August and triggering roughly $750 million in bearish derivative liquidations.
    • Futures open interest rose faster than price, with approximately $2 billion in new leveraged exposure added since the breakout, signaling aggressive fresh positioning even as short sellers were wiped out.
    • While renewed spot ETF demand and short covering drove the rally, crypto-native investor positioning has been slower to flip from bearish to bullish, according to Nansen analytics.

    Bitcoin Breaks Key Resistance at $82,000

    Bitcoin pushed to a fresh eight-month high of $86,000 on Monday, extending a rally that forced bearish traders out of their short positions and drew fresh leverage bets back into the market. The move cleared the $82,000 level that had acted as a ceiling for prices since August, unleashing a cascade of liquidations across crypto derivative markets.

    Short Liquidations Fuel Momentum

    Roughly $750 million in bearish crypto derivative positions were liquidated as bitcoin cleared $82,000, according to CoinGlass data. When short positions are liquidated, exchanges execute buy orders to close them, adding fuel to an already upward market. “Bitcoin up 5% this morning due to short perpetual futures contracts being liquidated,” Schwab’s head of crypto research Jim Ferraioli told CoinDesk.

    Leveraged Bets Return Aggressively

    Meanwhile, futures open interest — the value of outstanding derivatives bets — rose even faster than bitcoin’s price. Since the breakout, about $2 billion in new leveraged exposure has been added, according to Coinalyze data, suggesting traders are placing fresh bets even as shorts got wiped out. The rapid rebuild in open interest indicates strong conviction among market participants that the breakout has legs.

    ETF Demand vs. Crypto-Native Caution

    While the rally has been fueled by a mix of renewed ETF demand and short covering, crypto-native positioning has been slower to shift from bearish to bullish, according to crypto analytics firm Nansen’s senior research analyst, Nicolai Sondergaard. This divergence suggests that while institutional flows via exchange-traded products are driving near-term price action, the core crypto trading community remains cautious about the sustainability of the move.

    Why This Matters

    The $82,000 level had served as a critical technical barrier since August, and its decisive breach marks the first time bitcoin has traded above this threshold in eight months. The combination of massive short liquidations and a rapid $2 billion rebuild in open interest creates a feedback loop that can sustain upward momentum in the near term. However, the reluctance of crypto-native traders to fully embrace the rally introduces a potential vulnerability: if ETF flows slow or macro conditions shift, the market may lack the deep conviction needed to hold gains. Market participants will be watching whether open interest continues to expand alongside price — a sign of healthy trend development — or if the current leverage buildup sets the stage for a volatile unwind.

    Frequently Asked Questions

    What triggered Bitcoin’s surge to $86,000?

    The rally was driven by a combination of renewed spot Bitcoin ETF demand and a massive short squeeze. As Bitcoin cleared the $82,000 resistance level — a ceiling since August — roughly $750 million in bearish derivative positions were liquidated, forcing exchanges to execute buy orders that accelerated the move higher.

    How much new leverage has entered the market since the breakout?

    According to Coinalyze data, approximately $2 billion in new leveraged exposure has been added to futures open interest since Bitcoin broke above $82,000, with open interest rising faster than price itself.

    Are crypto-native traders bullish on this move?

    Not yet. Nansen senior research analyst Nicolai Sondergaard notes that crypto-native positioning has been slower to shift from bearish to bullish, suggesting the core trading community remains cautious despite the price breakout and ETF-driven inflows.

  • Bitcoin Surges 44% in Q3, Signaling Potential Full-Blown Crypto Bull Run

    Bitcoin Surges 44% in Q3, Signaling Potential Full-Blown Crypto Bull Run

    Key Highlights

    • Bitcoin surged 44% in Q3 2025, marking its strongest quarterly performance since Q4 2024, significantly outpacing gold (+8.7%), the S&P 500 (+2%), and the Nasdaq (+2%).
    • Despite the rally, Bitcoin remains 48% below its all-time high of $126,000 set in October 2024, while major altcoins including ETH, XRP, SOL, UNI, and NEAR posted gains between 40% and 150%.
    • The initial recovery was fueled by oversold conditions and a short squeeze, but a emerging regulatory tailwind has recently provided additional momentum for the cryptocurrency complex.

    Bitcoin Leads Asset Class Performance in Third Quarter

    As the third quarter draws to a close, Bitcoin has emerged as the standout performer across major asset classes, climbing approximately 44% to trade near $84,753. Data from TradingView confirms the cryptocurrency’s dominance over traditional benchmarks: gold advanced 8.7%, while the S&P 500 and the tech-heavy Nasdaq Composite each managed only a 2% gain. The reversal is striking given the market dynamics at the start of the year, when equities—propelled by artificial intelligence enthusiasm—outpaced digital assets by a wide margin.

    Outpacing Mega-Cap Tech Including Nvidia

    The scale of Bitcoin’s outperformance extends to individual equity giants. Nvidia (NVDA), one of the world’s largest companies by market capitalization and a primary beneficiary of the AI investment wave, has risen roughly 11% over the same period. Bitcoin’s nearly fourfold advantage over the semiconductor leader underscores a pronounced shift in risk appetite and capital rotation toward digital assets during the quarter.

    Valuation Context: Still Well Below Record Highs

    Despite the robust quarterly advance, Bitcoin does not appear extended on a historical basis. The cryptocurrency remains approximately 48% below its all-time high of $126,000 reached in October 2024. This gap suggests substantial room for further recovery before previous peaks are retested, a factor likely supporting the narrative that the current rally represents a normalization rather than a speculative excess.

    Broad-Based Altcoin Strength Signals Risk-On Rotation

    The gains are not confined to Bitcoin. Major alternative tokens have recorded even larger percentage advances. Ether (ETH), XRP, Solana (SOL), Uniswap (UNI), and Near Protocol (NEAR) have each posted quarterly returns ranging from 40% to 150%. The breadth of the move indicates a broad-based risk-on rotation within the digital asset ecosystem rather than a Bitcoin-specific flight to safety.

    From Technical Overshoot to Regulatory Tailwind

    Market analysts attribute the initial phase of the recovery to deeply oversold technical conditions that attracted bargain hunters, amplified by a short squeeze that accelerated price appreciation. More recently, however, a regulatory tailwind has emerged as a fundamental catalyst. While the source does not specify particular policy developments, the shift suggests that evolving regulatory clarity—or the perception thereof—is beginning to underpin the technical recovery with a more durable structural bid.

    Why This Matters

    The third quarter performance marks a critical inflection point for digital assets. After a prolonged period where equity markets—particularly AI-exposed mega-caps—dominated returns, capital appears to be rotating back toward crypto as a distinct, high-beta asset class. The fact that Bitcoin outperformed both traditional safe havens (gold) and growth benchmarks (S&P 500, Nasdaq, Nvidia) simultaneously suggests a repricing of crypto’s role in diversified portfolios. With prices still significantly below the October 2024 peak, the setup favors continued recovery if the regulatory environment remains constructive. Upcoming quarterly earnings from crypto-exposed public companies and any further policy signals from major jurisdictions will be key drivers for Q4 momentum.

    Frequently Asked Questions

    How much has Bitcoin risen in Q3 2025?
    Bitcoin has gained approximately 44% in the third quarter, trading near $84,753 as the quarter ends.
    Is Bitcoin at a new all-time high?
    No. Despite the quarterly rally, Bitcoin remains about 48% below its record high of $126,000 set in October 2024.
    What drove the initial phase of the rally?
    The initial recovery was primarily driven by oversold technical conditions that attracted bargain hunters and a short squeeze that pushed prices higher.
  • Bitcoin Hits $85,000 as Short Squeeze Liquidates $648 Million in Bearish Bets

    Bitcoin Hits $85,000 as Short Squeeze Liquidates $648 Million in Bearish Bets

    Key Highlights

    • Bitcoin surged 5.4% to $84,984, breaking decisively above the September range high of $82,284 set on Sept. 4.
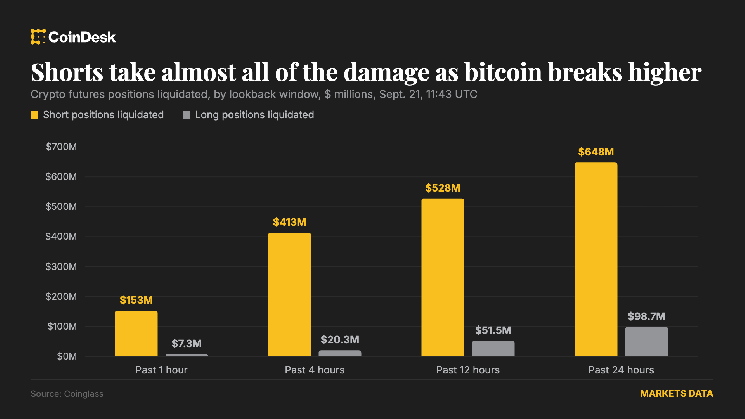
    • The rally was fueled primarily by a massive short squeeze, with $746 million in positions liquidated over 24 hours—$647.9 million of them shorts.
    • Open interest rose 7.59% to $156 billion and volume jumped 39% to $224 billion, indicating traders are re-establishing positions rather than exiting the market.

    Bitcoin Breaks September Resistance on Heavy Short Liquidations

    Bitcoin BTC extended its breakout above the top of its September trading range on Monday, changing hands at $84,984 during the late European morning session. The move represents a 5.4% gain over the prior 24 hours and leaves the asset well clear of the $82,284 high recorded on Sept. 4, which had previously capped upside attempts throughout the month.

    Forced Buying Drives Momentum Rather Than Fresh Conviction

    According to market analysts and data from Coinglass, the rally is being propelled predominantly by forced buying stemming from a cascading short squeeze rather than an influx of new long-side conviction. Over the past 24 hours, $746 million in total positions were liquidated, of which $647.9 million were short positions. In the most recent hour alone, an additional $159.9 million in positions were wiped out, with 95% of those liquidations on the short side.

    Bitcoin shorts accounted for $277.5 million of the 24-hour liquidation total, while Ether (ETH) shorts contributed $122.8 million. The disproportionate short-side washout underscores a market that was heavily positioned for downside or range-bound price action, leaving bears vulnerable to a sharp upside repricing.

    Open Interest and Volume Signal Position Replenishment

    Despite the massive short covering, open interest across the market has risen 7.59% to $156 billion, and 24-hour trading volume has surged 39% to $224 billion. This combination—rising open interest alongside heavy liquidations—suggests that traders are actively replacing the positions being closed out rather than stepping back from the market. The data points to a structural repositioning, with new participants or existing players re-entering on the long side as the breakout confirms.

    Why This Matters

    The break above the September range high marks a technically significant development for Bitcoin, which had been consolidating in a relatively tight band for weeks. The fact that the move was catalyzed by a short squeeze rather than organic spot buying introduces a degree of fragility: if the forced buying exhausts itself without follow-through from spot accumulators, a pullback toward the former resistance—now potential support—around $82,000 could materialize. However, the concurrent expansion in open interest and volume suggests the market is not merely covering shorts but rebuilding directional exposure. Traders will be watching closely for sustained spot bid interest, funding rate normalization, and whether the $85,000 level can flip to support in the coming sessions. The next key technical hurdle lies near the late-July highs around $87,500–$88,000.

    Frequently Asked Questions

    What triggered Bitcoin’s break above the September range?

    The breakout was driven primarily by a massive short squeeze, with $746 million in positions liquidated over 24 hours—$647.9 million of them shorts—forcing bearish traders to buy back positions and accelerating upside momentum.

    Does rising open interest during a short squeeze signal bullish continuation?

    Yes. The 7.59% increase in open interest to $156 billion, combined with a 39% volume surge to $224 billion, indicates traders are replacing liquidated shorts with new long positions rather than exiting the market, suggesting conviction behind the move.

    What are the key levels to watch after this breakout?

    Immediate support now sits at the former September high of $82,284. Upside targets include the late-July highs near $87,500–$88,000. Sustained spot buying and funding rate normalization will be critical for follow-through.

  • Bitcoin and Altcoin Rally Extends: BTC Hits Eight-Month High Amid Liquidations Update

    Bitcoin and Altcoin Rally Extends: BTC Hits Eight-Month High Amid Liquidations Update

    Key Highlights

    • Bitcoin surged 2.5% in one hour to breach $85,000 for the first time since January 30, posting a 9.1% weekly gain and nearing a 30% monthly increase.
    • Ethereum rallied 6% to surpass $2,730, while top altcoin gainers included Sui (22.3%), Venice Token (22%), and Sei (20%) over the last 24 hours.
    • A short-squeeze liquidated approximately $400 million in leveraged positions within hours, contributing to a 24-hour total of $750 million across 136,931 traders.

    Bitcoin Breaks $85,000 as Broad Crypto Rally Accelerates

    Bitcoin extended its recovery on Tuesday, climbing above the psychologically significant $85,000 threshold for the first time since January 30. The flagship cryptocurrency added 2.5% in a single hour, lifting its seven-day advance to 9.1% and its 30-day gain to nearly 30%. The move comes despite lingering macroeconomic headwinds, including last week’s negative developments surrounding the Clarity Act and Federal Reserve policy signals, suggesting that internal market dynamics are currently outweighing external regulatory and monetary concerns.

    Oil Decline Correlates with Risk-On Sentiment

    Market analysts noted that the cryptocurrency rally coincides with a four-day slide in international oil prices. The drop in energy costs has historically eased inflation expectations, fostering a more favorable environment for risk-on assets such as equities and digital currencies. This correlation appears to be fueling renewed buying pressure across the board, with Bitcoin acting as the primary catalyst for broader market participation.

    Altcoins Outperform as Ethereum Reclaims $2,700

    Ethereum led the major altcoin charge, surging 6% over the past 24 hours to trade above $2,730—its first visit above the $2,700 level since the end of January. Other layer-one protocols posted strong gains, with XRP advancing 6.6%, Solana climbing 7%, and HyperLiquid (HYPE) rising approximately 4%. The breadth of the rally indicates improving sentiment across multiple blockchain ecosystems rather than a Bitcoin-only phenomenon.

    Mid-Cap Tokens Lead Percentage Gainers

    According to CoinMarketCap data, the most explosive moves occurred in the mid-cap segment. The platform reported the following 24-hour leaders: “Sui (SUI – 22.3%), Venice Token (VVV – 22%), Sei (SEI – 20%), Near Protocol (NEAR – 19.9%), Render (RENDER – 17.9%) and Avalanche (AVAX – 13.9%)”. These outsized returns highlight speculative appetite returning to higher-beta assets, often a hallmark of early-stage bull market rotations.

    Short Liquidations Fuel Price Discovery

    The rapid ascent triggered a massive unwinding of bearish leverage. Approximately $400 million worth of leveraged trades were liquidated in the space of a few hours, with the vast majority representing short positions. Over the full 24-hour window, total liquidations reached $750 million, affecting 136,931 individual accounts. The single largest liquidation occurred on Binance’s BTC/USDT perpetual contract, valued at $11.29 million, underscoring the intensity of the short squeeze on the dominant trading venue.

    Why This Matters

    The simultaneous breakout in Bitcoin and Ethereum, combined with aggressive short covering and broad altcoin participation, suggests a potential regime shift from consolidation to trend expansion. The $85,000 level for Bitcoin has acted as stiff resistance since January; a sustained close above it could invite fresh institutional and retail inflows. Meanwhile, the scale of short liquidations—$750 million in 24 hours—indicates that a significant portion of the market was positioned for further downside, creating structural fuel for continued upside if momentum persists. Traders will now watch for follow-through volume and whether the Clarity Act and Fed narratives reassert influence in the coming sessions.

    Frequently Asked Questions

    What triggered the latest Bitcoin surge above $85,000?
    The rally appears driven by a combination of falling oil prices improving risk sentiment, a sharp short squeeze liquidating $400 million in bearish bets within hours, and broad-based buying across major and mid-cap altcoins.
    Which altcoins posted the largest 24-hour gains?
    Per CoinMarketCap, the top performers were Sui (SUI) at 22.3%, Venice Token (VVV) at 22%, Sei (SEI) at 20%, Near Protocol (NEAR) at 19.9%, Render (RENDER) at 17.9%, and Avalanche (AVAX) at 13.9%.
    How significant were the liquidations?
    Total liquidations reached $750 million over 24 hours, impacting 136,931 traders. The largest single liquidation was an $11.29 million BTC/USDT position on Binance, highlighting the force of the short-covering rally.

    *This is not investment advice.

  • Solana Surges to $112 as BSOL Trading Volume Hits $85 Million

    Solana Surges to $112 as BSOL Trading Volume Hits $85 Million

    Key Highlights

    • Solana (SOL) surged 11% to $112, its highest level since January, driven by a massive short squeeze liquidating $36.72 million in bearish derivative positions.
    • The Bitwise Solana Staking ETF (BSOL) jumped 12.04% to $15.54 with $85 million in trading volume, signaling strong institutional appetite for structured staking products.
    • Ecosystem fundamentals strengthened with Project Harmonia linking Solana to Allfunds (€1.9T AUM), tokenized real-world assets exceeding $4 billion, and MoneyGram expanding to 170+ territories.

    SOL Price Breaks $112 as Short Squeeze Triggers Derivative-Led Rally

    Solana’s native token SOL rallied 11% within 24 hours to reach $112 per unit on Friday, marking its highest valuation since January. The sharp ascent was not a spot-market anomaly but a derivative-fueled move underscored by extreme positioning imbalances. According to market data, total liquidations across SOL-linked contracts hit $38.21 million in a single day, with an overwhelming $36.72 million—approximately 96%—stemming from short positions. Only $1.48 million in long liquidations were recorded, confirming a classic short-squeeze dynamic that forced bearish traders to cover at progressively higher prices.

    Bitwise Solana Staking ETF Sees Record Intraday Volume

    Amplifying the bullish momentum, the Bitwise Solana Staking ETF (BSOL) advanced 12.04% to $15.54 per share, printing an intraday trading volume of roughly $85 million. Analysts cited by the source suggest that rising institutional interest in structured staking vehicles is acting as a direct catalyst for underlying asset liquidity. The ETF’s performance mirrors a broader shift: futures volume on SOL reached $12.14 billion over 24 hours, dwarfing the $1.49 billion recorded in spot order books. CoinGlass metrics place global open interest in SOL futures near $7 billion, indicating that leveraged derivatives remain the primary price-discovery venue for the asset.

    Institutional Infrastructure Expands via Project Harmonia and RWA Growth

    Friday’s price action coincided with a cluster of fundamental milestones. The Solana Foundation this week unveiled Project Harmonia, a strategic integration connecting the network’s infrastructure with Allfunds, the world’s largest fund distribution network. Allfunds manages nearly €1.9 trillion in assets and interconnects more than 3,300 investment managers and financial institutions, potentially opening a massive traditional-finance distribution channel for Solana-based products.

    In parallel, on-chain data reveals that the total value of tokenized real-world assets (RWA) on Solana has surpassed $4 billion, with the number of addresses holding such instruments exceeding 350,000 active accounts. The xStocks platform alone reported more than $500 million in assets under management. Payment rails are also widening: MoneyGram Ramps recently enabled services on Solana, allowing fiat deposits from over 25 countries and cash withdrawals across more than 170 territories.

    Protocol Upgrade Targets Sub-200-Millisecond Block Times

    On the technical front, core developers are executing a staggered reduction in slot duration—from the current 400 milliseconds toward a final target of 200 milliseconds. Specifications disclosed in August outline the phased approach, and the community’s attention is now fixed on the completion of the testing phase scheduled for late September. That milestone will evaluate the protocol’s performance under high transaction demand, a critical stress test as the network onboards institutional-grade throughput requirements.

    Why This Matters

    The convergence of a violent short squeeze, record ETF volume, and accelerating institutional infrastructure marks a potential regime change for Solana. For months, the narrative centered on retail-driven memecoin activity and periodic network outages. Friday’s data suggests a structural shift: derivatives markets are deepening, traditional asset managers are plugging in via Allfunds, and real-world asset tokenization is crossing the $4 billion threshold. If the September block-time upgrade delivers as planned, Solana will offer a combination of speed, institutional connectivity, and regulated product access—BSOL being the first U.S.-listed staking ETF—that few competing layer-1 blockchains can match. The next catalyst watchpoints are the September testnet results, BSOL flow data, and whether RWA issuance sustains its exponential trajectory.

    Frequently Asked Questions

    What caused Solana’s 11% price jump to $112?
    A massive short squeeze in the derivatives market forced the liquidation of $36.72 million in short positions—96% of total liquidations—driving spot prices higher as bearish traders rushed to cover.
    How significant is the Bitwise Solana Staking ETF (BSOL) volume?
    BSOL traded approximately $85 million in a single session alongside a 12.04% price gain, indicating strong institutional demand for regulated, yield-bearing Solana exposure and suggesting ETF flows are now a material liquidity driver for SOL.
    What is Project Harmonia and why does it matter?
    Project Harmonia is a Solana Foundation initiative that integrates the blockchain with Allfunds, the world’s largest fund distribution network (€1.9T AUM, 3,300+ institutions). It creates a direct pipeline for traditional asset managers to distribute Solana-based financial products.
  • Bitcoin Briefly Tops $81,000 as Bad News Stops Working

    Bitcoin Briefly Tops $81,000 as Bad News Stops Working

    Key Highlights

    • Bitcoin surged approximately 6% on Friday to briefly trade above $81,000, absorbing five major macroeconomic and regulatory headwinds—including a failed Senate vote on the CLARITY Act, a Federal Reserve rate hike, and a Bank of Japan rate increase—without a sustained selloff.
    • The rally was driven predominantly by short covering: $470 million in short positions were liquidated versus only $60 million in longs, while aggregate open interest fell 1.4%, signaling position compression rather than fresh leveraged buying.
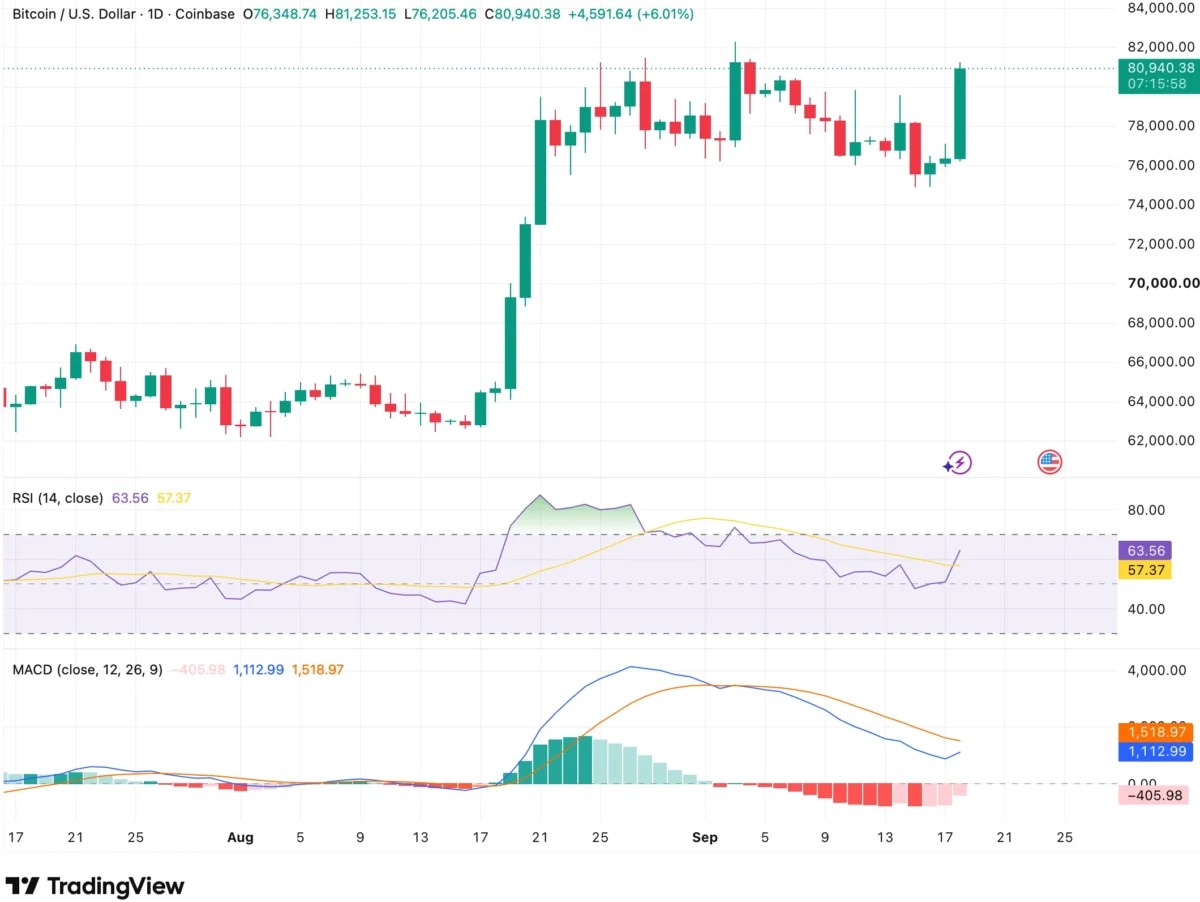
    • Technical momentum is improving (14-day RSI at 63.56, above its moving average), but the daily MACD remains below its signal line, leaving the move unconfirmed by slower momentum indicators.

    Bitcoin Defies Concentrated Macro Headwinds

    Bitcoin staged a sharp intraday reversal on Friday, climbing roughly 6% to a session high of $81,253 on the Coinbase daily chart before settling near $80,940 at the time of writing. The advance is notable not for its magnitude but for the backdrop against which it occurred: within a single week, the market digested a procedural failure on the CLARITY Act in the U.S. Senate (49–50, short of the 60 votes needed for cloture), the Federal Reserve’s first rate increase since 2023 (lifting the target range to 3.75%–4.00%), the Bank of Japan’s policy rate hike to 1.25% (a 31‑year high), a U.S. Dollar Index reclaiming the 100 level, and Brent crude holding above $100 per barrel. Each of these developments typically pressures risk assets—higher rates boost the appeal of yield‑bearing alternatives, a stronger dollar tightens global financial conditions, and elevated oil sustains inflationary impulses—yet Bitcoin not only refused to extend its earlier decline toward $76,000 but accelerated higher.

    Derivatives Data Reveal Short‑Covering Dynamics

    Friday’s derivatives metrics provide a clearer mechanical explanation than any single bullish catalyst. According to Coinglass data, roughly $530 million in leveraged crypto positions were liquidated over 24 hours, with short positions accounting for approximately $470 million of that total versus only $60 million in long liquidations. Simultaneously, aggregate open interest declined 1.4% to $453.43 billion while 24‑hour derivatives volume rose 2.2% to nearly $936 billion. This combination—rising price, falling open interest, and disproportionately large short liquidations—is consistent with position compression: traders positioned for further downside were forced to buy back as Bitcoin rallied, amplifying the move. The breadth of the advance underscores the systemic nature of the squeeze; Ethereum gained 5.3%, XRP 6.2%, Solana 10.4%, and HYPE more than 11%, lifting total crypto market capitalization about 5% to $2.76 trillion.

    Short Squeezes Are Self‑Limiting

    While the liquidation cascade explains the velocity of Friday’s rally, it does not guarantee durability. Forced covering creates mechanical demand that evaporates once bearish positions are exhausted. The critical question is whether underlying spot demand—evidenced by sustained exchange trading activity, continued ETF inflows, or stable open interest rebuilding—persists after the liquidation impulse fades. Absent that, the rally remains a positioning unwind rather than a new demand regime.

    Technical Momentum Improves But Lags Price Action

    Bitcoin’s daily chart offers a second lens on sustainability. The 14‑day Relative Strength Index has climbed to 63.56, comfortably above its moving average at 57.37 and well clear of the conventionally overbought 70 threshold, indicating strengthening momentum without exhaustion. The Moving Average Convergence Divergence, however, tells a more cautious story: the MACD line has turned upward to 1,112.99 but remains below the signal line at 1,518.97, leaving the histogram negative at –405.98. The histogram bars have been contracting and the MACD line curling higher, suggesting the direction is improving, but a bullish crossover has not yet occurred. This divergence—price accelerating while the slower daily momentum indicator has not fully confirmed—creates a clear watchpoint: a MACD crossover would signal that momentum broadening is underway rather than remaining concentrated in a single explosive session.

    Historical Parallel: 2023 Regime Shift Echoes

    The current dynamic bears a striking resemblance to Bitcoin’s behavior throughout 2023. During that period, the asset absorbed aggressive Federal Reserve tightening (the target range ultimately reaching 5.25%–5.50%) alongside an intensive U.S. regulatory campaign that saw the SEC sue Coinbase and Binance and designate several major tokens as securities. Despite repeated negative headlines, each successive shock generated diminishing incremental selling pressure, and Bitcoin gradually ceased revisiting the lows established after the 2022 collapse. The lesson from 2023 is not that restrictive policy or enforcement actions became bullish, but that the market’s capacity to produce new sellers in response to them was waning. Markets can begin shifting before the news flow turns favorable, and Friday’s price action—absorbing five simultaneous headwinds without a net decline—suggests a similar recalibration may be in progress.

    Why This Matters

    The week’s events highlight a potential inflection point in Bitcoin’s market structure. For years, macro tightening and regulatory uncertainty acted as reliable catalysts for drawdowns. The failure of that playbook in the face of a concentrated barrage of negative catalysts—failed legislation, dual central‑bank hikes, dollar strength, and elevated energy prices—signals that the marginal seller may be exhausted. If spot demand proves resilient, leverage remains contained, and momentum indicators like the MACD confirm the RSI’s strength, the market could be transitioning to a regime where bad news is increasingly “priced in” and produces diminishing downside volatility. This has direct implications for portfolio allocation, risk management, and the narrative around Bitcoin’s maturation as a macro asset. Institutional participation metrics (ETF flows, custody data) and derivatives market structure (open interest trends, funding rates) will be the primary arbiters of whether this is a durable shift or a temporary positioning anomaly.

    Frequently Asked Questions

    What specifically drove Bitcoin’s 6% rally on Friday?

    The primary driver was a massive short‑covering event: approximately $470 million in short positions were liquidated in 24 hours, forcing bearish traders to buy back Bitcoin and accelerating the price rise. Aggregate open interest fell, confirming that the rally stemmed from position unwinding rather than new leveraged long entries.

    Is this rally sustainable or just a short squeeze?

    Sustainability hinges on whether genuine spot demand persists after the forced buying ends. Key signals to watch include continued ETF inflows, stable or gradually rebuilding open interest (rather than a surge in aggressive longs), and a bullish MACD crossover on the daily chart confirming broadening momentum.

    How does this week compare to previous macro stress periods for Bitcoin?

    The closest analogue is 2023, when Bitcoin absorbed simultaneous Fed tightening and SEC enforcement actions with progressively smaller drawdowns. In both episodes, the market’s reaction function to negative news appeared to change—selling pressure diminished even as the fundamental headwinds persisted—suggesting a structural shift in participant positioning and risk appetite.

  • Bitcoin Surpasses $80,000 Amid Bullish Sentiment; Chinese Analyst Forecasts Next Moves

    Bitcoin Surpasses $80,000 Amid Bullish Sentiment; Chinese Analyst Forecasts Next Moves

    Key Highlights

    • Bitcoin surged past $80,000 to trade near $81,000, triggering over $457 million in short-position liquidations over 24 hours.
    • Prominent miner Jiang Zhuoer forecasts a potential test of the $83,000–$84,000 resistance zone before a sharp correction to $72,000–$74,000.
    • Short positions accounted for 89% of total liquidations in the past 24 hours, signaling a aggressive bearish squeeze.

    Bitcoin Breaks $80,000 Barrier as Short Squeeze Accelerates

    Bitcoin ($BTC) surged above the psychologically significant $80,000 level in recent trading hours, climbing rapidly from a consolidation range near $78,000 to reach approximately $81,000. The sharp upward move unleashed a wave of forced liquidations across cryptocurrency derivatives markets, with short positions bearing the brunt of the losses. According to on-chain and exchange data, the rally has wiped out hundreds of millions of dollars in bearish bets, underscoring the fragility of leveraged short exposure at current price levels.

    Jiang Zhuoer Projects Next Resistance at $83,000–$84,000

    Jiang Zhuoer, a well-known Chinese cryptocurrency miner and market analyst, noted in his latest analysis that Bitcoin has validated his earlier thesis by recovering without breaching the $75,000 support level. Zhuoer stated that the velocity of the current ascent increases the probability of Bitcoin testing the strong resistance zone between $83,000 and $84,000 in the next phase. However, he cautioned that such a move would likely set the stage for a subsequent sharp correction, as the liquidation of short positions at those elevated levels could exhaust buying momentum and trigger a reversal.

    Analyst Warns of Correction Toward $72,000–$74,000 After Resistance Test

    Zhuoer believes that once short positions are flushed out near the $83,000–$84,000 region, Bitcoin could retreat toward the $72,000–$74,000 range. This pullback, he argues, would then target long positions accumulated during the rally, creating a two-sided liquidation event that could reset market structure. The miner’s framework suggests a classic high-leverage washout pattern: an initial short squeeze to clear overhead supply, followed by a deep retracement to cleanse excessive long leverage before the next directional move.

    Liquidation Data Reveals Magnitude of Short Squeeze

    The scale of the short squeeze is evident in the liquidation metrics across major derivatives venues. In the most recent four-hour window, total liquidations reached $306.55 million, of which $286.14 million — approximately 93% — were short positions. Long liquidations during the same period amounted to just $20.41 million. Extending the horizon to 12 hours, total liquidations climbed to $411.62 million, with shorts accounting for $372.53 million versus $39.09 million for longs. Over the full 24-hour period, cumulative liquidations hit $515.05 million, with short positions representing $457.26 million (89%) and longs $57.79 million. The overwhelming skew toward short liquidations confirms that the rally was driven predominantly by forced covering rather than fresh spot demand.

    Why This Matters

    The current price action highlights the outsized influence of leveraged derivatives on Bitcoin’s short-term price discovery. With open interest remaining elevated across major exchanges, the market remains vulnerable to violent two-way moves as liquidation clusters act as magnetic price targets. Zhuoer’s projected $83,000–$84,000 resistance aligns with key technical levels, including prior local highs and dense liquidation clusters visible on exchange heatmaps. A successful breach could attract momentum-driven flows, but the subsequent correction risk to $72,000–$74,000 underscores the importance of risk management for leveraged traders. For longer-term holders, the sequence reinforces Bitcoin’s tendency to purge excess leverage before establishing sustainable trends.

    Frequently Asked Questions

    What triggered Bitcoin’s surge past $80,000?

    The rally appears to have been fueled by a short squeeze in the futures market, where rapidly rising prices forced bearish traders to buy back positions, amplifying upward momentum. Over $457 million in short positions were liquidated in 24 hours.

    What is Jiang Zhuoer’s price prediction for Bitcoin?

    Jiang Zhuoer expects Bitcoin to potentially test the $83,000–$84,000 resistance zone before correcting sharply to the $72,000–$74,000 range as long positions are subsequently liquidated.

    How significant were the recent liquidations?

    Extremely significant. In the last 24 hours, total liquidations reached $515.05 million, with short positions accounting for 89% ($457.26 million). The 4-hour window alone saw $286.14 million in short liquidations versus only $20.41 million in longs.

  • Top 3 Trending Cryptocurrencies Today: Lisk Surges 764.7% as Pons Declines

    Top 3 Trending Cryptocurrencies Today: Lisk Surges 764.7% as Pons Declines

    CoinGecko Trending Crypto Rankings Highlight Surge in Smaller Tokens Over Bitcoin

    On September 14, 2026, CoinGecko’s Top Trending Cryptocurrencies ranking reveals a notable shift in market attention toward smaller, more volatile tokens rather than established large-cap assets like Bitcoin ($BTC). The data shows dramatic weekly movements across several trending cryptocurrencies, raising questions about whether these spikes reflect genuine momentum or speculative liquidity cycles.

    Lisk ($LSK) Leads With 764.7% Weekly Surge Driven by Short Squeeze

    Lisk ($LSK) dominates the trending list after gaining 16.0% in the past 24 hours and approximately 764.7% over seven days. According to derivatives data, this explosive move was primarily fueled by a violent short squeeze on September 13, which triggered $35–41 million in total liquidations—the largest of any token that day. The vast majority, $33–36 million, came from short positions being forcibly closed.

    The liquidated shorts forced buying into a self-reinforcing rally on relatively thin liquidity, amplifying the price action. This mechanism illustrates how leveraged positions can create outsized percentage moves in lower-cap assets.

    Lighter ($LIT) Gains Traction in Perpetual DEX Sector

    $LIT, the native token of a high-performance decentralized perpetual futures exchange built as an application-specific zk-rollup on Ethereum, is also ranking high in trending searches. At press time, $LIT was trading around 4.56, up about 9% in the last 24 hours and approximately 4.4% over the last seven days, accompanied by strong trading volume.

    Lighter’s momentum stems from its positioning in the competitive perpetual DEX sector, broader interest in DeFi trading infrastructure, rising platform volume, and ecosystem integrations. The weekly performance and search attention have positioned $LIT among the more viewed mid-cap tokens as traders rotate toward active trading-related assets.

    Other Notable Movers in Trending Rankings

    Current top names in CoinGecko’s trending list include:

    • $STONK — down 25.9%
    • $LIT — up 9.7%
    • Pudgy Penguins (PENGU) — down 1.8%
    • $PONS — down 4.4%
    • Bittensor (TAO) — down 1.1%
    • Bitway (BTW) — up 35.2%
    • $LSK — up 16.0%

    Pons ($PONS) Enters Post-Parabolic Cooling Phase

    Pons, the native token of the leading non-custodial token launchpad on Robinhood Chain, has seen a classic post-parabolic cooling phase following an extraordinary run. Currently trading at approximately $0.53–$0.54, it holds a market capitalization of around $380–$385 million with a circulating supply of about 712 million tokens following massive token burns.

    In the last 24 hours, $PONS has shown mixed short-term movements, while the 7-day chart remains bullish at roughly +29–30%. The 30-day gain exceeds 1200%, underscoring the magnitude of the earlier rally. Nevertheless, the token sits approximately 44–45% below its peak price of around $0.97 set on September 5, 2026.

    This transition from pure momentum to a more measured—yet still volatile—phase signals that the most intense speculative wave has cooled.

    What CoinGecko’s Trending Crypto Ranking Actually Measures

    CoinGecko’s “Top Trending Cryptocurrencies” ranking is a real-time attention metric, not a performance or quality ranking. The list is based on the number of searches made by CoinGecko users in the past 3 hours, reflecting immediate spikes in interest and attention.

    It does not measure:

    • Trading volume
    • Liquidity
    • Price performance
    • Market capitalization
    • Fundamentals
    • Tokenomics
    • On-chain metrics

    Trending status typically serves as an early indicator of interest and can be driven by social-media activity, a big price swing, a news story, a short squeeze, or meme speculation.

    Are Traders Rotating Toward Smaller, Riskier Tokens?

    CoinGecko’s current trend data shows a strong focus on mid- to low-cap, more volatile tokens rather than the largest and most established digital assets. Many of these tokens are far smaller than Bitcoin or Ethereum in terms of market capitalization but exhibit sharp percentage moves. This pattern reflects a common market phase in which speculative capital rotates into lower-liquidity, narrative-driven tokens.

    Key Due Diligence Checks Before Buying a Trending Crypto Coin

    Before buying a trending crypto coin, investors should evaluate:

    • Liquidity and trading volume — Can you enter and exit positions without excessive slippage?
    • Tokenomics and supply dynamics — Inflation schedule, unlocks, burns, and distribution.
    • Holder concentration — Whale dominance increases manipulation risk.
    • Contract security and audits — Verified code reduces exploit exposure.
    • Project fundamentals and utility — Real use case versus pure speculation.
    • Market context and risk factors — Macro conditions, sector narratives, regulatory environment.
    • Personal risk management — Position sizing, stop-losses, and portfolio allocation limits.

    Trending is a sign of attention—and should not be the only reason for purchase.

  • Altcoin Price Surges 11-Fold

    Altcoin Price Surges 11-Fold

    Lisk (LSK) Surges Over 500% in 24 Hours, Triggering $38 Million in Liquidations

    Lisk ($LSK) emerged as one of the most volatile altcoins in the cryptocurrency market over the past 24 hours, posting an intraday price surge of 512.7% before a sharp pullback. The token reached a high of $1.71 before retracing to approximately $0.98, according to market data.

    Record Liquidations and Short Squeeze

    Coinglass data indicates that approximately $38.37 million worth of $LSK positions were liquidated in the last 24 hours, making Lisk the market leader for liquidation volume during the session. On-chain analysis platforms noted the price climbed from a low of $0.20 to a peak of $2.37—an 11-fold gain from the session low. Roughly $36 million in short positions were wiped out during the rapid ascent, signaling a severe short squeeze.

    Alleged CEO Wallet Moves 3.3 Million LSK to Binance

    Following the price spike, on-chain investigators flagged a notable transfer from a wallet allegedly linked to Lisk management. Approximately five hours after the sharp rise, an address believed to belong to Lisk CEO Max Kordek transferred 3.3 million $LSK to Binance. The transferred tokens were valued at approximately $3.79 million at the time of the transaction. Analysts noted this address used the same Binance deposit address previously utilized by the Lisk CEO for gas fees.

    Ecosystem Transformation and Token Supply Reduction

    The extreme price action coincides with a comprehensive restructuring of the Lisk ecosystem. Key developments include:

    • Strategic Pivot: Lisk announced a shift toward a treasury and fund operations platform targeting business finance teams.
    • Lisk Chain Shutdown: The existing Lisk Chain is scheduled to be shut down on October 31st. Existing applications have the option to migrate to the Celo network.
    • DAO Termination: The Lisk DAO has accepted a proposal to terminate the DAO structure.
    • Token Burn: The project initiated a process to burn 100 million $LSK. If completed, the total supply will decrease from 400 million to 300 million tokens.

    Disclaimer: This article is for informational purposes only and does not constitute investment advice.