Tag: Price breakout

  • NEAR Hits New ‘All-Time High’ in TVL, But What About Its Price?

    NEAR Hits New ‘All-Time High’ in TVL, But What About Its Price?

    Key Highlights

    • NEAR Protocol surges over 10% in 48 hours, breaking the $3.2–$3.4 supply zone to print a new local swing high at $3.9 while trading above all key Exponential Moving Averages.
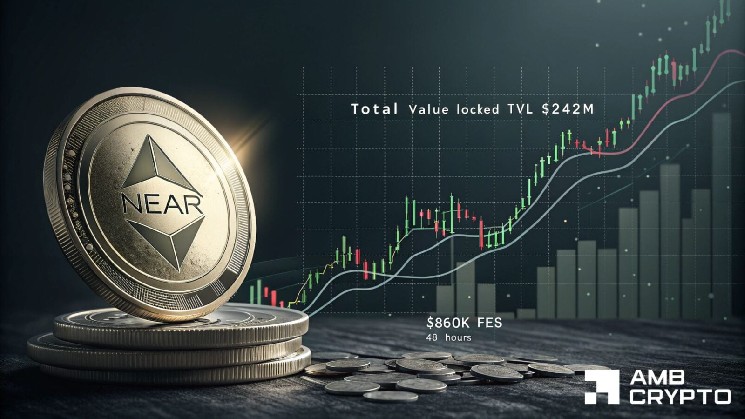
    • Network fundamentals hit record strength: Total Value Locked (TVL) reaches an all-time high of $242 million and protocol fees climb to $860,000 over the same period, per DefiLlama data.
    • NEAR satisfies all criteria for its anticipated milestone airdrop as of September 19, with TVL having crossed $70 million and price clearing $3.3, adding a fundamental catalyst to the technical breakout.

    NEAR Protocol Leads Crypto Market Rebound with Double-Digit Gains

    NEAR emerged as one of the cryptocurrency market’s biggest beneficiaries over the last 48 hours as the wider sector flashed green. The token recorded gains exceeding 10%, propelled by improving network activity that provided fundamental backing for the rally. This explosive bullish push cleared NEAR’s supply zone between $3.2 and $3.4 and printed a new local swing high at $3.9. With the token now trading above all key Exponential Moving Averages, market participants are assessing whether network bulls can sustain the momentum.

    On-Chain Fundamentals Underpin Price Surge

    Latest on-chain metrics reveal that fundamentals for NEAR Protocol have been robust over time. To be specific, the blockchain’s Total Value Locked set another record high of $242 million while network fees soared over the last 48 hours. This hike may be evidence that more capital is pouring into NEAR’s ecosystem. Additionally, NEAR protocol’s fees hit the $860,000-mark over the same period. Cumulatively, the hike in capital inflows into the network and fee generation may be a sign of growing activity across the ecosystem, according to data sourced from DefiLlama.

    Airdrop Milestone Adds Catalyst to Bullish Narrative

    Still, it is worth noting that 19th September marks the first day since NEAR ticked all the boxes for the anticipated milestone airdrop. The token’s TVL crossed the $70 million-mark two days ago while yesterday’s rally pushed the token’s price above $3.3. This convergence of technical breakout, record on-chain activity, and airdrop eligibility creates a multi-layered bullish case that distinguishes NEAR from peers relying solely on speculative momentum.

    Technical Outlook: Bulls Face Profit-Taking Test

    NEAR’s ability to maintain the prevailing momentum will depend on whether buyers continue to support the token after its 10% daily hike. A sustained rally alongside further growth in TVL and network fees would keep the bullish structure intact and could bring higher price levels into focus. Conversely, a rise in profit-taking could force NEAR to consolidate and retest nearby support. As it stands, the network’s long-term on-chain sentiments point to a potential bullish continuation. However, a short-term correction from the anticipated profit-taking cannot be ignored completely.

    Why This Matters

    The NEAR Protocol rally exemplifies a growing market trend where price action is increasingly tied to verifiable on-chain fundamentals rather than pure speculation. The simultaneous achievement of an all-time high in TVL ($242 million), a surge in protocol revenue ($860,000 in 48 hours), and the satisfaction of airdrop criteria signals genuine ecosystem adoption. For investors and developers, this suggests NEAR’s sharded proof-of-stake architecture is attracting meaningful capital and usage—critical for long-term viability in the competitive Layer-1 landscape. The upcoming days will test whether the protocol can convert speculative inflows into sticky liquidity, a key determinant of whether the $3.9 high becomes a launchpad or a local top.

    Frequently Asked Questions

    What triggered NEAR’s recent price surge above $3.9?
    The surge was driven by a combination of broad crypto market recovery, NEAR clearing a key $3.2–$3.4 supply zone, and strong on-chain fundamentals including record TVL of $242 million and $860,000 in protocol fees over 48 hours.
    Has NEAR qualified for its anticipated milestone airdrop?
    Yes, as of September 19, NEAR met all criteria for the milestone airdrop after TVL crossed $70 million and the token price surpassed $3.3.
    What are the key levels to watch for NEAR’s next move?
    Immediate resistance lies at the $3.9 local high, while support zones to watch on any pullback include the cleared supply area at $3.2–$3.4 and key Exponential Moving Averages now acting as dynamic support.

  • Derive (DRV) Surges 40% Following v3 Upgrade Plan; Can It Maintain All-Time High?

    Derive (DRV) Surges 40% Following v3 Upgrade Plan; Can It Maintain All-Time High?

    Derive ($DRV) surged more than 40% over the last 24 hours while major assets such as Bitcoin (BTC) and Ethereum (ETH) traded in the red. Daily trading volume for the altcoin jumped over 463%, crossing $25 million at press time.

    Price Action and Key Technical Levels

    The token had been recovering from a 52% correction that followed its previous all-time high (ATH) of $0.19. An initial rally driven by the Upbit listing gave way to a bear phase lasting more than two months before the recent breakout.

    Market bulls have now pushed $DRV back toward the $0.19–$0.20 supply zone — the fourth test of this resistance area. The current leg up began on August 19, lifting the price from $0.09 to $0.20, and at one point printed a new ATH of $0.28 before settling around $0.24 at press time.

    Technical Indicators Favor Bulls on the 4-Hour Chart

    • Moving Averages: Price is trading above both the 100 and 200 EMAs, a classic bullish structure.
    • Bull Bear Power (BBP): The oscillator flipped green over the past three sessions, signaling strengthening buying pressure.

    However, a break below the $0.13 support zone could trigger a return to the correction phase. In that scenario, bullish reactions may be anticipated at $0.11 and $0.09.

    Fundamental Catalysts: V3 Upgrade, Buybacks, and Staking

    Investor enthusiasm has been sustained by a series of protocol-level developments:

    V3 Upgrade and OP Stack Wind-Down

    Derive posted its V3 plan on the project forum, triggering a 20% sentiment-driven rally. The upgrade will migrate custody to Ethereum mainnet and split risk books, enabling faster listings for real-world assets (RWAs) and additional altcoins. The existing OP Stack chain is being wound down as part of this transition.

    Fee-Fueled Buyback Program

    Protocol fees continue to feed $DRV buybacks, with 35% of fees allocated to repurchases. The 84th weekly buyback event acquired 199,760 $DRV at an average price of $0.14, bringing the cumulative total to 27.645 million tokens.

    Source: Derive Explorer

    Staking Locks Up Majority of Supply

    Over 67.63% of the circulating supply is currently held in the staked address, keeping available liquidity tight and supporting price stability during rallies.

    Outlook

    $DRV’s ability to sustain its breakout past the $0.19–$0.20 zone will depend on the interplay between these fundamentals — ongoing buybacks, high staking participation, and the V3 mainnet migration — and the technical structure on lower timeframes. A successful flip of the $0.19–$0.20 resistance into support could open the path toward further price discovery, while a rejection would likely see the altcoin retest the $0.13–$0.11 demand area.

  • XRP Price Poised for 40% Surge on CLARITY Act Vote, But Major Catch Remains

    XRP Price Poised for 40% Surge on CLARITY Act Vote, But Major Catch Remains

    Senate Prepares for CLARITY Act Vote as XRP Eyes Breakout

    The United States Senate is scheduled to vote on the CLARITY Act, a development coinciding with technical signals suggesting XRP is positioning for a potential price breakout.

    Analyst CasiTrades Weighs in on XRP Outlook

    Crypto analyst CasiTrades indicates there is potential for more significant price action for XRP. However, the analyst cautioned that Ripple’s XRP may encounter massive resistance should the rally advance to key price levels.

  • ETHFI’s 3x Volume Surge Drives Breakout, Yet ether.fi’s 10% Rally Faces Key Hurdle

    ETHFI’s 3x Volume Surge Drives Breakout, Yet ether.fi’s 10% Rally Faces Key Hurdle

    Ether.fi (ETHFI) Extends Rally with 10% Surge as On-Chain Metrics Signal Strengthening Momentum

    Ether.fi’s native token $ETHFI extended its bullish momentum with a 10% daily surge after closing above the critical $0.641 breakout level in the previous session. The advance pushed the token to an intraday high of $0.7232 before encountering resistance within the $0.695–$0.735 imbalance zone. Despite the rejection, the pullback remained shallow, with $ETHFI maintaining positions above all key exponential moving averages (EMAs).

    Trading Volume Triples to $179.69 Million, Signaling Broad Participation

    Recent on-chain data from Santiment reveals that $ETHFI’s trading volume tripled to $179.69 million during the rally. The sharp increase points to stronger market participation and adds weight to the breakout attempt within the existing uptrend. Elevated volume during price advances typically confirms conviction behind the move.

    Simultaneously, Social Volume has risen over recent days as market discussions tracked a week of consistent gains. While growing attention around ether.fi is evident, analysts note that social metrics alone cannot confirm sustained demand.

    Whale Activity and Spot Buying Pressure Build Near Resistance

    Data from CryptoQuant shows Spot Average Order Size increasing as $ETHFI approached the resistance zone, indicating growing whale activity. Larger spot orders strengthen the bullish bias by adding liquidity near a decisive price level, though their ultimate impact depends on whether buy-side demand persists as the token tests overhead supply.

    The Spot Volume Bubble Map further confirms that spot-market activity has tilted toward buyers. This combination distinguishes $ETHFI’s advance from rallies driven primarily by leveraged futures positions, underscoring real spot participation behind the move.

    Key Levels: $0.735 Imbalance Zone Gates Path to $0.765 Swing High

    On the daily chart, the $0.735 imbalance zone remains the primary barrier before the $0.765 swing high. A decisive daily close above $0.735 would signal that buyers have absorbed overhead selling pressure, potentially opening the path toward the swing high. Conversely, another rejection could push $ETHFI back toward the $0.641 breakout level as traders reassess the rally’s durability.

    Near-Term Structure Remains Constructive

    Overall, ether.fi’s near-term technical structure remains favorable. The token has reclaimed $0.641, trading volume has expanded significantly, whale activity has increased, and spot buyers appear to be gaining control. The next session will be pivotal in determining whether the bulls can convert the current momentum into a sustained breakout.

    Summary

    • $ETHFI surged 10% after closing above the $0.641 breakout level.
    • Trading volume tripled to $179.69 million during the rally.
    • Whale activity and spot buying pressure increased near the $0.735 resistance zone.
    • A decisive close above $0.735 could target the $0.765 swing high; failure risks a pullback to $0.641.