Tag: Open Interest

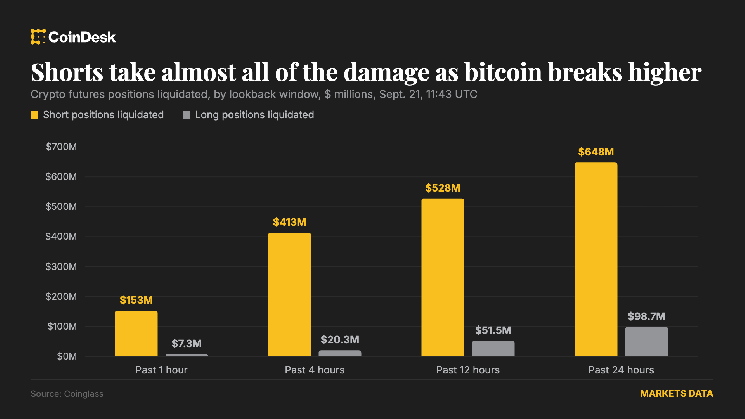
  • Bitcoin Hits $85,000 as Short Squeeze Liquidates $648 Million in Bearish Bets

    Bitcoin Hits $85,000 as Short Squeeze Liquidates $648 Million in Bearish Bets

    Key Highlights

    • Bitcoin surged 5.4% to $84,984, breaking decisively above the September range high of $82,284 set on Sept. 4.
    • The rally was fueled primarily by a massive short squeeze, with $746 million in positions liquidated over 24 hours—$647.9 million of them shorts.
    • Open interest rose 7.59% to $156 billion and volume jumped 39% to $224 billion, indicating traders are re-establishing positions rather than exiting the market.

    Bitcoin Breaks September Resistance on Heavy Short Liquidations

    Bitcoin BTC extended its breakout above the top of its September trading range on Monday, changing hands at $84,984 during the late European morning session. The move represents a 5.4% gain over the prior 24 hours and leaves the asset well clear of the $82,284 high recorded on Sept. 4, which had previously capped upside attempts throughout the month.

    Forced Buying Drives Momentum Rather Than Fresh Conviction

    According to market analysts and data from Coinglass, the rally is being propelled predominantly by forced buying stemming from a cascading short squeeze rather than an influx of new long-side conviction. Over the past 24 hours, $746 million in total positions were liquidated, of which $647.9 million were short positions. In the most recent hour alone, an additional $159.9 million in positions were wiped out, with 95% of those liquidations on the short side.

    Bitcoin shorts accounted for $277.5 million of the 24-hour liquidation total, while Ether (ETH) shorts contributed $122.8 million. The disproportionate short-side washout underscores a market that was heavily positioned for downside or range-bound price action, leaving bears vulnerable to a sharp upside repricing.

    Open Interest and Volume Signal Position Replenishment

    Despite the massive short covering, open interest across the market has risen 7.59% to $156 billion, and 24-hour trading volume has surged 39% to $224 billion. This combination—rising open interest alongside heavy liquidations—suggests that traders are actively replacing the positions being closed out rather than stepping back from the market. The data points to a structural repositioning, with new participants or existing players re-entering on the long side as the breakout confirms.

    Why This Matters

    The break above the September range high marks a technically significant development for Bitcoin, which had been consolidating in a relatively tight band for weeks. The fact that the move was catalyzed by a short squeeze rather than organic spot buying introduces a degree of fragility: if the forced buying exhausts itself without follow-through from spot accumulators, a pullback toward the former resistance—now potential support—around $82,000 could materialize. However, the concurrent expansion in open interest and volume suggests the market is not merely covering shorts but rebuilding directional exposure. Traders will be watching closely for sustained spot bid interest, funding rate normalization, and whether the $85,000 level can flip to support in the coming sessions. The next key technical hurdle lies near the late-July highs around $87,500–$88,000.

    Frequently Asked Questions

    What triggered Bitcoin’s break above the September range?

    The breakout was driven primarily by a massive short squeeze, with $746 million in positions liquidated over 24 hours—$647.9 million of them shorts—forcing bearish traders to buy back positions and accelerating upside momentum.

    Does rising open interest during a short squeeze signal bullish continuation?

    Yes. The 7.59% increase in open interest to $156 billion, combined with a 39% volume surge to $224 billion, indicates traders are replacing liquidated shorts with new long positions rather than exiting the market, suggesting conviction behind the move.

    What are the key levels to watch after this breakout?

    Immediate support now sits at the former September high of $82,284. Upside targets include the late-July highs near $87,500–$88,000. Sustained spot buying and funding rate normalization will be critical for follow-through.


  • WIF Price Prediction: Pullback Likely Despite 13% Surge, Analysts Say

    WIF Price Prediction: Pullback Likely Despite 13% Surge, Analysts Say

    Key Highlights

    • dogwifhat ($WIF) surged 13.14% in 24 hours as capital rotated into Solana memecoins, with trading volume jumping 95.16% to $105.8 million.
    • The rally stalled at the $0.2157 resistance level, where RSI bearish convergence at 62.85 signaled potential price rejection.
    • Spot market data shows seller dominance (90-day Spot Taker CVD), while rising open interest ($85.12M) creates leverage-driven downside risk.

    Capital Rotation Fuels $WIF Rally Amid Solana Memecoin Momentum

    Solana’s memecoin sector captured renewed trader attention over the past 24 hours, posting a near 6% collective gain as speculative capital rotated toward higher-risk ecosystem tokens. dogwifhat ($WIF) emerged as a primary beneficiary, recording a 13.14% daily price increase alongside a dramatic 95.16% surge in trading volume to $105.8 million. The volume expansion suggests heightened participation, though analysts caution that increased activity alone does not confirm sustainable buying pressure.

    Technical Resistance at $0.2157 Halts Recovery Attempt

    On the daily chart, $WIF rebounded from the $0.1758 region toward $0.2157 but failed to breach this overhead barrier. Notably, the barrier capped previous recovery attempts, making another price rejection significant for the short-term structure. More importantly, the RSI indicator formed a bearish convergence around the 62.85-zone as the price met rejection. Each recent RSI approach towards this threshold zone aligned with $WIF hitting the upper range, before a subsequent price retreat. At the time of writing, the RSI stood at 58.82, after retreating from the higher 62.85-zone. The repeated convergence between the indicator’s RSI resistance and price pullbacks could strengthen the possibility of a price correction.

    Spot Market Data Reveals Seller Dominance Despite Volume Spike

    $WIF’s resistance struggle alone did not confirm the pullback case though. In fact, the token’s Spot activity and derivatives positioning showed why selling pressure could gain greater influence after the price rally. According to CryptoQuant, $WIF’s Spot Volume Bubble Map highlighted intensified activity as traders increasingly participated in the recent move. Also, the 90-day Spot Taker CVD indicator read seller-dominant after the sharp hike in trading activity. This meant that at press time, aggressive sellers had taken control of the Spot executions as $WIF struggled to keep its rally alive. This imbalance weakened the rally as the trading expanding activity failed to translate into stronger taker-buy demand. Rather, the hike in participation activity coincided with selling as $WIF faced a significant technical barrier. Sustained seller dominance could therefore restrict fresh upside and increase pressure on traders who entered during the rally.

    Rising Leverage Adds Downside Risk Through Derivatives Exposure

    Finally, the memecoin’s derivatives market also added another layer of concern as leveraged exposure expanded during the price hike. According to CoinGlass, the Open interest climbed by 11.10% to $85.12 million, suggesting that traders added positions alongside the price recovery. Meanwhile, Binance top traders maintained a clear bullish bias despite weakening from previous positioning extremes. Specifically, the long accounts represented 60.52% against the shorts at 39.48%, producing a Long/Short Ratio of 1.53. Thus, this sizeable share of leveraged positioning remains exposed to a reversal as Spot sellers control activity. The developing price correction could pressure these longs and trigger position closures. Eventually, such unwinding would create additional selling pressure, potentially accelerating a pullback that initially began in the Spot market.

    Why This Matters

    The $WIF price action illustrates a recurring dynamic in the Solana memecoin ecosystem: rapid, volume-driven rallies that encounter structural resistance and deteriorating spot market internals. The divergence between rising participation (volume, open interest) and seller-dominant taker flow suggests that new entrants may be providing exit liquidity for earlier positions rather than establishing sustainable bullish trends. With $85.12 million in open interest and a 1.53 long/short ratio on Binance, the derivatives market carries significant liquidation risk if spot sellers maintain control. For traders and analysts monitoring Solana’s memecoin sector, the $0.2157 resistance level and the 62.85 RSI convergence zone serve as critical reference points for assessing whether the current rotation represents a durable trend shift or a liquidity-driven bounce vulnerable to leverage unwinding.

    Frequently Asked Questions

    What caused dogwifhat’s 13% price increase in the last 24 hours?

    Capital rotation into Solana memecoins drove a sector-wide gain of nearly 6%, with $WIF capturing outsized inflows that pushed trading volume up 95.16% to $105.8 million.

    Why did the $WIF rally stall near $0.2157?

    The $0.2157 level has repeatedly capped previous recovery attempts. Technical analysis shows RSI bearish convergence at the 62.85 zone aligning with each price rejection, signaling weakening momentum at this resistance.

    What risk does rising open interest pose for $WIF holders?

    Open interest climbed 11.10% to $85.12 million during the rally, with Binance top traders holding a 1.53 long/short ratio. If spot sellers maintain control and price corrects, leveraged long positions face liquidation risk that could accelerate selling pressure.

  • XRP Slides Below $1.30 Support as Traders Turn Bearish Short-Term

    XRP Slides Below $1.30 Support as Traders Turn Bearish Short-Term

    Ripple’s XRP token suffered a sharp 9.82% single-day decline on Tuesday, September 15, dropping from $1.42 to $1.28. The sell-off caught many market participants off guard, as the altcoin had spent much of late August repeatedly testing the $1.45 local resistance zone.

    Derivatives Data Signals Waning Speculative Interest

    According to data from CryptoQuant, XRP’s Open Interest (OI) has contracted significantly over the past month. OI fell from $1.128 billion in late August to $871 million at the time of writing, representing a 23% decline equivalent to roughly $257 million.

    This reduction in open derivatives contracts coincided with XRP’s rejection from the $1.50 higher-timeframe supply zone. The data suggests that derivatives positions were either voluntarily closed or forcibly liquidated in large numbers. The combination of decreasing speculative interest and a price slide below the $1.30 support level paints a cautious picture for the near term.

    Institutional Demand vs. Market Headwinds

    On-chain metrics reveal a divergence between institutional appetite and price action. Throughout September, XRP spot ETF flows have remained positive, with growing fund balances acquiring more tokens and reducing available supply.

    Despite this institutional demand, price action has lagged. AMBCrypto reported earlier this month that the disconnect was partly attributed to declining Bitcoin (BTC) prices, as the broader market priced in increasing odds of a rate hike.

    Key Technical Levels Under Pressure

    The $1.30 level had been identified as a critical short-term support zone. However, aggressive selling in the futures markets—accompanied by the declining Open Interest—overwhelmed buyers, causing XRP to lose this foothold in recent sessions.

    Daily Timeframe Structure and Fibonacci Analysis

    Analyzing the XRP/USDT pair on TradingView, the daily swing structure remains technically bullish. An earlier downtrend established a lower high at $1.184 (dotted green line), which was subsequently breached by the August rally, flipping the market structure to the upside.

    Price action has since tested the 61.8% Fibonacci retracement level. At the time of writing, the former $1.30 support is being retested as resistance. Without a renewed influx of strong demand across both spot and futures markets, XRP could continue its retracement toward the $1.14 level.

    Exchange Supply Ratio Holds Steady

    The exchange supply ratio—which measures the proportion of XRP’s circulating supply held on centralized exchange wallets—declined steadily from April through July. Since then, the metric has stabilized around 2.6%.

    If the ratio resumes its previous downtrend, analysts typically interpret it as a sign of accumulation and a shift of coins into cold storage. Conversely, a further price decline accompanied by a rising supply ratio would undermine the current bullish bias, which has already been damaged by the rejection at the key $1.50 supply zone.

    Summary

    • XRP failed to breach the $1.50 supply zone and dropped below the $1.30 support level.
    • Derivatives data shows increased sell pressure and declining speculative interest, signaling short-term bearish sentiment.
    • Spot ETF inflows remain positive, highlighting a divergence between institutional accumulation and current price weakness.
    • Technical structure suggests a potential retracement toward $1.14 if buying pressure does not return.
  • Decoding Zcash’s $1.35B Leverage Flush: Can ZEC Rebound to $1,200?

    Decoding Zcash’s $1.35B Leverage Flush: Can ZEC Rebound to $1,200?

    Zcash (ZEC) entered a sharp correction after an extended rally pushed the cryptocurrency toward the $1,300 price region. At the time of reporting, ZEC had dropped 14.36% over 24 hours, erasing a portion of its recent gains following a rapid price uptrend. This decline reflects a notable shift from the strength that had recently driven ZEC toward new highs.

    Leveraged Long Liquidations Trigger Forced Selling

    The previous rally attracted considerable speculative activity, with Open Interest hitting $1.35 billion. This elevated leverage left bulls increasingly exposed once the price retreated from its highs. Lookonchain reported that two leveraged ZEC longs were fully liquidated as the token pushed lower. The whale’s combined losses totaled around $4.33 million, highlighting the scale of forced position closures.

    Historically, long liquidations usually accelerate declines since leveraged positions get automatically closed when traders fail to maintain sufficient collateral. Such forced selling likely amplified ZEC’s price correction as existing supply pressure triggered further liquidations. Removing excessive leverage could, however, limit forced selling if ZEC stabilizes and speculative positioning resets.

    Macro Pressure Compounds Overbought Correction

    The leverage flush unfolded as broader market conditions remain unfavorable for risk assets. Bitcoin, the leading cryptocurrency, has also been facing selling pressure and weakening sentiment following recent gains. ZEC entered this environment after an exceptional price advance, making profit-taking significant as the token approached the $1,300 region.

    Notably, technical conditions also seemed stretched before the reversal, with the daily Relative Strength Index (RSI) previously moving above the 75 level. This combination exposed Zcash to broader weakness after buyers struggled to extend the recent rally. However, the correction has now cooled those stretched conditions, bringing technical support areas into focus.

    ZEC Holds Key Fair Value Gap as RSI Cools

    On daily timeframe charts, Zcash swept liquidity around the $1,300 level before failing to sustain its move above the $1,245 resistance zone. The rejection resulted in a sharp price correction toward the $1,075–$1,100 fair value gap (FVG), where buyers are attempting to respond. The price has since rebounded toward the $1,099 area, suggesting the immediate support region is attracting renewed demand.

    At the time of analysis, the RSI has fallen to 63.85 after cooling from its previous overbought readings while remaining above neutral territory. On the Directional Movement Index (DMI), the +DI signal at 35.68 remained above the -DI signal at 11.80, preserving the broader bullish directional structure. Furthermore, the Average Directional Index (ADX) signal remains elevated around 56.84, showing the prevailing trend still carries substantial directional strength.

    A strong hold of the $1,075 support could encourage a recovery move toward $1,245 before another potential attempt at the $1,295 liquidity region. A breakdown below that support, however, could instead expose the lower FVG around $970 and eventually the $800 order block.

    Liquidation Pools Could Pull ZEC Toward $1,200

    The technical recovery potential aligns closely with considerable liquidation liquidity sitting above Zcash’s current market price. The 24-hour Binance Liquidation Heatmap highlights dense liquidity concentrations around the $1,180–$1,200 price zone. These clusters could likely become an upside price magnet if ZEC extends its rebound, triggering forced closures on leveraged short positions.

    A successful break through $1,200 could then expose the additional liquidity cluster around the $1,240–$1,250 area, aligning closely with technical resistance. Considerable downside liquidity also sits around $1,050, making the current FVG significant for ZEC’s next directional move.

    Outlook: $1,075 Support Determines Next Leg

    Ultimately, a successful defense of the $1,075 support would preserve a recovery path toward the overhead liquidity, while losing it would weaken that outlook.

    Key Takeaways

    • ZEC’s 14.36% correction has flushed leveraged longs after its extended rally.
    • Holding $1,075 could reopen a recovery path toward the $1,180–$1,200 liquidity zone.
  • USELESS Coin Surges After Bithumb Listing Sparks $3.2M Whale Purchase

    USELESS Coin Surges After Bithumb Listing Sparks $3.2M Whale Purchase

    Useless Coin Surges 19% on Bithumb Listing and Whale Accumulation

    Useless Coin ($USELESS) climbed more than 19% in the past 24 hours, pushing weekly gains above 169% as of press time. Daily trading volume declined but remained sufficient for liquidity needs, with the volume-to-market-cap ratio holding at 47%.

    Key Catalysts Behind the Rally

    The rebound follows a three-day correction from the $0.3188 level. Three primary factors drove the surge: a major exchange listing, a sharp rise in Open Interest (OI), and significant capital inflows from large holders.

    Bithumb Listing Expands Asian Market Access

    The primary driver was increased exposure to the Asian market. South Korean exchange Bithumb listed $USELESS against the Korean Won (KRW), signaling expanding retail and institutional attention in the region.

    Following the listing, Open Interest for the memecoin reached a new all-time high of $146 million, more than doubling the previous peak of $70 million recorded in October 2025. The surge in OI indicates rising buy-side contract activity for $USELESS.

    Source: CoinGlass

    Whale and Institutional Accumulation Signals Long-Term Conviction

    On-chain data reveals substantial accumulation by major holders. A single whale withdrew 14 million $USELESS tokens—valued at approximately $3.20 million—from Coinbase Prime Custody to a private wallet at the $0.215 price zone.

    Additional transactions show institutional-grade custody movements. Over 440,000 tokens moved from Gate exchange to Fireblocks Custody, while 2.20 million coins flowed into KuCoin’s cold wallet. These patterns suggest serious participants are positioning for extended holding periods.

    Source: Arkham

    Traders monitoring chain activity from these wallets—including known market makers—may gain early insight into future market moves.

    Technical Outlook: Can $USELESS Hold Above $0.19?

    Technically, $USELESS is ranging near its 2026 highs and approaching that resistance level. Buying pressure between $0.19 and $0.21 supports potential short-term continuation. However, the token remains 64% below its all-time high of $0.4375.

    The $0.30 supply zone presents a key bearish hurdle, particularly if broader memecoin sector momentum fades. Losing $0.20 as support would shift control to sellers, while a sustained break above $0.30 would reinforce buyer dominance.

    Source: $USELESS/USDT on TradingView

    The Choppiness Index reading at 50 is declining, signaling that the uptrend is gradually strengthening. The MACD has turned green, though small histogram bars indicate the trend lacks robust momentum. Overall, $USELESS maintains a bullish market structure as momentum returns.

    Summary

    • 24-hour gain: +19%
    • Weekly gain: +169%
    • Key catalyst: Bithumb KRW listing and whale accumulation
    • Current range: $0.19 – $0.30
    • Critical levels: Support at $0.20; resistance at $0.30
    • Technical bias: Bullish structure with improving momentum
  • XRP Selling Pressure Hits 2026 High as Price Holds Firm Above $1.40

    XRP Selling Pressure Hits 2026 High as Price Holds Firm Above $1.40

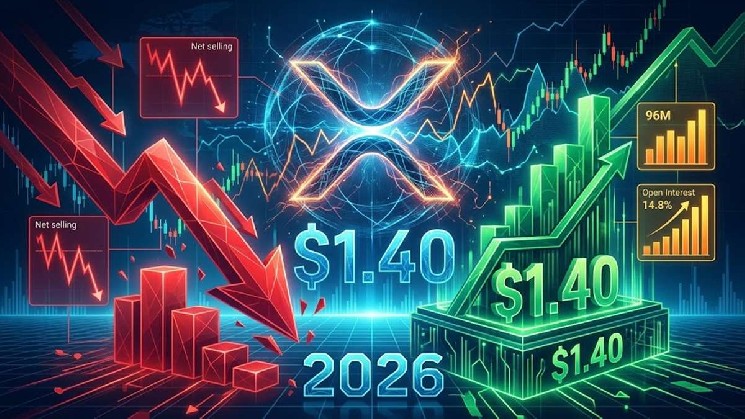
    XRP’s derivatives market is flashing its strongest net selling pressure of 2026, with Binance recording approximately $96 million in sell-side dominance. The surge follows a sharp 70% rally in XRP that has intensified speculative activity among derivatives traders. Despite the bearish signal, XRP continues to trade above $1.40 while Binance Open Interest has climbed 14.8%, signaling stronger market participation.

    Divergence Between Derivatives Selling and Spot Resilience

    The divergence between aggressive derivatives selling and resilient spot prices is giving traders a critical signal to monitor. The broader altcoin market has also strengthened in recent sessions, adding more than $183 billion in total capitalization within days. That represented an increase of roughly 20%, while XRP gained about 70% over the same period, making it one of the stronger performers during the recovery.

    XRP Selling Pressure Reaches 2026 Peak

    Data highlighted by CryptoQuant shows that XRP’s net taker volume on Binance has shifted sharply toward sellers. Sell-side dominance has reached approximately $96 million, marking the strongest reading recorded since the start of 2026.

    The metric tracks aggressive market orders and can provide insight into how traders are positioning around short-term price movements. In XRP’s case, the increase suggests that some derivatives participants are using the recent rally to take bearish positions or secure profits after the rapid advance.

    However, elevated selling activity does not automatically mean that XRP’s uptrend has ended. Strong spot demand can absorb derivatives selling, while liquidations or short-term hedging can also influence net taker volume. The current price structure therefore remains important. Holding above $1.40 despite heavier derivatives selling suggests buyers have so far absorbed the additional supply pressure.

    Binance Open Interest Adds Another Signal

    At the same time, XRP’s Binance Open Interest has increased by approximately 14.8%. The rise means more capital is entering outstanding derivatives positions as traders respond to the token’s recent move.

    Higher Open Interest combined with strong selling pressure can increase volatility because a larger number of leveraged positions are exposed to sudden price movements. If XRP continues to hold its support levels, short positions could eventually face pressure from another upside move. Conversely, a decisive break below $1.40 would strengthen the bearish interpretation and could encourage further profit-taking or liquidations.