Tag: On-chain analysis

  • DoubleZero Surges 29% as Open Interest Jumps 113% – Can 2Z Outpace $124M Token Unlock?

    DoubleZero Surges 29% as Open Interest Jumps 113% – Can 2Z Outpace $124M Token Unlock?

    Key Highlights

    • DoubleZero (2Z) surged over 29% in 24 hours, leading all top 200 cryptocurrencies by market capitalization amid a broader market rebound.
    • Technical indicators confirm bullish momentum: price cleared key liquidity above $0.075, CVD shows 19.57 million tokens bought at press time, and Open Interest jumped 113% alongside a 107% volume spike past $50 million.
    • Major token unlock looms on October 2nd: 1.77 billion 2Z tokens ($124 million, 17.79% of max supply) will enter circulation, potentially capping the uptrend that began September 16.

    DoubleZero Leads Market Recovery With 29% Intraday Rally

    DoubleZero (2Z) emerged as the standout performer across the top 200 digital assets by market capitalization over the past 24 hours, posting a gain exceeding 29% as the broader cryptocurrency market staged a rebound. The altcoin’s ascent pushed it decisively past the $0.075 resistance level, clearing liquidity clusters that had previously capped advances near the $0.060 equal highs. On-chain and derivatives data point to aggressive accumulation rather than speculative churn, with cumulative volume delta (CVD) metrics recording 19.57 million 2Z tokens purchased during the peak trading hour at press time. The Stochastic Momentum Index (SMI) on the daily timeframe registered near maximum levels, reinforcing the strength of the current up-move.

    Derivatives Data Signals Leveraged Long Positioning

    The rally’s structure is underpinned by a pronounced shift in derivatives markets. Open Interest on 2Z futures contracts surged 113%, while spot and perpetual trading volume climbed 107% to surpass $50 million at the time of writing, according to CoinGlass data. Notably, cumulative long liquidation leverage stood at $2 million versus just $955,000 in short orders, indicating that the price advance has been fueled by fresh long exposure rather than a short squeeze. This dynamic suggests conviction among leveraged participants, though it also introduces vulnerability should funding rates overheat or price action reverse sharply.

    Institutional Wallet Flows Reveal Accumulation Patterns

    Blockchain analytics from Arkham Intelligence highlight coordinated movement among major custodians and market makers. Fireblocks transferred 1.452 million 2Z tokens—valued at approximately $102,000—to a BtcTurk cold storage wallet, a transaction consistent with institutional accumulation. Simultaneously, Binance and Wintermute executed inter-wallet transfers, with Wintermute routing 1.113 million tokens to a Bybit hot wallet, likely for liquidity provisioning. South Korean exchange Upbit moved over 14 million 2Z (worth more than $800,000) across its internal hot wallet infrastructure, activity the data suggests is related to position management rather than distribution. Absent a coordinated selling effort by these entities, the technical backdrop remains supportive of further upside.

    October Token Unlock Presents Critical Supply Overhang

    The most significant risk to the current uptrend arrives on October 2nd, when the protocol’s vesting schedule releases 1.77 billion 2Z tokens—representing 17.79% of the maximum supply and valued at roughly $124 million at current prices. According to CoinMarketCap, this event will lift the circulating supply to 51%, up from a locked position exceeding 65% today. The bulk of the unlocking allocation is earmarked for early backers including Jump Crypto and Malbec Labs, alongside other institutional contributors. Market participants will closely monitor whether these stakeholders opt to hold, stake, or liquidate their newly liquid positions, as the resulting sell pressure could arrest the advance that has been in place since the September 16 trendline break.

    Why This Matters

    DoubleZero’s rally illustrates how mid-cap altcoins can decouple from broader market beta when derivatives positioning and institutional flow align. The convergence of technical breakout confirmation, rising Open Interest, and identifiable accumulator wallets provides a textbook case study in on-chain forensic analysis for traders. However, the impending token unlock represents a classic supply-side catalyst that has historically capped rallies in similarly structured vesting schedules. The October 2nd event will test whether demand from new market entrants and existing holders can absorb what amounts to nearly one-fifth of the token’s maximum supply entering free float within a single day. For the sector, the outcome may signal appetite for infrastructure-layer tokens with concentrated insider holdings—a dynamic relevant to numerous Layer 1 and DePin projects facing similar unlock cliffs in Q4 2024 and beyond.

    Frequently Asked Questions

    What are the key price levels to watch for 2Z following the breakout?

    Immediate resistance targets sit at $0.095 and $0.120, contingent on the price holding above the $0.075 breakout level. The primary downside invalidation zone is $0.050, which marks the trendline break origin from September 16.

    How large is the October 2nd token unlock relative to current circulation?

    The unlock will release 1.77 billion 2Z tokens ($124 million), equivalent to 17.79% of the maximum supply. This will increase the circulating supply to 51% from a current locked ratio exceeding 65%, with the majority allocated to Jump Crypto, Malbec Labs, and other institutional contributors.

    Are institutions buying or selling 2Z based on recent wallet activity?

    Recent on-chain flows suggest accumulation and liquidity management rather than distribution. Fireblocks moved tokens to a BtcTurk cold wallet, Wintermute transferred to Bybit for likely market-making purposes, and Upbit conducted internal wallet rotations. No major exchange deposit spikes indicative of selling pressure have been observed at press time.


  • New Wallet Withdraws $10 Million in Altcoins from Binance

    New Wallet Withdraws $10 Million in Altcoins from Binance

    Key Highlights

    • A newly created wallet address 0xC374 withdrew approximately $9.93 million in combined assets from Binance in a single transaction batch, per Lookonchain data.
    • Uniswap (UNI) dominated the allocation at 814,020 tokens (~$7.24 million), representing over 70% of the total position.
    • UNI has surged ~20% over the past week but remains 79% below its $44 all-time high; BNB sits 43% below its $1,370 peak.

    Whale Wallet 0xC374 Executes $9.93M Multi-Asset Withdrawal from Binance

    On-chain analytics platform Lookonchain has flagged a significant withdrawal event involving a freshly minted wallet address beginning with 0xC374. The entity behind the address moved three distinct altcoins off the Binance exchange in what appears to be a coordinated accumulation maneuver. The largest leg of the transaction involved 814,020 UNI tokens, valued at roughly $7.24 million at the time of transfer. This single asset accounted for more than 70% of the total capital deployed, signaling a pronounced conviction in the Uniswap governance token despite its distance from historical highs.

    Breakdown of Assets Moved Off-Exchange

    Beyond the UNI position, the whale address also transferred 2,382 BNB worth approximately $1.85 million and 12,397 Litecoin (LTC) valued near $841,000. The aggregate value of the three withdrawals reached $9.93 million, executed in a single transaction batch. Large-scale exchange outflows of this nature are typically interpreted by market observers as a bullish signal, suggesting the holder intends to custody assets long-term rather than trade actively, thereby reducing near-term sell-side pressure on the respective order books.

    Price Context: UNI and BNB Remain Deeply Discounted to All-Time Highs

    Despite the whale’s sizable bet, both primary assets in the portfolio continue to trade well below their respective peaks. UNI has gained roughly 2% in the last 24 hours and an impressive 20% over the trailing seven days, yet it remains 79% below its all-time high of $44 recorded during the 2021 bull cycle. BNB, the native token of the BNB Chain ecosystem, fares comparatively better but still sits 43% beneath its record high of $1,370. The whale’s entry point effectively captures both assets at significant historical discounts, a strategy often associated with long-horizon accumulation rather than short-term speculation.

    Why This Matters

    Large exchange outflows by newly created wallets are closely monitored by on-chain analysts because they frequently precede extended holding periods or strategic positioning ahead of protocol upgrades, governance votes, or macroeconomic catalysts. Uniswap’s upcoming v4 deployment and the anticipated fee switch activation have fueled speculative narratives around UNI’s value accrual mechanics, potentially motivating sophisticated actors to build positions early. Meanwhile, BNB’s correlation with the broader Binance ecosystem health and regulatory clarity in key jurisdictions adds a layer of fundamental scrutiny. The simultaneous accumulation of LTC—a legacy proof-of-work asset often viewed as a macro hedge—further diversifies the thesis. For retail participants, tracking such whale footprints offers a window into institutional-grade conviction, though it carries no guarantee of future performance.

    Frequently Asked Questions

    Who is behind wallet 0xC374?
    The identity of the entity controlling address 0xC374 is unknown. The wallet was newly created at the time of the withdrawals, and on-chain data does not reveal a known exchange, fund, or individual label.
    Why are large exchange withdrawals considered bullish?
    Moving tokens off centralized exchanges into self-custody reduces the available supply for immediate sale, signaling the holder expects higher prices long-term and has no intention to liquidate in the near term.
    What are the key price levels to watch for UNI and BNB?
    UNI’s all-time high stands at $44 (79% above current levels), while BNB’s peak is $1,370 (43% above current levels). Reclaiming psychological round numbers—$10 for UNI and $500 for BNB—would represent initial technical milestones toward those highs.

    Disclaimer: This article is for informational purposes only and does not constitute investment advice.

  • XRP Lags Latest Crypto Rally: Will It Catch Up to Rivals’ Gains?

    XRP Lags Latest Crypto Rally: Will It Catch Up to Rivals’ Gains?

    Key Highlights

    • Large cryptocurrency whales have accumulated over $2 billion worth of XRP, driving an 8.22% price surge in three days according to analyst Ali Martinez.
    • On-chain URPD data indicates limited resistance up to $1.60, a level where approximately 2.5 billion XRP previously changed hands and may trigger profit-taking.
    • XRP currently trades near $1.49, up 6.33% in 24 hours and 5.08% over the past week, outperforming recent altcoin market trends.

    Whale Accumulation Sparks XRP Price Surge

    After lagging behind other altcoins during the recent broader market rally, XRP has reclaimed investor attention following aggressive accumulation by large-scale holders. According to crypto analyst Ali Martinez, whales have purchased more than $2 billion worth of XRP in recent sessions, a volume significant enough to shift market dynamics and catalyze a sharp price recovery. The buying pressure has translated into an 8.22% gain over just three trading days, signaling renewed conviction among high-net-worth participants in the token’s near-term trajectory.

    On-Chain Metrics Point to $1.60 as Critical Resistance

    Martinez’s analysis relies heavily on URPD (UTXO Realized Price Distribution) data, which maps the price levels at which the current circulating supply last moved on-chain. The metric reveals a relative absence of realized supply between current prices and $1.60, suggesting that few holders are sitting on break-even or loss positions in that range. This structural characteristic typically reduces selling pressure during upward moves, as there are fewer incentivized exit points for traders looking to recover costs.

    The $1.60 Supply Wall

    However, the same data identifies $1.60 as a zone of heavy historical activity. Approximately 2.5 billion XRP changed hands near this price level in the past, creating a dense cluster of realized cost basis. Martinez warns that as price approaches this region, a significant portion of those holders may look to liquidate positions at or near break-even, introducing substantial selling pressure. The analyst characterizes this as the next major resistance zone where profit-taking could stall or reverse the current uptrend.

    Current Market Position and Momentum

    As of the latest data, XRP is trading at approximately $1.49, representing a 6.33% increase over the past 24 hours and a 5.08% gain over the trailing seven days. The token’s ability to sustain momentum above the $1.45 level has kept the path toward $1.60 technically viable, though the on-chain supply distribution suggests the final approach to that level may encounter increasing friction. Volume profiles and order book depth will be critical indicators of whether whale demand can absorb the anticipated supply wall.

    Why This Matters

    The resurgence of whale activity in XRP highlights a broader pattern where large capital flows often precede sustained trend changes in mid-cap crypto assets. Unlike retail-driven pumps, accumulation of this magnitude—exceeding $2 billion—typically reflects strategic positioning ahead of anticipated catalysts, whether regulatory clarity, institutional adoption, or network-level developments on the XRP Ledger. The URPD framework used by Martinez offers a more granular view of holder psychology than traditional technical indicators, mapping actual economic pain points rather than arbitrary chart levels. For market participants, the $1.60 zone represents not just a price target but a behavioral test: whether new demand can overwhelm the latent supply from prior market cycles. A decisive break above this level could signal a shift in market structure, while rejection may consolidate XRP in a lower range until fresh catalysts emerge.

    Frequently Asked Questions

    What is driving the recent XRP price increase?

    The primary driver is accumulation by large holders (whales) who have purchased over $2 billion worth of XRP, according to analyst Ali Martinez. This concentrated buying pressure has pushed the price up 8.22% in three days.

    What does the URPD data suggest about XRP’s next resistance?

    URPD (UTXO Realized Price Distribution) data shows limited on-chain supply between current levels and $1.60, indicating minimal resistance. However, $1.60 itself is a major supply zone where ~2.5 billion XRP last transacted, making it a likely profit-taking target.

    Is XRP expected to continue rising past $1.60?

    Analyst Ali Martinez suggests there is room for gains up to $1.60 based on current on-chain structure, but warns that the dense cluster of realized supply at that level may trigger significant selling pressure, potentially stalling further upside without new demand catalysts.

  • Microtransactions Dominate Bitcoin Usage, Signaling Major Shift

    Microtransactions Dominate Bitcoin Usage, Signaling Major Shift

    Key Highlights

    • Micro-transactions under 0.01 BTC now represent nearly 80% of all Bitcoin network activity, signaling a fundamental shift in on-chain usage patterns.
    • The transition from large-value transfers to high-frequency, small-value transactions aligns with rising institutional interest in Bitcoin exchange-traded products (ETPs).
    • Analysts suggest the trend could enhance price stability and accelerate mainstream adoption by demonstrating Bitcoin’s utility for everyday payments.

    Bitcoin Network Dynamics Shift Toward Micro-Transaction Dominance

    Recent on-chain data reveals a structural transformation within the Bitcoin network, where transactions valued below 0.01 BTC—equivalent to roughly $600 at current prices—now account for approximately 80% of total transaction volume. This marks a decisive departure from historical patterns dominated by large-value settlements and whale movements, suggesting the protocol is increasingly functioning as a medium for frequent, low-value exchanges rather than solely a store-of-value settlement layer.

    Changing User Behavior and Institutional Catalysts

    The surge in micro-transaction activity coincides with growing traction for Bitcoin exchange-traded products, particularly in the United States following the SEC’s approval of spot Bitcoin ETFs in January 2024. Asset managers such as Grayscale Investments have reported that Bitcoin ETPs are attracting capital flows at a pace rivaling, and in some periods exceeding, traditional gold-backed funds. This institutional wrapper is lowering barriers to entry for retail and advisory audiences, potentially driving the increased on-chain fragmentation observed in recent months.

    Scalability Implications and Network Utility

    As the proportion of sub-0.01 BTC transactions climbs, questions around Bitcoin’s base-layer scalability and fee market dynamics intensify. While the Lightning Network and other layer-2 solutions are designed to absorb high-frequency, low-value traffic, the persistence of such activity on-chain indicates either growing user comfort with base-layer fees or delayed adoption of off-chain alternatives. The trend underscores the evolving narrative of Bitcoin as both a reserve asset and a functional payment rail, a dual role that could reshape long-term demand dynamics.

    Why This Matters

    The dominance of micro-transactions represents a potential inflection point for Bitcoin’s maturation as a financial asset. Historically, high concentrations of large transactions correlated with speculative cycles and custodial reshuffling. A shift toward granular, user-initiated activity suggests deeper integration into commercial and peer-to-peer economies. Coupled with the institutionalization via ETPs—now recognized by major allocators as a legitimate portfolio diversifier alongside gold—this on-chain evolution may support a more resilient price floor and broader acceptance in regulatory and commercial frameworks. Market participants should monitor whether layer-2 adoption accelerates in response to base-layer congestion, and how fee revenue trends affect miner economics post-halving.

    Frequently Asked Questions

    What qualifies as a micro-transaction on the Bitcoin network?

    In the context of the recent data, a micro-transaction is defined as any on-chain Bitcoin transfer valued below 0.01 BTC, which at current market prices represents approximately $600 or less.

    How do Bitcoin ETPs influence on-chain transaction patterns?

    Bitcoin exchange-traded products, such as those offered by Grayscale, BlackRock, and Fidelity, enable traditional investors to gain exposure without self-custody. Increased ETP adoption often correlates with higher on-chain activity as issuers manage creation and redemption baskets, while broader accessibility may spur retail usage for payments and transfers.

    Does the rise in micro-transactions affect Bitcoin’s scalability?

    A sustained high volume of small on-chain transactions can increase network congestion and fee pressure, potentially accelerating demand for layer-2 solutions like the Lightning Network. However, it also demonstrates real-world utility, which is a positive signal for long-term adoption.

  • Philadelphia Fed Finds Bitcoin Traders Follow Whale Signals Faster Than Ethereum Users

    Philadelphia Fed Finds Bitcoin Traders Follow Whale Signals Faster Than Ethereum Users

    A new working paper from the Federal Reserve Bank of Philadelphia reveals a stark divergence in how Bitcoin and Ethereum markets react to public notifications of large cryptocurrency transfers. Published this month, the study finds that non-whale Bitcoin wallets rapidly follow the trading direction of identified whales, while Ethereum market participation remains largely stable.

    Study Methodology and Whale Definition

    The Philadelphia Fed researchers matched timestamps from Whale Alert public notifications with on-chain transfer data for Bitcoin (BTC), Ethereum (ETH), and Wrapped Bitcoin (WBTC) through the end of 2025. The authors defined a whale wallet as an address that had executed at least one transfer valued above $50 million, explicitly excluding large wallets associated with centralized exchanges or smart contracts.

    To isolate distinct events, the study filtered for transactions without another whale transfer occurring within a two-hour window on either side. This process yielded a final sample of 6,645 Bitcoin whale transactions and 5,075 Ethereum whale transactions.

    Bitcoin: Sharp, Short-Lived Herding Behavior

    The data shows that active participation from non-whale Bitcoin wallets—specifically small and medium-sized cohorts—surged most intensely during the first 15 minutes following a whale alert.

    Buy-Side Reaction (Following Whale Buys)

    • Small wallets: Buy participation increased by 14.81 percentage points.
    • Medium wallets: Buy participation increased by 23.72 percentage points.
    • Large wallets: Buy participation increased by 3.50 percentage points.

    Sell-Side Reaction (Following Whale Sells)

    • Small wallets: Sell participation rose by 12.95 percentage points.
    • Medium wallets: Sell participation rose by 29.52 percentage points.
    • Large wallets: Sell participation rose by 2.95 percentage points.

    This same-direction trading activity decayed toward baseline levels within approximately one hour.

    Ethereum: Muted and Stable Response

    In contrast, Ethereum did not exhibit a broad-based retail reaction. Post-alert participation remained comparatively stable across all wallet size groups. The only statistically notable immediate response appeared among the largest non-whale cohort following whale sells. Medium-sized ETH sellers registered a reaction only at the study’s weaker 10% significance threshold.

    The authors emphasize that these wallet classifications reflect transaction-based proxies for activity levels, not the verified identities of the individuals or entities controlling the addresses.

    Diverging Volatility Dynamics

    The market structure difference extends to realized volatility:

    • Bitcoin: Whale alerts correlated with a temporary rise in realized BTC volatility at short horizons. However, by the 24-hour mark, the volatility effect from both BTC and ETH alerts had reversed.
    • Wrapped Bitcoin (WBTC): Alerts for WBTC on Ethereum showed a volatility impact statistically indistinguishable from zero.
    • Ethereum: Realized volatility on the Ethereum network was lower after alerts, suggesting large Ethereum-network transfers tend to occur during periods of declining volatility.

    Market Structure, Not Consensus Mechanism

    The authors attribute the behavioral gap to fundamental market-structure differences. They note that Ethereum activity frequently routes through exchanges, smart contracts, and Layer-2 scaling solutions, where numerous user transactions are often aggregated into larger balance transfers.

    This structural contrast persisted through Ethereum’s September 2022 transition to proof-of-stake, indicating that the consensus mechanism alone does not explain the divergence in market dynamics.

    Observational Evidence, Not Causal Proof

    The researchers caution that the evidence remains observational. Key limitations include:

    • Wallet-size groups serve as transaction-based proxies rather than definitive entity classifiers.
    • A single owner may control multiple addresses.
    • Exchange-related activity was excluded from the whale definition and analysis.

    Consequently, the event study establishes robust patterns in wallet activity and volatility surrounding public alerts, but does not prove that the alerts caused every observed market response.

  • Whale 7GP6Bz Buys 11,487 SOL, Sparking Interest in Solana

    Whale 7GP6Bz Buys 11,487 SOL, Sparking Interest in Solana

    Solana Whale Accumulates 11,487 SOL Worth $1.14 Million, Signaling Bullish Sentiment

    A major Solana whale identified as 7GP6Bz has purchased 11,487 SOL tokens valued at approximately $1.14 million, according to on-chain data highlighted by crypto analyst @lookonchain. The transaction has drawn immediate market attention, underscoring growing confidence in Solana’s ecosystem despite mixed broader crypto market signals.

    Whale Activity Points to Institutional-Grade Conviction

    The acquisition occurred against a backdrop of divergent market trends, where certain assets face selling pressure while others—like Solana—attract significant whale interest. Large-scale purchases by deep-pocketed entities often precede notable price movements, as they reduce circulating supply and signal long-term holding intent.

    Solana’s high-performance blockchain, designed for decentralized applications and scalable crypto projects, continues to position itself as a foundational layer for Web3 development. This latest accumulation reinforces the narrative that sophisticated investors are betting on Solana’s technical roadmap and ecosystem expansion.

    Key Metrics at a Glance

    • Buyer: Whale address 7GP6Bz
    • Asset Acquired: 11,487 SOL
    • Total Value: ~$1.14 million
    • Source: @lookonchain on-chain monitoring

    Market Implications and Levels to Watch

    Traders and analysts are now monitoring Solana’s price action closely for follow-through momentum. Whale-driven demand can catalyze short-term rallies, especially if retail participation increases in response. Key technical levels and on-chain metrics—such as exchange inflows, staking rates, and active addresses—will provide further clues on whether this accumulation marks a local bottom or the start of a sustained uptrend.

    As with all on-chain signals, context matters. While whale buying is a bullish indicator, broader macroeconomic factors, regulatory developments, and Bitcoin’s price trajectory will continue to influence Solana’s near-term direction.

  • Bitcoin Flashes Unprecedented 17-Year On-Chain Anomaly

    Bitcoin Flashes Unprecedented 17-Year On-Chain Anomaly

    Bitcoin On-Chain Analyst Flags Unprecedented HODL Wave Anomaly Suggesting Single Whale Accumulation

    Prominent on-chain analyst Willy Woo has identified an unusual signal in Bitcoin’s HODL Wave data that appears to have no precedent across nearly two decades of available history. The anomaly centers on how Bitcoin was accumulated around the recent market bottom, with Woo suggesting the buying pattern points to a single large entity rather than broad retail participation.

    Analyst Highlights “Anomaly” in 17.5 Years of HODL Wave Data

    In a post on X, Woo emphasized the rarity of the current data pattern:

    We have an ANOMALY.Whoever bought the bottom did it slowly. Possibly even a single whale.When it’s many investors, you expect to see spikes in buying activity. That’s happened every time across 17.5 years of Hodl Wave data except now. pic.twitter.com/1cU23USB3R

    According to Woo, the absence of typical accumulation spikes is the key deviation. “Whoever bought the bottom did it slowly. Possibly even a single whale,” he stated. The analyst explained that widespread investor participation historically produces clear spikes in Bitcoin’s youngest HODL Wave bands. “When it’s many investors, you expect to see spikes in buying activity. That’s happened every time across 17.5 years of Hodl Wave data except now,” Woo elaborated.

    How HODL Waves Reveal Accumulation Patterns

    HODL Waves segment Bitcoin’s circulating supply based on the duration coins have remained unmoved. The youngest bands are especially sensitive to recent buying activity because newly acquired coins appear there first before migrating to older age bands if held long-term. If those coins are spent again, they cycle back to the youngest bands.

    Normally, a market bottom accompanied by broad participation generates conspicuous bursts in these short-term waves. The current absence of such spikes suggests accumulation may have been driven by a very large investor or a small number of entities operating quietly.

    Single-Whale Theory Remains an Interpretation, Not a Conclusion

    Woo has acknowledged that the single-whale explanation is only one interpretation. Other factors could account for the anomaly, including:

    • Exchange-traded fund (ETF) flows
    • Institutional custody arrangements
    • Derivatives market activity
    • Structural changes in Bitcoin’s market since HODL Wave data first became available

    Bitcoin Price Action Remains Fragile Amid Macro Headwinds

    The on-chain signal arrives as Bitcoin navigates shaky price action. As reported by U.Today, the leading cryptocurrency recently slipped below the psychologically important $77,000 level on Thursday. While Bitcoin has since bounced from those lows, market fragility persists due to the high probability of an incoming rate hike.

    Adding to near-term uncertainty, a major derivatives expiry is scheduled for Friday. According to Coinbase Markets, approximately $2.51 billion worth of Bitcoin and Ethereum options are set to expire, with BTC accounting for the overwhelming majority of the total notional value.

  • FARTCOIN Falls 20% as 6.5M Tokens Hit Exchanges; Rebound Possible If…

    FARTCOIN Falls 20% as 6.5M Tokens Hit Exchanges; Rebound Possible If…

    FARTCOIN’s price decline accelerated after more than 6.5 million tokens reportedly moved into centralized exchange hot wallets within a 24-hour period. The transfers followed a price rejection near the $0.181 level, where sellers disrupted the memecoin’s previous recovery attempt.

    Large Token Transfers to Major Exchanges

    According to on-chain data, approximately 957,090 FARTCOIN valued at nearly $164,800 were transferred from Coinbase Prime Custody into a Coinbase hot wallet. Additionally, another 3.48 million tokens worth over $600,000 entered Gate.io through three coordinated transfers. These transactions included 1.733 million FARTCOIN from address CGbHc and another 932,700 tokens from a separate depositor. Wintermute also moved around 824,000 FARTCOIN toward Gate.io, amplifying potential exchange-side supply pressure.

    Meanwhile, trading volume climbed 22.13% to $23.87 million as FARTCOIN fell 20% toward $0.144 in 24 hours. The decline placed FARTCOIN among the top losers in the memecoin sector, highlighting stronger selling pressure across its market.

    Exchange Spot Flows Signal Bearish Bias

    The exchange spot flows added another bearish indicator while the large token transfers already challenged FARTCOIN’s ability to stabilize. At the time of writing, the memecoin had recorded around $1.15 million in inflows versus $859,330 in outflows. Clearly, the inflows exceeded the outflows, producing positive netflow and increasing the tokens available across tracked exchanges.

    Notably, several earlier periods reflected considerably larger flows, yet the recent imbalance came at a time of heightened selling pressure. This timing reinforced the significance of the exchange supply as FARTCOIN pushed toward its key technical support area. Continued positive netflows could preserve supply pressure as fresh exchange deposits continue exceeding withdrawals. Stronger outflows, on the other hand, could reduce available supply and improve conditions necessary for buyers to defend support.

    Source: CoinGlass

    Price Tests Crucial Order Block Near $0.140

    The token’s decline pushed price toward the $0.14497 zone, placing it directly inside the order block above the $0.140 support level. On the daily timeframe chart, this zone had previously supported a consolidation before August’s price expansion, making its defense very important for the broader technical structure.

    However, FARTCOIN price remained within a descending channel structure after a pullback from the $0.22319 resistance region. Selling strength persisted as the MACD indicator stayed bearish, with its histogram in negative territory at -0.00527. The RSI also declined toward 41.08 and remained below its 51.41 moving average, reflecting weaker buying pressure. Notably, the RSI had not hit oversold conditions, leaving sellers room to extend the correction deeper.

    Holding the order block could support a reversal toward the upper boundary of the descending channel. Consequently, a structure breakout could then likely reopen the path to the $0.180 resistance zone. Failure below the $0.140 support would instead weaken the order block and expose the $0.11773 lower support.

    Source: TradingView

    Liquidation Heatmap Reveals Overhead Liquidity Targets

    Despite continued selling, the Binance Liquidation Heatmap positioning presented several potential recovery targets above FARTCOIN’s current market price. The 24-hour heatmap chart showed a notable liquidation liquidity cluster between the price range of $0.156 and $0.161. Additional clusters appeared around the $0.165 area extending toward $0.170, indicating further upside liquidity pools.

    These upper concentration clusters could pull the price higher if the order block holds and buyers regain market control. A price recovery through the $0.161 level could increase pressure on short positions clustered across the higher liquidity zones.

    Source: CoinGlass

    Key Takeaways

    • Over 6.5 million FARTCOIN tokens reaching exchanges strengthened immediate selling pressure.
    • Holding the $0.140 level could support recovery toward liquidation liquidity clustered above the current price.
  • Bitcoin Sell Pressure Hits One-Month Low as Long-Term Holders Reduce Profit-Taking

    Bitcoin Sell Pressure Hits One-Month Low as Long-Term Holders Reduce Profit-Taking

    Bitcoin On-Chain Sell-Side Risk Drops Below Half of August Peak, Glassnode Reports

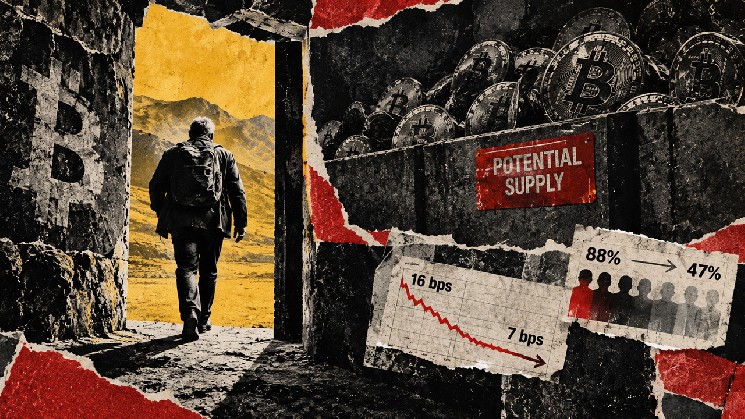
    Bitcoin’s on-chain sell-side risk has declined to less than half its August high, signaling reduced potential selling pressure even as a significant cluster of older coins remains held above current market prices. Analytics firm Glassnode detailed the shift in a September 9 report covering on-chain data through September 7.

    Sell-Side Risk Ratio Falls to 7 Basis Points

    The firm’s Sell-Side Risk Ratio stood at 7 basis points per day on a seven-day basis, down sharply from 16 basis points at August’s peak. This metric aggregates on-chain profits and losses and divides the total by realized capitalization, measuring value realization relative to that capital base to indicate potential selling pressure.

    Long-term holders accounted for 47% of realized profit during the period, compared with 88% at the August peak. The decline suggests older holders are contributing a smaller share of the market’s realized profit, though the percentage does not measure their share of all Bitcoin sales.

    A ratio below half its earlier level does not mean the volume of Bitcoin sold on exchanges has halved.

    Profit Realization Spikes Moderate

    Glassnode separately reported that the realized-profit spike on September 3 was less than half the size of August’s spike. That comparison tracks profit spikes specifically, distinct from the seven-day risk measure. Together, the findings describe quieter realization activity and a changed mix of holders taking profits.

    Overhead Supply Cluster Holds at $83,000–$86,000

    The report identifies roughly 1.07 million BTC acquired between $83,000 and $86,000, almost all held by long-term holders. That block of coins barely changed over 30 days. The holdings remain potential supply, while the realization data describe what holders have recently been doing.

    Exchange Demand Remains a Separate Test

    Reports noted negative exchange spot flow on September 8. Spot cumulative volume delta (CVD) remained negative despite improving, meaning aggressive exchange selling still outweighed aggressive buying in that measure.

    CVD tracks the balance of executed trading, while sell-side risk tracks on-chain profit-and-loss realization relative to realized capitalization. A lower reading in the latter does not require the former to turn positive.

    Bitcoin holders are realizing less profit and loss relative to the capital base, while the overhead coins remain largely in place. Treating that entire block as immediate selling pressure would overstate the evidence. A sustained advance would still require buyers to absorb the supply that actually comes to market.

    Related Reading: Bitcoin’s next $80,000 breakout has $47 billion more profitable supply to absorb

  • Bitmine-Linked Wallet Withdraws 20,000 ETH Worth $49.4 Million From FalconX

    Bitmine-Linked Wallet Withdraws 20,000 ETH Worth $49.4 Million From FalconX

    An Ethereum wallet believed to be associated with Bitmine has withdrawn 20,000 $ETH, worth approximately $49.42 million, from cryptocurrency exchange FalconX. Blockchain tracking platform Onchain Lens flagged the transaction and identified the wallet as likely belonging to Bitmine, a major cryptocurrency mining operation.

    Ethereum Exchange Outflow May Signal Accumulation

    Large cryptocurrency withdrawals from exchanges are often viewed by market analysts as signs of accumulation. Investors may move assets into private wallets for long-term holding instead of keeping them available for immediate trading.

    The transaction suggests that Bitmine may be expanding its Ethereum reserves, potentially in anticipation of future price gains or for staking purposes. However, the exact reason for the withdrawal has not been disclosed.

    The move comes as Ethereum trades within a relatively defined range. Transactions of this size remain closely watched by traders and on-chain analysts because they can offer insight into institutional sentiment.

    What the Bitmine Ethereum Withdrawal Could Mean for the Market

    Bitmine is known for its large-scale mining operations and has historically held significant amounts of mined cryptocurrency. The withdrawal is consistent with a broader trend among miners and large holders to reduce their exchange balances.

    Lower exchange balances can reduce potential sell-side pressure. On-chain data also indicates that Ethereum reserves held on exchanges have declined over the past year, a trend some analysts consider bullish. If demand increases while fewer coins are available on exchanges, price volatility could rise.

    Why Large $ETH Transfers Matter to Investors

    For retail investors, major whale transactions can provide a possible indication of market direction. However, a single transaction—even one worth tens of millions of dollars—does not necessarily predict future Ethereum price movements.

    Market conditions, regulatory developments and broader economic factors also influence cryptocurrency prices. The Bitmine-associated withdrawal is therefore best viewed as one data point rather than a definitive trading signal.

    Frequently Asked Questions

    What is an exchange outflow?

    An exchange outflow is the movement of cryptocurrency from an exchange’s wallets to external wallets. It is often interpreted as a sign that investors intend to hold the assets for the long term rather than trade them immediately.

    Why do large $ETH withdrawals matter?

    Large withdrawals can reduce the amount of Ethereum available on exchanges, potentially lowering sell pressure. They may also be viewed as a confidence signal from major holders, which can affect market sentiment.

    Who is Bitmine?

    Bitmine is a cryptocurrency mining company that operates large-scale mining facilities. The company is known to hold significant amounts of mined digital assets, including Bitcoin and Ethereum.

    Related Reading

    • BitMine Acquires 53,000 $ETH as Analyst Lee Sees Rising Institutional Accumulation in Ethereum
    • Whale Alert Tracks $230M USDC Move from Coinbase Institutional: What It Signals
    • Tom Lee Reaffirms $150K Bitcoin Target, Says Fundamentals ‘Strong’
    • Tom Lee: Ethereum Is the Top-Performing Major Asset, Outshines S&P 500 by 5,430 Basis Points
    • Whale Linked to Institutional Investor Moves $129M in Ethereum to Exchanges, Raising Sell-Off Concerns

    Source: cryptonews.net