Tag: Oil prices

  • Bitcoin Price Nears $80K as Trump Signals Iran Talks

    Bitcoin Price Nears $80K as Trump Signals Iran Talks

    Bitcoin Recovers 3% to $79,143 as Trump Signals Iran Diplomacy, but Geopolitical Risks Persist

    Bitcoin ($BTC) climbed approximately 3% to $79,143 on Monday after briefly touching $79,325, buoyed by comments from U.S. President Donald Trump suggesting Iran wants to reach a deal with Washington. The recovery comes despite conflicting statements from Tehran and ongoing military tensions that continue to pressure energy markets.

    Trump Comments Spark Risk-On Sentiment

    Bitcoin’s rebound accelerated after President Trump posted on Truth Social that Tehran was eager for an agreement.

    “The failing Nation of Iran wants to make a deal, quickly and badly,”

    Trump wrote. He added that he would decide whether the United States engages with Tehran, though he said Washington was open to the idea. The remarks introduced the possibility of renewed talks after months of military exchanges and repeated failures to secure a lasting agreement.

    During the recovery, Bitcoin first moved above $78,000 and reached $78,940 before extending gains. A daily Binance chart on TradingView showed BTC opening at $76,842, dipping to $76,388, and later peaking at $79,325. The asset traded near $79,143 at the time of capture, representing a 3% daily gain.

    U.S. equities mirrored the cryptocurrency’s move. Approximately $570 billion returned to stocks within three hours after the session had earlier erased more than $600 billion. Technology shares had faced additional pressure after executives from artificial intelligence companies called for slower development to address safety risks, adding another layer of uncertainty for a sector that has driven much of the recent U.S. equity rally.

    However, Iranian state media rejected Trump’s claim that Tehran was seeking a quick agreement, leaving the market without confirmation from both governments. LiveSquawk separately cited Iran’s ILNA news agency as saying the United States had sought a “phased” agreement, based on information attributed to a Pakistani source. The report did not establish that Washington and Tehran had accepted final terms.

    Oil Above $100 Keeps U.S.-Iran Risk Active

    The diplomatic dispute unfolds as attacks involving Iran-aligned forces continue to pressure oil production and shipping routes.

    According to Reuters, Yemen’s Iran-aligned Houthis launched missiles and drones at a military airbase in Khamis Mushait, Saudi Arabia. The group said it targeted aircraft hangars, radar equipment, runways, and ammunition storage sites in response to Saudi strikes in Yemen.

    In a separate attack, which Riyadh blamed on Iran-backed fighters in Iraq, Saudi Arabia’s east-west pipeline was taken offline. The route allows oil exports to bypass the Strait of Hormuz, making it critical while traffic through the strait remains restricted.

    Traders told Reuters that an extended pipeline closure could affect as much as 4% of global oil supply. Brent crude rose more than 4% after the weekend before paring gains following Trump’s comments. It later traded near $106 per barrel, while U.S. crude remained above $100.

    For American consumers, Reuters reported that the average retail diesel price had reached a record above $6.23 per gallon. Sustained energy costs could feed inflation and complicate the Federal Reserve’s interest-rate decisions, creating a direct link between the conflict and the conditions facing U.S. Bitcoin investors.

    As crypto.news previously reported, Bitfinex analysts identified energy costs and real Treasury yields as restraints on Bitcoin. The analysts said an oil shock could keep inflation expectations elevated, while tighter monetary policy would reduce liquidity without resolving the loss of energy supply.

    Oman had planned to host Iranian and Gulf officials for discussions over the future operation of the Strait of Hormuz. Foreign Minister Sayyid Badr Albusaidi postponed the meeting “in the interests of consensus,” without announcing a replacement date. Iran said Saudi Arabia had requested the delay. Tehran also published a list of 77 vessels it said had breached its operating rules in the strait, warning that future violations could lead to fines, detention, or confiscation.

    Bitcoin Faces Technical Resistance Near $80,000

    Technical readings show Bitcoin has returned above the center of its daily Bollinger Bands but has not cleared the upper boundary.

    • Bollinger Band midpoint: ~$78,521
    • Upper band: ~$81,035
    • Lower band: ~$76,008

    BTC’s move above the midpoint gives buyers control of the immediate range, although the upper band and recent highs create resistance between $80,000 and $81,035.

    Bitcoin price daily chart — Sep. 15 | Source: crypto.news

    A one-week CoinGlass liquidation heatmap shows the largest nearby concentration of leveraged positions just below $80,000. The brightest band appears around $79,900 to $80,000, making the area a possible target if buyers extend the advance.

    Bitcoin liquidation heatmap | Source: CoinGlass

    Several smaller liquidation pools sit between roughly $80,200 and $80,700. A clean move through that region would bring the Bollinger Band ceiling near $81,035 into focus, followed by the larger $82,000 area identified in recent Bitfinex analysis.

    Momentum Signals Remain Mixed

    Momentum remains less certain. The daily MACD line stood near 1,579, below its signal line around 2,211, while the histogram had fallen to approximately minus 631. Both MACD lines remained above zero, but the bearish crossover and red histogram bars showed that momentum had weakened after Bitcoin’s sharp August rally.

    Price action has also remained uneven since BTC first moved above $80,000. Buyers have defended pullbacks toward the mid-$76,000 area, yet several attempts to hold above $81,000 have failed. The current move has returned Bitcoin to the upper half of that range without confirming a breakout.

    Key Support Levels to Watch

    On the downside, the Bollinger midpoint near $78,521 forms the first technical support. Losing it would expose the $77,500 to $78,000 region, where the heatmap shows a series of smaller leveraged clusters.

    The largest lower liquidity concentration sits around $76,000, close to the daily lower Bollinger Band. A sustained break below that zone could expose another pool near $75,000 to $75,400.

    Fed Policy Adds Another Test for U.S. Investors

    The Iran conflict is not the only event capable of disrupting Bitcoin’s recovery. The Federal Reserve meets on Sept. 15 and 16, with its policy statement, updated economic projections, and Chair Kevin Warsh’s press conference due on Wednesday.

    Markets had priced an 87% probability of a quarter-point increase before the meeting. Such a decision would move the federal funds target range from 3.50%–3.75% to 3.75%–4.00%.

    Bitfinex analysts said the Fed’s projections could matter more for Bitcoin than the rate announcement itself because they will show whether officials expect one increase or a longer series of moves. Higher Treasury yields can raise the return available from government securities, increasing competition for capital held in non-yielding assets such as Bitcoin.

    U.S.-listed spot Bitcoin exchange-traded funds provide another measure of demand from American investors. The products attracted $986.7 million during the week ending Sept. 4, after taking in $924.5 million the previous week. Three consecutive positive weeks brought the combined inflow to about $3.8 billion.

    Fed policy, oil prices, and developments around the Strait of Hormuz will now overlap with the liquidation levels visible on the Bitcoin chart. The Federal Reserve is scheduled to release its decision on Wednesday afternoon, followed by Warsh’s press conference and the central bank’s updated economic projections.
  • Stock Futures Today: Live Market Updates

    Stock Futures Today: Live Market Updates

    Stock futures declined early Monday as investors digested a significant shift in the artificial intelligence initial public offering pipeline amid mounting safety concerns, while oil prices surged following a critical pipeline closure in the Middle East.

    Equity Futures Slide on AI Sector Uncertainty

    S&P 500 futures lost 0.6% as of 3:06 a.m. ET, while Nasdaq-100 futures tumbled 1.44%. Dow Jones Industrial Average futures slid 50 points, or 0.1%.

    In Asia, Japan’s Nikkei 225 fell 1% while the Topix gained 0.59%. The Kospi dropped 2.51%, while the small-cap Kosdaq declined 0.93%. Australia’s benchmark S&P/ASX 200 was flat. Hong Kong’s Hang Seng index added 0.35%, while mainland China’s CSI 300 declined 0.32%.

    OpenAI Delays IPO Plans, Anthropic Urges Caution

    OpenAI CEO Sam Altman said in an interview published on Saturday that the AI startup would not go public this year. Altman said an IPO for the ChatGPT maker would now would be “ill-advised,” just one month after OpenAI CFO Sarah Friar said it would go public by 2027 at the latest.

    Dario Amodei, CEO of rival Anthropic, said in an essay on Saturday that AI companies need to slow the pace of innovation for their best models due to safety risks. Amodei told CBS News on Sunday that the “toughest dilemma” about such a proposal is what would happen if China did not do the same.

    The AI boom has propelled the stock market to new heights and catalyzed a massive wave of corporate spending on technological infrastructure in recent years. However, this weekend’s developments could indicate that the size of the positive impact to the public market expected through increased efficiency and a string of major IPOs could be less clear than previously believed.

    Oil Prices Surge After Saudi Pipeline Closure

    Oil prices rose more than 2% Sunday night after Saudi Arabia shuttered a key pipeline that bypasses the Strait of Hormuz. U.S. crude prices broke above $100 per barrel last week for the first time since May amid an escalation of conflict in the Middle East.

    Last week’s rally in oil prices dragged on the three major stock averages. The Dow slid 1.6%, marking its biggest weekly loss since March. The S&P 500 and Nasdaq Composite shed about 0.8% and 0.7%, respectively.

    Federal Reserve Policy Meeting in Focus

    The Federal Reserve gathers for its September policy meeting this week. Fed funds futures traders are pricing in a roughly 86% likelihood of a rate hike, according to CME’s FedWatch tool.

    “The investor playbook from here depends on whether Fed hikes or long rates are the dominant driver of today’s tighter rates environment,” said Julia Hermann, global market strategist at New York Life Investment Management.

    There are no major earnings reports or economic releases expected on Monday.

  • Stock Market Today: Dow, S&P 500, Nasdaq Set for Weekly Decline Ahead of Key Inflation Report

    Stock Market Today: Dow, S&P 500, Nasdaq Set for Weekly Decline Ahead of Key Inflation Report

    Key Economic Data and Earnings Set to Drive Markets as Inflation Concerns Resurface

    Investors face a packed economic calendar this week with critical inflation readings, consumer sentiment data, and notable earnings reports poised to test market resilience amid renewed concerns over energy prices and monetary policy trajectory.

    Inflation and Labor Metrics Take Center Stage

    The August Consumer Price Index (CPI) headlines the data docket. Economists forecast the headline index rose 0.4% month-over-month, accelerating from the previous 0.1% gain, while the year-over-year rate is seen holding steady at 3.4%. Core CPI, which strips out volatile food and energy components, is projected to increase 0.2% for the month — matching July’s pace — with the annual rate expected to tick down to 2.4% from 2.5%.

    Real earnings data will provide insight into household purchasing power. Real average hourly earnings were previously flat year-over-year at -0.1%, while real average weekly earnings edged up 0.1%.

    Consumer Sentiment and Inflation Expectations in Focus

    The University of Michigan’s preliminary September sentiment survey offers a real-time gauge of consumer mood. The headline index is expected to come in at 51, slightly below August’s 51.7 final reading. Current conditions are seen at 51.5 versus 51.9 previously, with expectations at 51 against 51.5.

    Inflation expectations remain elevated. The 1-year outlook previously stood at +4%, while the 5-10 year horizon is expected to hold at +3.3%, matching the prior print.

    Earnings Calendar Highlights

    Corporate reporters include The Kroger Co. (KR) and Rent the Runway (RENT), with results likely to color sector sentiment ahead of the broader reporting season.

    Overnight Headlines: Buyout Speculation, AI Anxiety, and Energy Surge

    PayPal Keeps Strategic Options Open Amid Takeover Chatter

    PayPal’s chief executive addressed persistent buyout rumors, stating the payments giant is “keeping options open” regarding its strategic direction. The comments come as the stock trades well below pandemic-era highs, fueling speculation about potential private-equity interest or a transformative deal.

    Adobe Forecast Miss Reignites AI Monetization Worries

    Shares of Adobe slumped after the software leader issued a revenue forecast that fell short of Wall Street estimates. The miss renewed investor anxiety over the pace at which generative AI features can be monetized across its Creative Cloud franchise, a concern rippling through the broader software sector.

    Trump Proposes Eliminating H-1B Grace Period for Laid-Off Workers

    Former President Donald Trump announced a proposal to end the 60-day grace period that allows H-1B visa holders to remain in the U.S. after job loss. The move would significantly tighten the window for skilled foreign workers to find new sponsorship, escalating the immigration debate ahead of the 2024 election.

    Global Bond Selloff Intensifies as Oil Rally Fans Inflation Fears

    Government bonds worldwide came under pressure as surging crude prices amplified concerns that sticky inflation will keep central banks restrictive for longer. The selloff pushed yields higher across major developed markets, pressuring rate-sensitive equities.

    U.S. Diesel Tops $6 a Gallon for First Time, GasBuddy Reports

    The national average price for diesel fuel breached $6 per gallon, a historic milestone documented by fuel-tracking service GasBuddy. The surge adds to transportation cost pressures and threatens to feed into broader consumer price indices in coming months.

  • Oil Prices Dip Yet Stay on Track to Close Week Above $100

    Oil Prices Dip Yet Stay on Track to Close Week Above $100

    Oil prices pulled back on Friday but remained on track for a weekly gain of nearly 9% after surging above $100 a barrel for the first time in months. Brent crude futures, the global benchmark, fell 2.4% to trade at $105.03 a barrel, while U.S. West Texas Intermediate (WTI) slipped 2.75% to $99.66 per barrel. On Thursday, Brent peaked near $108 a barrel and WTI topped $104.

    Diplomatic Signals Trigger Pullback

    The decline followed reports from Iranian state media that Tehran will meet with Gulf states in Oman to discuss the Strait of Hormuz, signaling diplomatic engagement despite a week of sharp escalation. Brent futures were on course for a weekly gain of 9%, set to close the week above the critical $100 mark for the first time since mid-May. WTI’s week-to-date gain stood at 8.9%. Friday’s drop snapped five consecutive days of gains for Brent and an eight-day winning streak for WTI.

    Markets Brace for Protracted Conflict

    Traders are pricing in a prolonged Iran conflict, reacting to escalating tensions in the Middle East and a Wall Street Journal report that top White House advisors discussed with President Donald Trump the possibility that the conflict could extend beyond his current term. Trump has said the conflict will end after the U.S. midterm elections in November, adding that oil and gas prices will also fall after the critical vote.

    Geopolitical Fears Dominate Trading

    “Once again, it is geopolitical fears driving everything,” Deutsche Bank’s Jim Reid said in a Friday morning note. “In terms of the latest Middle East headlines, yesterday saw growing concerns over the safety of Red Sea shipping, and the potential knock-on effects for Saudi oil exports, as Houthi rebels captured Yemen’s port city of Mokha, which is located close to the Bab el-Mandeb Strait on the southern end of the Red Sea. The mood also wasn’t helped by news that Saudi Arabia’s oil output has fallen to its lowest since 1990.”

    Analyst Weighs Structural vs. Transitory Supply Deficit

    Tamas Varga, an analyst at PVM Oil Associates, told CNBC that the key question for investors is whether the current supply deficit is structural or transitory. “While further spikes cannot be ruled out and re-visiting the April peak of $126 remains a possibility as global and regional oil inventories keep drawing down, it must be noted that [the] higher oil prices climb, the more demand will be obliterated,” he said. “The difference between the current crisis and… the one experienced in 1990, during the first Gulf War, is that today oil is more elastic than 35 years ago.”

    Renewables Accelerate Demand Shift

    Varga said renewable energy is “more than capable” of replacing “certain parts of the barrel,” especially in electricity generation. “It appears only a question of time that the gap between global oil supply and demand will narrow, either by supply increasing in case of a truce or demand decreases, due to the widespread use of alternative energy sources,” he added. “In the interim, further oil price strength is very much possible, but it would be surprising to see it lasting beyond 2026.”

  • 10-year Treasury yield tops 4.9%, highest since 2023, as oil surge raises inflation fears

    10-year Treasury yield tops 4.9%, highest since 2023, as oil surge raises inflation fears

    Treasury Yields Surge to Multiyear Highs as Oil Tops $100

    U.S. Treasury yields climbed to multiyear highs on Thursday, driven by a spike in oil prices that overshadowed a relatively benign wholesale inflation report. The benchmark 10-year Treasury note yield rose more than 6 basis points to 4.908%, marking its highest level since November 2023. This yield serves as a critical reference point for mortgage rates, auto loans, and credit card debt.

    Short- and Long-Term Yields Follow Suit

    The 2-year Treasury note yield, which is highly sensitive to near-term Federal Reserve policy expectations, reached 4.518% — its highest point since July 2023. Meanwhile, the 30-year Treasury bond yield advanced more than 4 basis points to 5.332%, reflecting broader geopolitical risk premiums. Yields move inversely to prices; one basis point equals 0.01%.

    Oil Price Spike Fuels Inflation Concerns

    The selloff in bonds accelerated after U.S. oil prices breached $100 per barrel on Thursday, stoked by fears of a prolonged Middle East conflict involving the U.S. and Iran. Higher energy costs threaten to reignite inflationary pressures, potentially altering the trajectory of interest rates.

    Wholesale Inflation Data Comes In Mixed

    Thursday’s Producer Price Index (PPI) report showed headline wholesale prices rose 0.4% in August, matching Dow Jones consensus estimates. Excluding volatile food and energy categories, core PPI increased just 0.2%, coming in below the forecasted 0.3% gain. The data did little to calm markets already focused on the oil-driven inflation risk.

    Treasury Buyback Adds to Supply Dynamics

    Yields had already risen Wednesday following an announcement by Treasury Secretary Scott Bessent that the department would buy back $6 billion of longer-dated government bonds. The operation added to the supply-side narrative pressuring longer maturities.

    Focus Shifts to CPI and Fed Decision

    With the PPI data released and the 10-year yield testing multiyear peaks, investors are now turning their attention to Friday’s Consumer Price Index (CPI) report for a clearer picture of consumer-level inflation. Next week’s Federal Reserve interest rate decision will be the next major catalyst for rate markets.

  • Stock Market Today: Live Updates on Market Moves

    Stock Market Today: Live Updates on Market Moves

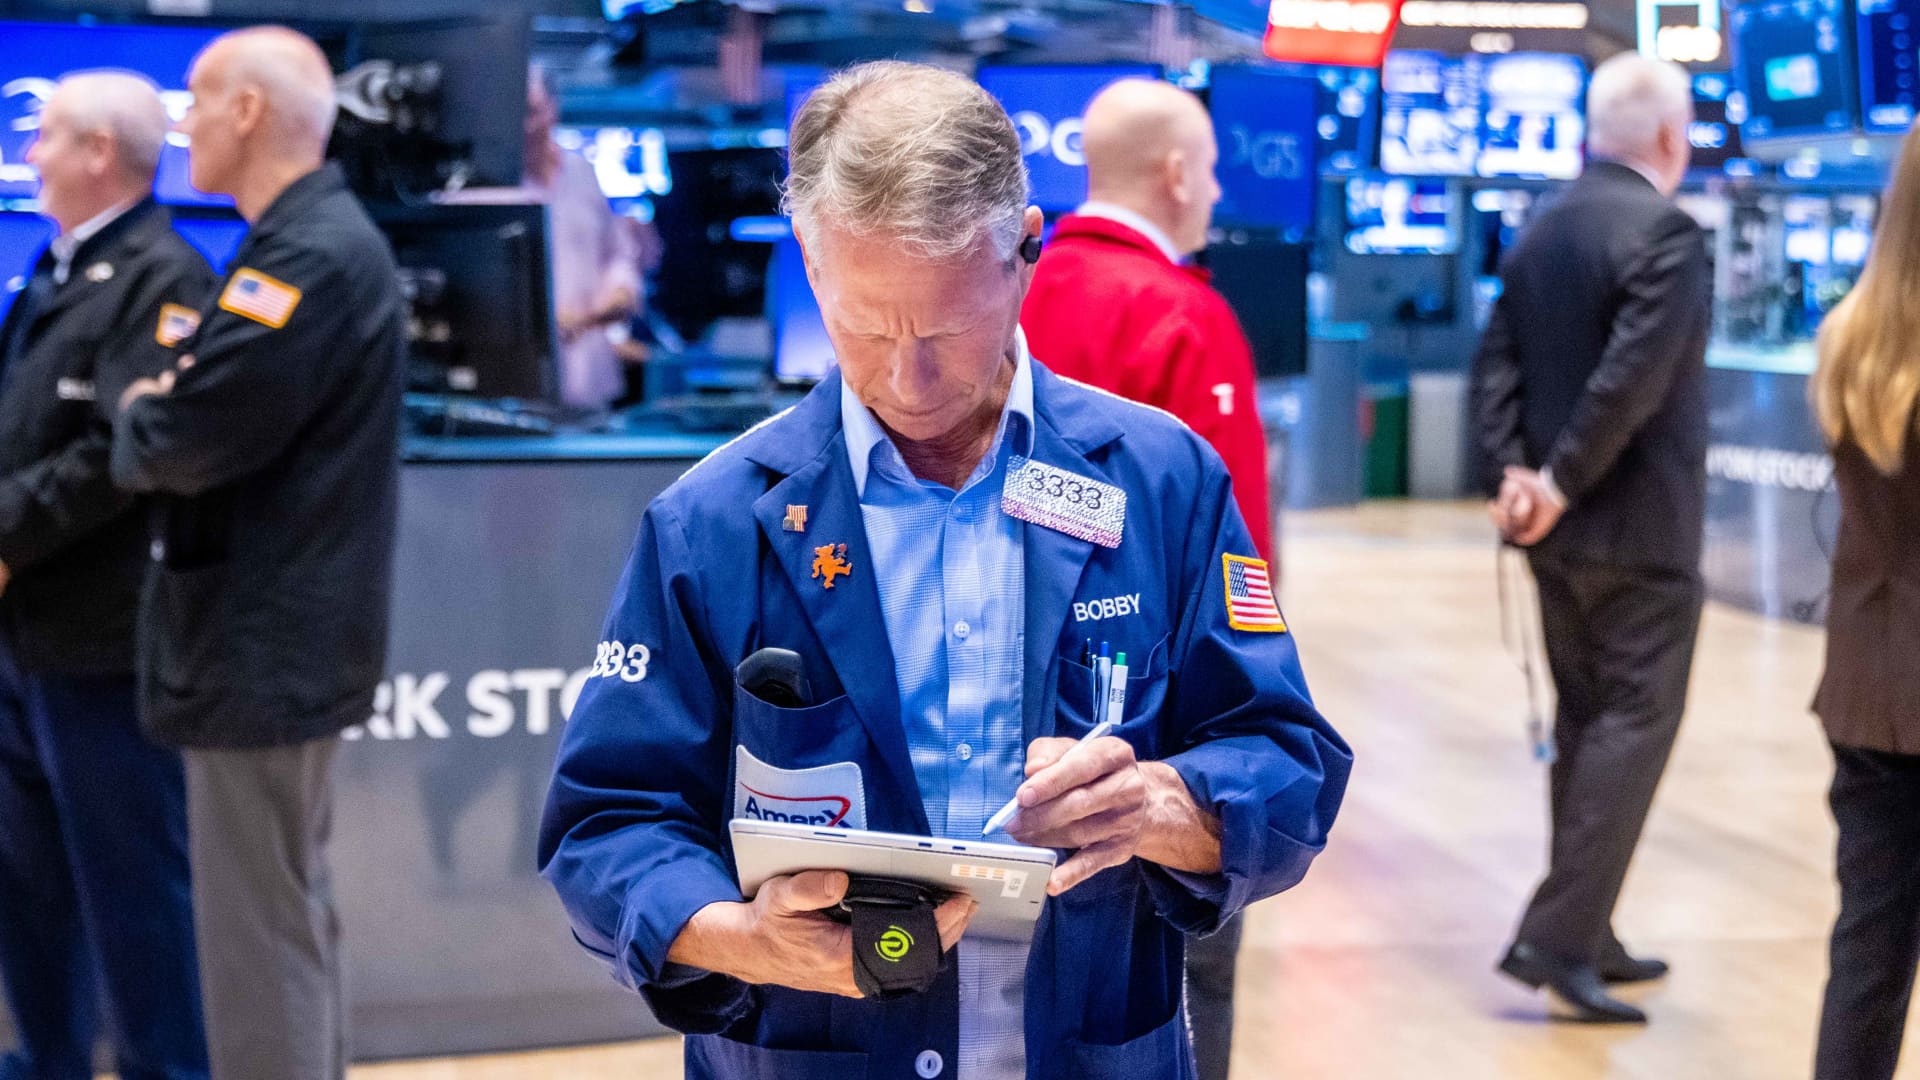
    Traders worked the floor of the New York Stock Exchange on Aug. 25, 2026, as U.S. equities slid Thursday after domestic oil prices surged past $100 a barrel. The selloff reflected mounting anxiety that a prolonged conflict in the Middle East would fuel higher inflation and keep interest rates elevated for longer.

    Major Indexes Finish Lower

    The Dow Jones Industrial Average fell 195 points, or 0.4%. The S&P 500 declined 0.6%, while the Nasdaq Composite dropped 0.9%. The three major averages extended a losing streak to three sessions.

    Oil Prices Jump on Geopolitical Tensions

    Crude prices continued to weigh on market sentiment as the war between the U.S. and Iran entered its seventh month. U.S. West Texas Intermediate futures for October delivery climbed above $100 per barrel, while the international benchmark Brent crude for November spiked above $105 a barrel.

    Treasury Yields Hit Multi-Month Highs

    The rally in energy pushed the benchmark 10-year Treasury yield above 4.9%, its highest level since November 2023. Rising yields pressured rate-sensitive growth sectors, particularly high-beta semiconductor stocks that have led the bull market.

    Chip Stocks Lead Sector Declines

    Intel shares fell 3%, and Micron Technology declined 2%, as investors worried that higher borrowing costs and energy expenses could slow economic growth and dampen demand for semiconductors.

    Wholesale Inflation Data Fails to Soothe Nerves

    A relatively tame producer price index report did little to calm fears. The PPI rose a seasonally adjusted 0.4% in August, matching the Dow Jones consensus. On an annual basis, wholesale inflation stood at 5.4%, well above the Federal Reserve’s 2% target.

    The data arrives ahead of Friday’s closely watched consumer price index. Both gauges feed into the Fed’s preferred inflation metric, the personal consumption expenditures price index, which will not be released until after the central bank’s rate decision on Sept. 16.

    Analyst Perspective: PPI Inconclusive, Oil and Yields Raise Stakes

    “The PPI release itself was inconclusive, in that doesn’t really help to settle the question of ‘hike or no hike’ from the Fed next week, but WTI oil prices surging back above $100 and Treasury yields hitting new highs is certainly raising the stakes for investors ahead of tomorrow’s crucial CPI report,” wrote Stephen Coltman, head of macro at 21shares.

    Fed Hike Probability Climbs to 74%

    Fed funds futures were last pricing in a 74% likelihood of a quarter-point rate increase following next week’s policy meeting, according to the CME FedWatch Tool.

    Treasury Buyback Announcement Adds to Pressure

    The market’s three-day slide accelerated after the Treasury Department said it would buy back up to $6 billion in longer-term debt — triple the usual amount. Less than a month earlier, the Treasury had announced it would more than double the size of its $2 billion government debt repurchase operations.

    — CNBC’s Jeff Cox and Spencer Kimball contributed to this report.

  • $100 Oil Could Be Bitcoin’s Next Problem

    $100 Oil Could Be Bitcoin’s Next Problem

    Oil Surges Toward $100 as Iran Tensions Escalate

    Brent crude reached a seven-week high near $99 a barrel this week, while West Texas Intermediate climbed above $92. The rally follows Iran’s announcement that it plans to declare a maritime “exclusion zone” around the Strait of Hormuz, warning it will stop ships attempting to pass without permission. This escalation comes after U.S. strikes targeted three Iranian oil tankers over the weekend. Iran has promised a “more intense” response, and Brent prices have surged close to 20% over the past month.

    Why Rising Crude Creates an Inflation Problem

    Oil functions as more than transportation fuel. It feeds directly into shipping costs, plastics manufacturing, fertilizer production, and food supply chains. When crude prices spike this rapidly, the increases appear at gas pumps within days and in grocery bills within weeks. U.S. inflation was already running above the Federal Reserve’s 2% target before this latest geopolitical flare-up. Fed Chair Kevin Warsh has maintained a hawkish stance through the summer, and traders are now pricing in genuine odds of a rate hike rather than a cut, a scenario that appeared unthinkable a year ago.

    The Federal Reserve Faces a Policy Trap

    The Fed balances two sometimes conflicting mandates: controlling inflation and maintaining a healthy labor market. A cooling jobs picture typically argues for lower rates. However, if oil-driven inflation continues climbing, cutting rates risks exacerbating price pressures. Should oil remain near $100, the Fed may delay cuts it would otherwise implement, or hold rates higher for longer than markets currently anticipate. Some forecasters now place the probability of a September rate hike above 50%.

    How Higher Rates Pressure Bitcoin

    Bitcoin offers no yield comparable to bonds or savings accounts. When interest rates and Treasury yields rise, investors gain a superior risk-free alternative, prompting capital to flow out of assets like Bitcoin and into fixed income or cash. Higher rates also tighten overall financial system liquidity, the total pool of money available to chase risk assets. Reduced liquidity generally translates to weaker demand for Bitcoin. When U.S. strikes on Iranian tankers pushed oil higher this week, Bitcoin slipped toward $79,700. A similar pattern emerged on September 2, when renewed conflict drove Brent higher and Bitcoin fell roughly 1.5%.

    Bitcoin’s Safe-Haven Narrative Faces Reality Check

    A Middle East war might appear to be the type of event that drives investors toward Bitcoin as a hedge. In practice, that correlation has not materialized. Bitcoin has largely moved in tandem with equities during this conflict, declining when tensions escalate and stabilizing when they ease. Geopolitical fear alone does not drive capital into Bitcoin. Instead, Bitcoin responds to the direction of interest rates, yields, and overall market liquidity. Geopolitical events matter to Bitcoin only to the extent they alter those financial conditions.

    Potential Bullish Reversal Scenario

    One scenario could eventually benefit Bitcoin. If sustained $100+ oil chokes consumer spending and slows the economy severely enough, the Fed may ultimately be forced to cut rates aggressively to support growth, even with inflation remaining elevated. Should expensive energy damage growth sufficiently to compel aggressive monetary easing, the resulting easier financial conditions could become supportive for Bitcoin. However, a sharp economic slowdown could still pressure risk assets before that liquidity benefit emerges.

    The Critical $100 Oil Threshold

    The $100 per barrel mark represents a psychological and policy inflection point. Below that level, this episode likely remains a volatility event: Bitcoin dips on headlines and recovers as tensions ease. Above it, and sustained, the situation becomes a macroeconomic problem that reshapes Fed policy for months. In that environment, Bitcoin’s trajectory depends less on Iran and more on what Jerome Powell’s successor decides to do next.

  • Bitcoin Holds Steady as US Strikes on Iran Rattle Stocks and Send Oil Prices Higher

    Bitcoin Holds Steady as US Strikes on Iran Rattle Stocks and Send Oil Prices Higher

    Bitcoin remained above $78,000 on Monday despite fresh U.S. strikes on Iran, higher oil prices and losses across major stock indexes. The cryptocurrency traded near $78,623, down 0.7% over 24 hours, after falling to an intraday low of about $77,162, according to CoinGecko.

    Despite the daily decline, Bitcoin is on track to finish August more than 24% higher. That would make it the cryptocurrency’s strongest monthly performance since 2017.

    Bitcoin holds steady as geopolitical risks rise

    The weekend saw the first exchange of U.S.-Iran strikes since late July, renewing concerns about shipping through the Strait of Hormuz and driving crude oil prices higher.

    West Texas Intermediate futures rose 2.6% to approximately $85.60 a barrel. U.S. equities moved lower, with the S&P 500 down 0.5% at around 7,673 and the Nasdaq Composite falling 0.4% to about 26,289.

    Iliya Kalchev, an analyst at Nexo Dispatch, said Bitcoin’s resilience was more significant than its August gain. Kalchev noted that a hawkish Federal Reserve and an active geopolitical escalation rarely affect risk assets in the same week, making Bitcoin’s ability to hold its ground against both pressures a notable signal.

    Kalchev also pointed to derivatives data indicating that traders may be repositioning rather than adding significant new capital. Twenty-four-hour trading volume more than doubled to $183 billion, while open interest remained broadly unchanged.

    Fed policy weighs on crypto markets

    Bitcoin also faced pressure from Fed Chair Kevin Warsh’s hawkish address at Jackson Hole. Expectations for a September rate hike climbed to approximately 58%, compared with about 35% before his remarks.

    Gold also declined, slipping to nearly $4,440 as the stronger interest-rate outlook outweighed its typical safe-haven appeal.

    Bitcoin’s August rally lost momentum late last week following Warsh’s comments. Spot Bitcoin ETFs ended a nine-day streak of inflows, while Ethereum funds continued to attract investor money.

    Ethereum traded near $2,448 on Monday, registering a modest decline while remaining on course for an August gain approaching 30%.

    Market attention now shifts to Friday’s U.S. jobs report and the August consumer price index reading scheduled for September 11.

  • Bitcoin Holds Above $78K as U.S.–Iran Clash Pushes Oil Prices Higher

    Bitcoin Holds Above $78K as U.S.–Iran Clash Pushes Oil Prices Higher

    Bitcoin traded near $77,900 on Aug. 31 as renewed fighting between the United States and Iran pushed oil prices higher and pressured global equity markets. The cryptocurrency remained relatively stable despite sharp moves across energy, bond and stock markets after U.S. strikes on Iran’s Larak Island.

    Bitcoin holds near $78,000 as oil prices climb

    Bitcoin was down approximately 0.4% over 24 hours after trading between $77,162 and $79,343. The limited move contrasted with a stronger reaction in other markets following the strikes.

    An unnamed U.S. official confirmed that American forces targeted two Iranian rocket launchers. According to Reuters, the official claimed Iran’s Islamic Revolutionary Guard Corps was preparing rockets carrying sea mines for deployment in the Strait of Hormuz.

    Iran said the attack killed and wounded soldiers and civilians. The Revolutionary Guards promised a “response and punishment,” but did not immediately provide casualty figures or details of further action.

    Brent crude climbed approximately 2.7% to $90.51 per barrel during Monday’s Asian session. West Texas Intermediate traded near $85.23 after gaining more than 2%.

    The oil price increases reflected renewed concern about shipping through the Strait of Hormuz, a key route for global oil and liquefied natural gas movements. Military activity near the waterway can therefore affect energy prices and inflation expectations.

    Asian equities declined, while Nasdaq 100 futures fell between 0.5% and 0.7% across early market readings. Gold also failed to attract sustained safe-haven demand, falling approximately 0.8% to around $4,418 per ounce in the cited market snapshot.

    Bitcoin remained close to $78,000. Its stability does not prove that $BTC has permanently become a geopolitical hedge, but it shows that the latest escalation did not trigger the immediate cryptocurrency sell-off seen during some earlier risk events.

    Bitcoin’s daily chart also pointed to short-term strength. $BTC traded near $78,084, comfortably above the Bollinger Bands’ $72,471 midpoint but below the $86,255 upper band. The bands widened after the latest rally, indicating higher volatility.

    The relative strength index stood at 69.91, just below overbought territory, after recently crossing 70. The reading reflects strong momentum but also leaves Bitcoin vulnerable to consolidation. Daily volume of about 4,200 $BTC remained below the initial breakout spike, suggesting buyers may need stronger participation to challenge $80,000.

    Bitcoin ($BTC) price chart, source: crypto.news

    Bitcoin also held above $62,000 during July’s U.S.–Iran strikes, even as oil, bonds and Asian stocks recorded larger moves.

    Bitcoin outperformed gold and Nasdaq in August

    Bitcoin gained approximately 23% during August, compared with reported advances of 9% for gold and 4% for the Nasdaq. The cryptocurrency was therefore the strongest performer among the three assets over the month.

    The broader crypto market showed less resilience on Monday. XRP declined approximately 0.8%, while Solana lost around 0.6%. Ether traded near $1,625 as traders reduced exposure to several major altcoins.

    Part of Bitcoin’s monthly performance followed renewed institutional demand through U.S. spot exchange-traded funds. The products accumulated approximately $2.8 billion across eight consecutive inflow sessions during the recovery from Bitcoin’s August lows.

    The streak ended on Friday. U.S. spot Bitcoin ETFs recorded an estimated $201.9 million in net outflows on Aug. 28, according to Farside. The reversal indicates that ETF demand should not be characterized as uninterrupted.

    Bitcoin’s rally from approximately $63,500 had previously been supported by eight consecutive ETF inflow sessions, although declining futures exposure indicated that leverage was not the only source of demand.

    Federal Reserve policy adds uncertainty to Bitcoin’s outlook

    The geopolitical escalation followed Federal Reserve Chair Kevin Warsh’s restrictive policy message at the Jackson Hole symposium on Aug. 28.

    Warsh said inflation remained too high, while labor markets were stable and economic output was solid. According to his published remarks, he said most Federal Open Market Committee members preferred to await more information before deciding whether another policy change was appropriate.

    Markets interpreted the speech as increasing the possibility of another interest-rate rise. Fed funds futures placed the probability of a September increase near 57% to 60%, up from approximately 35% before the address. The estimate represents market pricing rather than a Federal Reserve commitment.

    Higher oil prices could further complicate the outlook. Sustained energy price increases can raise transportation and production costs, making it more difficult for inflation to return toward the Federal Reserve’s 2% objective.

    Sept. 4 jobs report is the next major Bitcoin catalyst

    The next major U.S. market catalyst is the August employment report, scheduled for Sept. 4 at 8:30 a.m. ET, according to the Bureau of Labor Statistics calendar.

    Strong employment data could reinforce expectations for tighter monetary policy. A weaker report could reduce rate-hike forecasts, although the market response would also depend on wage growth and unemployment.

    Bitcoin’s immediate technical range remains between support around $77,000 and resistance extending from approximately $79,400 to $80,800. These levels are market observations rather than guaranteed reversal points.

    The durability of Bitcoin’s relative strength will depend on whether it remains stable if oil prices continue rising, equity losses deepen or interest-rate expectations move higher. ETF flows and the Sept. 4 labor report will provide the next evidence.

  • Bitcoin Barely Moves as U.S. Hits Iran, Sending Oil Prices Higher and Stocks Lower

    Bitcoin Barely Moves as U.S. Hits Iran, Sending Oil Prices Higher and Stocks Lower

    Geopolitical tensions have returned to financial markets, pushing oil prices higher. Bitcoin, however, remained steady during Asian trading hours, demonstrating resilience and continuing to outperform gold and equities—a trend that has persisted throughout August.

    Oil prices climbed on both sides of the Atlantic after the United States attacked an Iranian island in the Strait of Hormuz, a major oil-tanker route that has faced disruption since the conflict began six months ago. Iran responded with retaliatory action.

    Oil rises as markets react to Strait of Hormuz tensions

    WTI crude futures jumped nearly 2% to $85.10, while Brent crude rose 1.9% to $92.39, according to TradingView. Gold fell 0.8% to $4,418 per ounce, and Nasdaq futures slipped 0.5% amid declines across Asian equity markets.

    Bitcoin outperforms gold and stocks

    Bitcoin traded near $77,580, remaining largely unchanged since midnight UTC, according to CoinDesk. $BTC’s price has risen 23% this month, compared with a 9% gain for gold and a 4% increase for the Nasdaq.

    Other major cryptocurrencies traded slightly lower. Payments-focused $XRP ($XRP) declined 0.8%, while Solana (SOL) fell 0.6%.

    Bitcoin’s continued outperformance may be linked to strong inflows into spot exchange-traded funds and expectations of aggressive Federal Reserve intervention following the Treasury’s bond buyback program.