
Tag: Layer 2

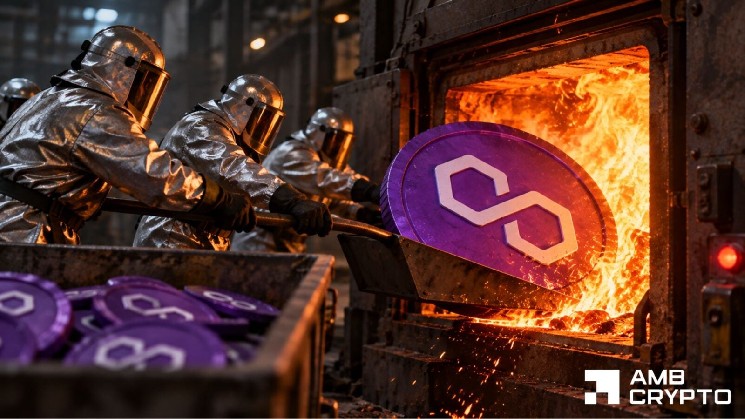
  • Polygon Price Rises 12% Since 100M POL Burn — Can It Hold Above $0.11?

    Polygon Price Rises 12% Since 100M POL Burn — Can It Hold Above $0.11?

    Key Highlights

    • Polygon permanently burned 100 million $POL tokens—approximately 1% of total supply—worth roughly $10.22 million on September 23.
    • $POL has surged nearly 12% since the burn, trading near $0.113, but faces immediate resistance at the $0.115 level.
    • The burn introduces a community-governed, fee-funded mechanism linking future token removal directly to Polygon network activity.

    Polygon Executes Major $POL Token Burn, Removing 1% of Supply

    Polygon has completed a significant token burn, permanently removing 100 million $POL from circulation on September 23. The transaction, confirmed by Polygon Foundation CEO Sandeep Nailwal, destroyed tokens valued at approximately $10.22 million at the time of execution. This reduction represents roughly 1% of the token’s total supply and marks the activation of a new deflationary mechanism designed to tie future burns directly to network usage fees.

    Fee-Funded Burn Mechanism Links Supply Reduction to Network Activity

    The burned tokens originated from network fees accumulated within Polygon’s fee-collection system. Beyond the immediate supply reduction, the event inaugurates a process allowing the community to trigger subsequent fee-funded burns. This governance feature creates a direct feedback loop: as transaction activity on the Polygon network generates fees, the community can vote to destroy a portion of those fees, dynamically adjusting supply in response to real-time demand for blockspace.

    $POL Price Action Tests Critical Resistance at $0.115

    Since the burn, $POL has appreciated approximately 11.6%, climbing to the $0.113 area at the time of writing. The token briefly touched $0.11497 during the most recent session but failed to sustain momentum above the $0.115 threshold. Technical analysts identify this level as the nearest hurdle for buyers; a decisive break could open a path toward the $0.12 price level. However, the $0.12–$0.125 zone may present stiffer resistance, as the market previously staged a sharp rejection there earlier in September.

    Support Levels and Demand Dynamics Will Determine Next Move

    On the downside, the $0.107–$0.110 range serves as the first critical support. Holding this band would signal that buyers remain committed to the post-burn recovery. A breakdown below that area could see price retrace toward $0.102, near the launch point of the current advance. While the burn strengthens Polygon’s supply-reduction narrative, sustained price appreciation remains contingent on sufficient demand to defend and build upon recent gains.

    Why This Matters

    Polygon’s shift to a programmatic, fee-based burn model represents a maturation of tokenomics for a major Layer 2 scaling solution. Unlike one-time manual burns, the new mechanism embeds deflationary pressure into the protocol’s ongoing operations, aligning tokenholder incentives with network adoption. For investors and developers, the key metric to monitor will be whether rising Polygon network activity—measured in transaction fees—translates into consistent community-approved burns that meaningfully contract supply over time. The immediate price test at $0.115 will also serve as an early gauge of market confidence in this revised economic design.

    Frequently Asked Questions

    How many $POL tokens were burned and what was their value?

    Polygon permanently destroyed 100 million $POL tokens, worth approximately $10.22 million at the time of the September 23 transaction.

    What makes this burn different from previous token burns?

    This burn activates a recurring, community-governed process that allows future burns to be funded directly from network transaction fees, linking supply reduction to actual Polygon network usage.

    What are the key price levels to watch for $POL after the burn?

    Immediate resistance sits at $0.115; a break could target $0.12, though the $0.12–$0.125 region has previously rejected price. Key support lies between $0.107 and $0.110, with a deeper floor near $0.102.

  • Ethereum Revenue Gap Widens as Robinhood Chain Expands

    Ethereum Revenue Gap Widens as Robinhood Chain Expands

    Key Highlights

    • Robinhood Chain generated $4.5 million in daily transaction fees on September 3, while Ethereum received only $400 for data posting and proof costs.
    • Digital Asset analysis reveals a widening revenue gap where Layer 2 fee revenue largely remains within the L2 ecosystem rather than flowing to Ethereum’s base layer.
    • Traders are monitoring Ethereum’s key support levels and its strategic response as Layer 2 growth challenges the traditional L1 revenue model.

    Robinhood Chain Fee Surge Exposes Ethereum Revenue Disparity

    A new analysis by Digital Asset has thrown a spotlight on the evolving economic relationship between Ethereum and its Layer 2 scaling solutions. On September 3, Robinhood Chain — the Layer 2 network launched by the retail brokerage’s crypto division — collected an estimated $4.5 million in daily transaction fees. In stark contrast, the Ethereum mainnet received only $400 for data posting and proof verification costs associated with that same activity. The finding underscores a structural shift in where value accrues within the modular blockchain stack.

    Layer 2 Economics Decouple from Base Layer Revenue

    The data reveals a growing divergence: as Layer 2 networks like Robinhood Chain, Arbitrum, Optimism, and Base attract higher transaction volumes, the bulk of fee revenue is captured by the L2 sequencers and their respective ecosystems. Ethereum’s role has increasingly narrowed to that of a settlement and data availability layer, compensated only for the marginal cost of calldata and zero-knowledge proof verification. This dynamic raises fundamental questions about the long-term sustainability of Ethereum’s revenue model, which historically relied on execution fees burned via EIP-1559 to create deflationary pressure on ETH supply.

    Market Context: Ethereum Navigates Technical Resistance

    The revenue analysis arrives as Ethereum’s price action tests critical resistance levels amid mixed macro signals. Traders are weighing the implications of diminishing L1 fee capture against the network’s broader value proposition as a neutral settlement layer. While total value locked across Ethereum Layer 2s continues to climb — surpassing $40 billion across major rollups — the native token’s fee-burn mechanism has seen reduced activity during periods of low L1 congestion. Analysts note that unless Ethereum implements protocol-level changes such as EIP-7781 (proposed slot time reduction) or increases blob throughput via EIP-4844 expansions, the revenue gap may widen further.

    Why This Matters

    The revenue disparity highlights a pivotal tension in Ethereum’s rollup-centric roadmap. The network’s long-term thesis — that scaling through Layer 2s would expand total blockspace demand and ultimately benefit ETH holders through increased settlement demand — is being tested in real time. If L2s successfully internalize sequencing revenue while contributing minimally to base-layer fees, Ethereum may need to explore alternative value capture mechanisms, such as native staking yield enhancements, MEV redistribution, or protocol-owned liquidity strategies. Meanwhile, Robinhood Chain’s fee performance signals strong retail adoption of its low-cost environment, potentially accelerating the onboarding of mainstream users into self-custodied DeFi — a development that could expand the total addressable market for onchain applications even as the revenue split evolves.

    Frequently Asked Questions

    How much did Robinhood Chain earn in fees on September 3 compared to Ethereum?
    Robinhood Chain collected approximately $4.5 million in daily transaction fees, while Ethereum received only $400 for data posting and proof verification costs related to that L2 activity.
    Why does Ethereum receive so little revenue from Layer 2 transactions?
    Ethereum’s role in the modular stack is limited to data availability and settlement. L2 sequencers batch transactions and post only compressed calldata or validity proofs to Ethereum, paying base-layer fees only for that marginal footprint — not for the execution fees users pay on the L2.
    What are traders watching regarding Ethereum’s response to this trend?
    Market participants are monitoring Ethereum’s key technical support levels, upcoming protocol upgrades (such as increased blob capacity and potential slot time reductions), and whether the network can adapt its value capture model to remain economically sustainable as L2 activity grows.
  • Polygon to Burn 100M POL as Revenue Hits $24.5M, Token Impact Uncertain

    Polygon to Burn 100M POL as Revenue Hits $24.5M, Token Impact Uncertain

    Key Highlights

    • Polygon Foundation CEO Sandeep Nailwal announced a plan to permanently burn 100 million $POL tokens, representing approximately 1% of the circulating supply, pending Security Council approval.
    • The burn mechanism is fueled by protocol revenue that reached $24.5 million year-to-date, with DeFiLlama data confirming annual revenue crossing $25 million—a two-year high.
    • $POL price surged 10% on the announcement, contributing to a weekly 20% recovery, though whale sell-offs of over 30 million tokens and resistance at the 50-week moving average ($0.11) pose near-term headwinds.

    Polygon Unveils Aggressive $POL Deflationary Strategy Ahead of Anticipated Bull Cycle

    Polygon Foundation CEO Sandeep Nailwal took to X on Friday to outline a bold tokenomics shift designed to position the network for the next cryptocurrency market upswing. The centerpiece of the announcement is a proposal to permanently remove 100 million $POL tokens from circulation—a figure equivalent to roughly 1% of the current circulating supply. The initiative is funded directly by the protocol’s own revenue streams, which Nailwal highlighted have reached $24.5 million year-to-date. The proposal currently awaits final sign-off from the Polygon Security Council before implementation can begin, after which the foundation intends to conduct manual quarterly burns.

    Polygon is printing revenue. $24.5m YTD. We are deploying a change that lets anyone in the community trigger its burn.

    — Sandeep Nailwal, CEO, Polygon Foundation

    Revenue Growth and Competitive Positioning Drive the Burn Mechanism

    The burn capacity is anchored in Polygon’s evolving revenue model. Base fees on the network automatically accumulate $POL in a collector wallet, which currently holds 121 million $POL valued at approximately $1.2 million. According to data from DeFiLlama, the protocol’s annualized revenue has surpassed $25 million, marking a two-year high. Nailwal asserted that Polygon’s strategic pivot toward payments—specifically stablecoin-based transfers—has yielded fee traction three times that of Arbitrum and five times that of Near Protocol. This revenue foundation is what makes the recurring burn mechanism sustainable, moving beyond a one-time event to a structural deflationary feature.

    Market Reaction: Price Surge Meets Technical Resistance and Whale Selling

    The announcement catalyzed an immediate market response, with $POL surging 10% on Friday. The move extended the token’s weekly gain to 20%, aided by a broader market tailwind as Bitcoin reclaimed the $80,000 level. However, the rally unfolds against a backdrop of significant technical hurdles. The token had previously rallied 80% in Q3, climbing from $0.07 to $0.11, before a sharp pullback in late August. Since September, price action has consolidated above the $0.09 support level, which coincides with the 200-day Moving Average.

    Overhead Resistance and On-Chain Signals Temper Optimism

    While the daily Relative Strength Index (RSI) remained below overbought territory at press time—suggesting room for further upside—the Average True Range (ATR) was flat, signaling low volatility that could make a decisive breakout difficult. The $0.11 level represents a critical confluence of resistance: it marked the local high of the August rally and aligns with the 50-week Moving Average, which previously capped gains. Adding to the selling pressure, on-chain analytics from Santiment revealed that key whale wallets dumped over 30 million $POL in the last three days. This profit-taking activity could stall the recovery, increasing the probability of a retest of the $0.09 support if the $0.11 barrier holds. Conversely, a clean break above the 50-week MA could signal the start of the next major recovery leg.

    Why This Matters

    Polygon’s move signals a maturation of Layer 2 tokenomics, shifting from inflationary emissions to a revenue-backed, deflationary model. By tying token burns directly to protocol fees—generated largely through stablecoin payment volume—Polygon creates a direct feedback loop between network utility and token scarcity. This contrasts with many peers that rely solely on staking rewards or fixed supply caps. The initiative also underscores the growing importance of real-yield metrics in crypto valuation; DeFiLlama’s verification of $25M+ annual revenue provides a tangible fundamental anchor. For investors, the interplay between the new burn mechanism, whale distribution patterns, and the $0.11 technical resistance will be the key variables determining whether $POL can convert short-term speculative interest into a sustained trend reversal.

    Frequently Asked Questions

    What triggers the $POL token burn and how much will be removed?

    The burn is triggered by protocol revenue accumulated in the collector wallet, which currently holds 121 million $POL. The initial proposal seeks to permanently burn 100 million $POL—approximately 1% of circulating supply—pending Security Council approval, followed by manual quarterly burns thereafter.

    How does Polygon’s revenue compare to competing Layer 2 networks?

    According to CEO Sandeep Nailwal, Polygon’s fee traction from stablecoin-based payments is currently 3x that of Arbitrum and 5x that of Near Protocol. DeFiLlama data corroborates this, showing Polygon’s annualized revenue crossing $25 million, a two-year high.

    What are the key price levels to watch for $POL following the burn announcement?

    Immediate resistance sits at $0.11, which aligns with the 50-week Moving Average and the August local high. Support is established at $0.09, reinforced by the 200-day Moving Average. A break above $0.11 could signal trend continuation, while rejection may lead to a retest of $0.09, especially given recent whale selling of over 30 million tokens.