Tag: Glassnode

  • What’s Driving Bitcoin’s Rise? Glassnode and CryptoQuant CEOs Explain

    What’s Driving Bitcoin’s Rise? Glassnode and CryptoQuant CEOs Explain

    Key Highlights

    • Bitcoin surged past $85,000 as short-position liquidations between $82,000 and $86,000 accelerated upward momentum, according to Glassnode on-chain data.
    • CryptoQuant CEO Ki Young Ju confirmed Bitcoin has reclaimed the critical 365-day moving average at approximately $83,000, a level widely watched to signal the end of the bear market.
    • Analysts suggest sustained trading above the 365-day MA could trigger increased buying pressure from trend-following and institutional investors driven by FOMO.

    Short-Position Liquidations Fuel Bitcoin’s Break Above $85,000

    Bitcoin opened the week with a decisive move above the $85,000 threshold, marking its highest level in months. On-chain analytics firm Glassnode attributes the acceleration to a cascade of short-position liquidations clustered between $82,000 and $86,000. According to Glassnode data, a significant volume of short liquidity had accumulated in this range over recent months. When Bitcoin failed to produce the sharp pullbacks many traders anticipated, those holding short positions were forced to buy back $BTC to cover, creating a feedback loop that propelled prices higher.

    Glassnode analysts described the dynamic in their latest assessment: “As expected, Bitcoin quickly broke through the short liquidation wall.” They elaborated that the rejection at this level proved insufficient to halt the advance: “Short positions accumulated between $82,000 and $86,000 over the months, but the rejection at that level was insufficient. Now these short positions have become fuel, because these traders need to buy back $BTC.” This short-covering rally has effectively turned prior bearish positioning into buying pressure.

    365-Day Moving Average Reclaimed: A Critical Bull-Market Signal

    Adding weight to the bullish narrative, CryptoQuant CEO Ki Young Ju posted on X that Bitcoin has reclaimed its 365-day moving average, currently situated near $83,000, with price action holding above $84,000. Ju emphasized that this long-term trend indicator is a primary reference point for market participants assessing whether the bear market has concluded. CryptoQuant has historically treated a sustained breakout above the 365-day MA as a confirmation signal for a new bull market cycle.

    Ju’s commentary underscored the psychological and structural importance of the level: “Bitcoin reclaimed the 365MA at the $83,000 level and is currently sitting above $84,000.” He further noted the potential for momentum-driven inflows: “This is the line everyone is watching for the end of the bear market. If it holds, momentum will start to drive traders and institutions crazy with FOMO. This is where things get fun.”

    Why This Matters

    The confluence of short-covering dynamics and a key long-term technical reclamation presents a noteworthy inflection point for Bitcoin. The $82,000–$86,000 zone had acted as a liquidity magnet for bearish bets; its clearance removes a structural overhang and may reduce near-term selling pressure from forced liquidations. Simultaneously, the 365-day moving average reclaim is widely regarded by quantitative analysts and institutional desks as a regime-change filter. A daily close above this level, if sustained, could unlock algorithmic trend-following strategies and encourage capital allocation from funds that mandate bull-market confirmation before deploying size. Market participants will now monitor whether Bitcoin can establish support above the 365-day MA and the $84,000–$85,000 band, which would strengthen the case for a durable uptrend.

    Frequently Asked Questions

    What caused Bitcoin’s rapid move above $85,000?

    The surge was driven by a cascade of short-position liquidations. Glassnode data shows a large concentration of short bets between $82,000 and $86,000. When price failed to reverse sharply in that zone, short sellers bought back $BTC to cover, creating a self-reinforcing upward spiral.

    Why is the 365-day moving average so important?

    The 365-day moving average (currently ~$83,000) is a widely watched long-term trend indicator. CryptoQuant and many institutional analysts treat a sustained break above this level as a primary signal that the bear market has ended and a new bull market may be underway.

    What needs to happen for the bullish case to strengthen?

    Analysts will look for Bitcoin to hold above the 365-day MA and the $84,000–$85,000 range on daily closes. Sustained support could trigger additional buying from trend-following algorithms and institutional investors, amplifying momentum.


  • Corporate Treasuries Bought Only 5,900 Bitcoin in Three Months as Demand Signals Weaken

    Corporate Treasuries Bought Only 5,900 Bitcoin in Three Months as Demand Signals Weaken

    Key Highlights:

    • Corporate treasuries hold ~1.22 million BTC with an average cost basis of $80.5K, leaving them ~6% underwater at current prices.
    • Strategy (formerly MicroStrategy) dominates with ~845,050 BTC; Tokyo-listed Metaplanet ranks among the next-largest holders.
    • U.S. spot Bitcoin ETFs have drawn billions since August but remain ~$1 billion negative year-to-date, while the Coinbase premium stays mostly negative, signaling weaker U.S. demand versus offshore markets.

    Corporate Treasury Bitcoin Holdings Sit Underwater as Buying Momentum Stalls

    Corporate treasuries that drove significant Bitcoin accumulation through 2025 have abruptly stepped back, leaving their aggregate position underwater at current market levels. According to on-chain analytics firm Glassnode, the cohort’s average entry price—termed the Corporate Treasury Cost Basis—stands at $80,500, approximately 6% above spot. Bitcoin briefly reclaimed that level in recent sessions but failed to sustain gains, reinforcing the $80.5K threshold as a technical ceiling.

    “Corporate treasuries were a big buyer through 2025, and they have stepped back,” Glassnode said. “Their average entry, the Corporate Treasury Cost Basis, sits at $80.5K, about 6% above spot, so the group as a whole is under water.”

    Data from Bitcoin Treasuries confirms the scale of institutional exposure: public companies collectively hold roughly 1.22 million BTC across 181 listed firms. Strategy (formerly MicroStrategy) remains the dominant buyer and holder, controlling approximately 845,050 BTC. Tokyo-listed Metaplanet ranks among the next-largest corporate stacks. As a group, these treasuries remain in a loss position at prevailing prices, creating a potential overhang if entities choose to de-risk.

    “A reclaim of $80.5K would put the treasuries back in profit and remove one layer of overhead supply; until then their entry is one more ceiling,” Glassnode added.

    ETF Inflows Rebound Yet Year-to-Date Deficit Persists

    Demand indicators beyond corporate treasuries paint a mixed picture. U.S.-listed spot Bitcoin ETFs have attracted billions of dollars in net inflows since early August, signaling a rebound in institutional appetite. However, data from SoSoValue shows these funds remain roughly $1 billion short of turning positive on a year-to-date basis, underscoring that the recent surge has only partially offset earlier outflows.

    Coinbase Premium Signals Weaker U.S. Spot Demand

    The Coinbase premium indicator, tracked by CoinGlass, has stayed mostly negative since May, with only a brief move into positive territory on September 5. A negative reading means Bitcoin is trading at a discount on Coinbase relative to Binance, suggesting that U.S.-based buyers are exhibiting weaker spot demand compared to traders on offshore venues. This divergence highlights a geographic split in buying pressure that could influence price discovery in the near term.

    Why This Matters

    The confluence of corporate treasuries sitting underwater, ETF flows still negative for the year, and a persistent negative Coinbase premium creates a layered resistance structure for Bitcoin. The $80.5K corporate cost basis acts as both a psychological and fundamental supply zone: if reclaimed, it could trigger profit-taking relief and remove a structural overhang; if rejected, it reinforces a ceiling that may cap near-term upside. Meanwhile, the ETF year-to-date deficit indicates that institutional capital has not yet fully recommitted after earlier drawdowns, and the Coinbase discount suggests U.S. participants remain cautious relative to global peers. Market watchers should monitor whether the August ETF inflow momentum can close the YTD gap and whether the Coinbase premium flips sustainably positive—both would signal broadening, conviction-led demand.

    Frequently Asked Questions

    How many Bitcoin do public companies hold in total?

    According to Bitcoin Treasuries, public companies hold approximately 1.22 million BTC across 181 listed firms.

    What is the Corporate Treasury Cost Basis and why is it important?

    The Corporate Treasury Cost Basis is the average entry price of corporate Bitcoin holdings, currently $80,500. It matters because the group is underwater at current prices; a reclaim would put them in profit and remove a layer of potential selling pressure.

    Are U.S. spot Bitcoin ETFs positive for the year?

    No. Despite billions in inflows since early August, SoSoValue data shows U.S. spot Bitcoin ETFs remain roughly $1 billion negative year-to-date.

  • Crypto Sector Surges 213% Since Bitcoin’s 2025 Peak as One Coin Leads the Rally

    Crypto Sector Surges 213% Since Bitcoin’s 2025 Peak as One Coin Leads the Rally

    Privacy Coins Surge 213% Since Bitcoin’s October 2025 Peak, Led by Zcash Rally

    Privacy-focused cryptocurrencies have climbed 213% since Bitcoin’s October 2025 high, even as BTC remains significantly below that level, according to a market breakdown published today by analyst Wise Crypto. The sector’s combined market capitalization has grown from $7.1 billion a year ago to $33.6 billion currently, though the gains are heavily concentrated in a single asset.

    Zcash Dominates Privacy Sector Growth

    Zcash (ZEC) accounts for roughly 62% of the privacy category’s total market cap on its own, rising 25x over the past year. Its market-cap ranking surged from #82 to as high as #7 at one point, though CoinGecko data currently places it at #9. Glassnode data published last week corroborated the trend, finding that privacy was the only crypto sector trading above its October peak, with every other category still down by double digits.

    Grayscale’s Zcash ETF, trading under the ticker ZCSH, crossed $500 million in assets within two weeks of launch. Monero (XMR), the second-largest privacy asset, has approximately doubled over the same period despite facing delistings from several exchanges. Among the 25 largest crypto assets, Wise Crypto noted that only four — ZEC, HYPE, XMR, and WBT — are still trading above their October levels.

    Investors Highlight Diversification Beyond Major Chains

    Investor Dan Tapiero told The Wolf of All Streets on September 11 that the moves in ZEC and HYPE this cycle demonstrate crypto is no longer just a Bitcoin, Ethereum, and Solana story. “Zcash has been an enormous winner this year,” he said, pointing to broader activity building outside the three largest chains.

    A day later, Egor Sidelska of Infinex argued that privacy is one of the only parts of crypto that hasn’t already been built out and cloned across other chains, calling ZEC “the last 100x in crypto that isn’t a random meme coin.”

    Valuation Debate Continues Amid Rapid Appreciation

    Not all analysts are convinced the rally is fully justified. Analyst filbfilb recently pushed back on how far the Zcash advance can be trusted, sharing valuation models that compared ZEC’s transaction activity against Bitcoin’s at a similar stage of issuance. Those models implied a price around $944 — below current levels — though convergence scenarios place fair value much higher if Zcash continues closing the gap.

    At the time of writing, ZEC was changing hands at approximately $1,140, flat on the day but up 32% over the last two weeks and more than 2,100% over the past year. The token remains well off its 2016 all-time high near $3,190. Meanwhile, Bitcoin traded near $77,000, down just over 1% in 24 hours and about 34% over one year, leaving it roughly 39% below its own October 2025 all-time high.

  • Bitcoin Sell Pressure Hits One-Month Low as Long-Term Holders Reduce Profit-Taking

    Bitcoin Sell Pressure Hits One-Month Low as Long-Term Holders Reduce Profit-Taking

    Bitcoin On-Chain Sell-Side Risk Drops Below Half of August Peak, Glassnode Reports

    Bitcoin’s on-chain sell-side risk has declined to less than half its August high, signaling reduced potential selling pressure even as a significant cluster of older coins remains held above current market prices. Analytics firm Glassnode detailed the shift in a September 9 report covering on-chain data through September 7.

    Sell-Side Risk Ratio Falls to 7 Basis Points

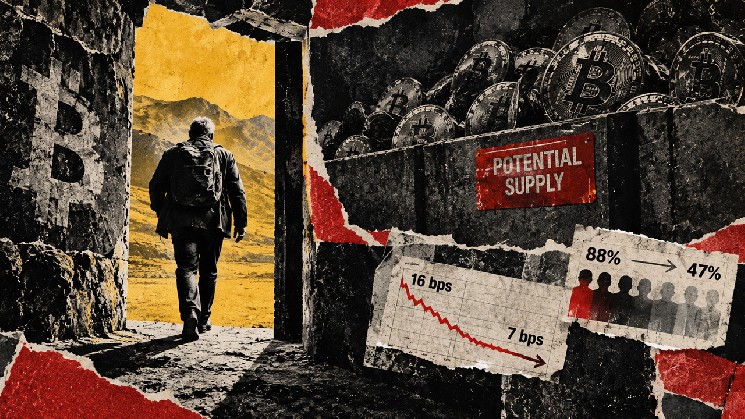
    The firm’s Sell-Side Risk Ratio stood at 7 basis points per day on a seven-day basis, down sharply from 16 basis points at August’s peak. This metric aggregates on-chain profits and losses and divides the total by realized capitalization, measuring value realization relative to that capital base to indicate potential selling pressure.

    Long-term holders accounted for 47% of realized profit during the period, compared with 88% at the August peak. The decline suggests older holders are contributing a smaller share of the market’s realized profit, though the percentage does not measure their share of all Bitcoin sales.

    A ratio below half its earlier level does not mean the volume of Bitcoin sold on exchanges has halved.

    Profit Realization Spikes Moderate

    Glassnode separately reported that the realized-profit spike on September 3 was less than half the size of August’s spike. That comparison tracks profit spikes specifically, distinct from the seven-day risk measure. Together, the findings describe quieter realization activity and a changed mix of holders taking profits.

    Overhead Supply Cluster Holds at $83,000–$86,000

    The report identifies roughly 1.07 million BTC acquired between $83,000 and $86,000, almost all held by long-term holders. That block of coins barely changed over 30 days. The holdings remain potential supply, while the realization data describe what holders have recently been doing.

    Exchange Demand Remains a Separate Test

    Reports noted negative exchange spot flow on September 8. Spot cumulative volume delta (CVD) remained negative despite improving, meaning aggressive exchange selling still outweighed aggressive buying in that measure.

    CVD tracks the balance of executed trading, while sell-side risk tracks on-chain profit-and-loss realization relative to realized capitalization. A lower reading in the latter does not require the former to turn positive.

    Bitcoin holders are realizing less profit and loss relative to the capital base, while the overhead coins remain largely in place. Treating that entire block as immediate selling pressure would overstate the evidence. A sustained advance would still require buyers to absorb the supply that actually comes to market.

    Related Reading: Bitcoin’s next $80,000 breakout has $47 billion more profitable supply to absorb