Tag: Federal Reserve rate hikes

  • Bitcoin Faces 2022 Parallels as Federal Reserve Resumes Rate Hikes

    Bitcoin Faces 2022 Parallels as Federal Reserve Resumes Rate Hikes

    Bitcoin Bear Market Nears One-Year Mark as Fed Rate Hikes and Energy Shock Cloud Outlook

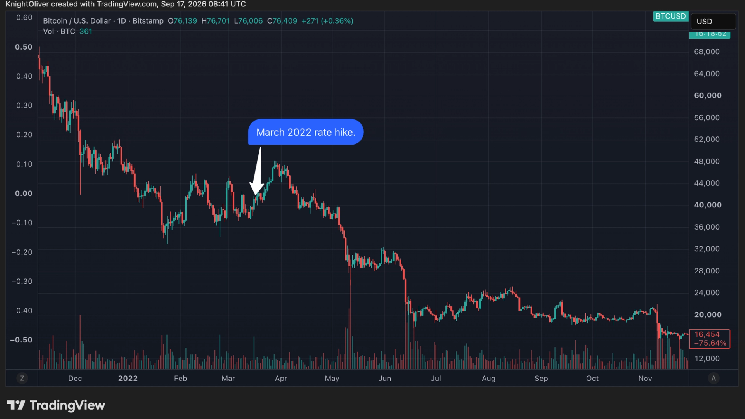
    Bitcoin’s prolonged downturn is approaching the one-year milestone, raising questions about whether a new Federal Reserve rate-hiking cycle could extend the crypto winter. The market’s recent behavior echoes the aftermath of the Fed’s initial March 2022 hike, when bitcoin rallied roughly 18% over 12 days before plummeting around 50%. That pattern suggests any near-term relief rally may give way to further losses, though a single comparable cycle offers limited predictive evidence.

    Inflation Progress Meets Fresh Energy Shock

    The Federal Reserve’s decision to raise rates on Wednesday stemmed from persistent inflation pressures. Annual headline inflation has remained above the 2% target for over five years. However, core inflation — which excludes volatile food and energy components — has eased to 2.4%, its lowest level in five years, signaling meaningful progress.

    That progress now faces a significant headwind. Escalating geopolitical tensions in the Middle East have propelled both West Texas Intermediate and Brent crude oil prices well above $100 per barrel. The surge threatens to reignite inflationary pressures and squeeze economic growth simultaneously.

    Rising Yields Amplify Pressure on Risk Assets

    Global bond yields have climbed in response, with the benchmark U.S. 10-year Treasury yield reaching 5%. The move tightens financial conditions further and adds downward pressure on risk assets, including cryptocurrencies. Bitcoin’s 2022 decline coincided with broad-based losses across equities, bonds, and metals, alongside internal turmoil within the crypto industry — a correlation that underscores its sensitivity to macroeconomic liquidity cycles.

    Key Question for Crypto Markets

    With the bear market nearing its first anniversary, market participants are weighing whether the current tightening cycle — compounded by an energy-driven inflation resurgence — will prolong the downturn or if the asset class has already priced in the worst of the macroeconomic storm.

  • Crypto Falls Amid $386M Liquidation Wave, Rate-Hike Fears

    Crypto Falls Amid $386M Liquidation Wave, Rate-Hike Fears

    Bitcoin Volatility Spikes as Price Drops 2.5% in 14 Hours

    Bitcoin ($BTC) and the broader cryptocurrency market saw heightened volatility on September 9. The flagship asset rallied to an intraday high of $79,760 before reversing sharply, shedding 2.49% over roughly 14 hours to trade near $77,770.

    Liquidations Surge as Long Positions Unwind

    The pullback forced $BTC to retest a local support zone around $77,900. That move triggered the largest single-day liquidation total in nearly a week, with $269.96 million in long positions and $116.62 million in shorts forcibly closed, according to market data.

    Spot Bitcoin ETF Flows Show Demand Slowdown

    Institutional appetite appeared to cool. Over the prior two trading sessions, U.S. spot Bitcoin ETFs recorded a combined net outflow of $166.8 million, based on figures from Farside Investors.

    Long-Term Holders Take Profits

    On-chain analysis indicates that long-term holders have been realizing gains. Selling pressure from this cohort likely contributed to the short-term correction. However, the $76,000 demand zone held firm, preserving the bullish case for a recovery bounce.

    Key Supply Zone Remains Contested

    Between $76,000 and $82,000 lies a critical battleground. Approximately 35% of the total Bitcoin supply was accumulated at or above this range, making it a pivotal area for both bulls and bears in the longer-term outlook.

    Macro Headwinds Intensify

    The cryptocurrency retreat coincided with a broader risk-off shift. Rising oil prices reignited concerns over accelerating inflation, pushing the probability of a U.S. Federal Reserve rate hike to 60.2%.

    Technical Outlook: Bullish Structure Intact but Tested

    4-Hour Chart Holds Key Demand

    On the 4-hour timeframe, Bitcoin maintains a bullish market structure. Last week’s surge to $82,300 confirmed trend continuation. Despite the deep retracement, price remains above the $77,000 demand zone (marked in cyan on TradingView charts).

    A decisive break below $76,264 would be required to invalidate the bullish 4-hour structure and flip the bias bearish.

    Liquidation Heatmap Highlights Magnetic Levels

    CoinGlass’s 1-week liquidation heatmap identifies the nearest high-density liquidity cluster at $77,400. Volatility could pull price toward this level before a potential move higher.

    To the upside, notable magnetic zones sit at $79,700, $80,500, and $82,000 — levels traders should monitor for resistance or breakout confirmation.

    Summary

    • Negative spot ETF flows and long-term holder profit-taking drove the 24-hour retracement.
    • Over $200 million in long liquidations amplified the downside move.
    • Macro pressure persists: higher oil prices fuel inflation fears, with Fed rate-hike odds at 60.2%.
    • Short-term bias remains bullish provided the $76,000–$77,000 zone holds.