Tag: Federal Reserve interest rates

  • Solana Price Risks Falling Below $100 as Bearish Momentum Intensifies

    Solana Price Risks Falling Below $100 as Bearish Momentum Intensifies

    Solana Price Dips Below $102 as Macro Risks Trigger Broad Crypto Sell-Off

    Solana (SOL) declined 3.5% over the past 24 hours to trade near $101 on September 10, putting the critical $100 support level under threat as selling pressure intensifies across digital asset markets. According to CoinGecko data at the time of writing, SOL was priced at $100.96 after retreating from the $104–$105 range and touching an intraday low of roughly $100.60.

    Despite the near-term pullback, the token remains up 1.1% over the past seven days and has surged 34.5% over the last 30 days, climbing from the mid-$70s in August to briefly test the $110 level.

    Macroeconomic Headwinds Drive Risk-Off Sentiment

    The decline coincides with a broad risk-off move across global markets. Brent crude oil prices surged above $100 per barrel as the U.S.–Iran conflict escalated and attacks on shipping lanes disrupted energy flows through the Middle East. Higher energy costs have reignited concerns over U.S. inflation just ahead of key consumer price data and next week’s Federal Reserve policy decision.

    Asian equities fell in tandem with cryptocurrencies as investors reduced exposure to risk assets. Additional pressure stemmed from the bond market, where the U.S. 10-year Treasury yield climbed to approximately 4.85%—its highest level since late 2023—after the Treasury announced a $6 billion long-dated bond buyback that was smaller than market participants had anticipated. Rising yields increase the opportunity cost of holding non-yielding assets like crypto at a time when markets are reassessing the trajectory of U.S. interest rates.

    Traders are currently pricing in roughly a 60% probability of another Federal Reserve rate hike following strong labor market data. The macro-driven selloff swept across the crypto complex: Bitcoin hovered near $79,000, while roughly $246 million in leveraged positions were liquidated over the past 24 hours as volatility spiked.

    No Solana-Specific Catalyst Behind the Drop

    Coinbase market data linked SOL‘s decline to broad inflation concerns and weakness across smart contract platform tokens, supporting the view that the sell-off is not driven by a new Solana-specific event. Profit-taking likely amplified the move once SOL slipped from the $105 area.

    Solana (SOL) Technical Price Analysis

    Daily Chart: Momentum Fades, $100 Support in Focus

    On the daily timeframe, SOL/USDT was trading near $101.19 after printing an intraday low of $100.50.

    SOL/USDT 1-day price chart. Source: TradingView.
    • Price has fallen below the 9-day simple moving average (SMA) at $102.88, leaving the short-term average above the market after supporting much of the August advance.
    • The daily Commodity Channel Index (CCI) has dropped to -10.02 from over 300 during the August breakout. Its moving average remains elevated at 64.77.
    • The CCI’s fall back through zero indicates the strong positive momentum behind the rally toward $110 has dissipated, though the indicator has not reached the -100 level typically associated with oversold conditions.

    $100 now acts as immediate support after SOL repeatedly held the $100–$101 zone during the recent decline. A daily close below this level could bring $95 into focus, with the $90–$92.50 area forming the next major support zone stemming from the August breakout.

    For a recovery to gain traction, SOL must first reclaim the 9-day SMA at $102.88. The next resistance cluster sits around $105–$107, where several recent upside attempts have stalled. A decisive break above that zone could put the August high near $110 back in play.

    4-Hour Chart: Bearish Structure Intensifies

    The 4-hour timeframe shows a similar deterioration in momentum.

    SOL/USDT 4-hour price chart. Source: TradingView.
    • SOL has declined from the $106–$107 region since September 7 and was last trading at $101.18, with the latest candle reaching a low of $100.83.
    • On-balance volume (OBV) has fallen to -44.94 million from roughly -41 million during the prior rebound, confirming that the move toward $100 has been accompanied by declining cumulative volume pressure.
    • The 4-hour MACD line has dropped to -0.46, below the signal line at -0.33, with the histogram at -0.13. Both lines have moved below zero as SOL approaches $100, signaling short-term momentum favors sellers.

    A break below $100 would expose the recent 4-hour support around $97.50–$98. SOL traded in that area during the early-September pullback before recovering toward $106. If $97.50 fails, the next visible support sits around $95.

    For the bearish structure to weaken, SOL would need to recover to $102.50–$103 and push the MACD back toward its zero line. A move through $105 would then open the door to the $107 area, while the late-August peak near $110 remains the next major upside target.


  • Bitcoin Price Could Drop to $70K if $78K Neckline Breaks

    Bitcoin Price Could Drop to $70K if $78K Neckline Breaks

    Bitcoin Holds Near $78,500 as Technical Pressure and Macro Risks Mount

    Bitcoin (BTC) traded near $78,500 on September 9 after retreating from a September 3 peak of $82,283, a decline of roughly 4.6%. The pullback has extended a series of lower highs on the 4-hour chart, with buyers repeatedly defending the $78,000 area but failing to reclaim the psychological $80,000 level.

    4-Hour Technicals Show Fading Momentum

    On the 4-hour timeframe, Bitcoin sat at approximately $78,522, below the middle Bollinger Band at $79,079 and only slightly above the lower band at $78,015. Proximity to the lower band often signals increasing selling pressure, though the nearby support could also trigger a short-term bounce. A recovery above the middle band would be needed to weaken the immediate bearish setup.

    The upper Bollinger Band sits near $80,144, making the $80,000–$80,150 region the first major resistance zone. A daily close above that area would give bulls another chance to challenge recent highs around $81,500 and $82,300.

    The 4-hour Relative Strength Index (RSI) read 43.58, below both the neutral 50 mark and its signal average of 44.71, indicating bearish momentum without reaching oversold territory.

    Macro Headwinds: Oil, Yields, and Fed Policy

    Bitcoin’s decline coincided with a broader risk-off move driven by escalating Middle East tensions. Brent crude climbed to $99.22 per barrel on September 9, while West Texas Intermediate rose to $94.13, reviving fears that higher energy costs could keep inflation elevated.

    Rising inflation expectations affect Federal Reserve interest-rate projections. Higher rates and bond yields boost returns on lower-risk assets, creating competition for non-yielding assets like Bitcoin.

    U.S. Treasury yields added pressure. The benchmark 10-year yield surged above 4.85% after the Treasury announced a $6 billion buyback of older bonds (10- to 20-year maturities). The 30-year yield hit its highest level since 2007. Rising yields tighten financial conditions by increasing borrowing costs and reducing appetite for volatile assets.

    Traders are now focused on incoming inflation data and oil prices ahead of the Federal Reserve’s September 15–16 policy meeting for clues on whether the central bank will maintain a restrictive stance.

    Daily Structure Still Intact, but Head-and-Shoulders Looms

    Daily indicators remain less bearish. Bitcoin continues to trade above the daily Supertrend support at $72,786, meaning the broader recovery structure has not been invalidated despite the recent drop.

    The daily Aroon lines are closely matched at 57.14% and 50%, showing neither buyers nor sellers have established firm control on the higher timeframe.

    Crypto analyst Gerla identified a potential head-and-shoulders pattern, with the left shoulder near late-August highs, the head at the September 3 peak, and the right shoulder possibly forming during the latest rebound.

    “$78K–$79K is the line in the sand. Lose that and $70K could come pretty quick,” Gerla said in a Sept. 9 post on X.

    The pattern remains unconfirmed while Bitcoin holds its neckline. A decisive daily close below $78,000 would strengthen the bearish setup and expose the $76,000–$77,000 zone before the larger downside target near $70,000.

    Liquidation Heatmap Highlights Key Liquidity Zones

    CoinGlass’s three-day liquidation heatmap shows heavy leveraged-position clusters above current levels. The strongest nearby liquidity sits between roughly $79,700 and $80,200, with additional concentrations extending toward $82,000. These levels can act as magnets during high-leverage periods, though they do not guarantee price will reach them. A recovery through $79,100 could trigger short liquidations and fuel a test of the $80,000 cluster.

    Downside liquidity is concentrated near $78,000 and between approximately $77,500 and $77,800. A break below current support could accelerate volatility as leveraged longs are closed. Further liquidity appears around $76,000, aligning with the next technical support area beneath the proposed neckline.

    Key Levels to Watch

    • Immediate range: Lower Bollinger Band (~$78,015) to middle band (~$79,079). Holding $78,000 keeps a relief move toward $79,700–$80,150 in play.
    • Bullish trigger: Sustained break above $80,150 weakens the short-term bearish structure and puts $81,500 and $82,283 back in focus. Clearing the September peak would confirm a renewed uptrend.
    • Bearish confirmation: Daily close below $78,000 shifts focus to $77,500, then the wider $76,000–$77,000 support zone. The head-and-shoulders interpretation gains credibility below the neckline, though the daily Supertrend near $72,786 remains a critical barrier before the $70,000 scenario can develop.
  • Bitcoin (BTC) at a Critical Junction After Rally: Analysts Say Further Gains Depend on Two Events

    Bitcoin (BTC) at a Critical Junction After Rally: Analysts Say Further Gains Depend on Two Events

    Bitcoin surged 24% in August, marking its strongest monthly gain since November 2024. After the sharp rally, the cryptocurrency stabilized near $78,000 as high oil prices and rising U.S. Treasury yields limited further upside.

    At the same time, expectations for a September interest rate hike increased significantly following Federal Reserve Chairman Kevin Warsh’s speech in Jackson Hole. Despite the more hawkish outlook from the Fed, analysts say Bitcoin continues to hold key support levels.

    Bitcoin Holds Critical Support at $77,100

    According to Bitfinex analysts, Bitcoin is holding its critical support level at $77,100 despite signals that the Federal Reserve may pursue a more hawkish monetary policy.

    Bitfinex’s latest Alpha report said Bitcoin experienced a sharp pullback last week after climbing to $81,500 following Kevin Warsh’s remarks at Jackson Hole. However, Bitcoin’s ability to remain above $77,100 suggests that the broader uptrend has not yet been broken.

    Spot Bitcoin Buying Supports the Rally

    Bitfinex analysts said Bitcoin’s August surge was not driven solely by leveraged trading. Actual purchases in the spot market also contributed to the cryptocurrency’s rise.

    U.S. spot Bitcoin ETFs recorded total net inflows of $924.5 million during the week of August 24-28. Bitfinex said liquidity concentrated in ETFs and stablecoins is supporting the Bitcoin and broader crypto market uptrend, although high inflation and expectations of future interest rate hikes could restrict additional gains.

    U.S. employment data due on September 4 and inflation data scheduled for September 11 are expected to be important for market expectations surrounding the Federal Reserve’s September interest rate decision.

    Can Bitcoin Hold Above $80,000?

    Bitcoin fell below $80,000 after Kevin Warsh’s hawkish speech at Jackson Hole but has continued to hold the $77,100 support level.

    Questions remain over whether Bitcoin can sustain a move above $80,000. Bitfinex points to strong spot Bitcoin demand and approximately $925 million in net inflows into spot Bitcoin ETFs as factors supporting the market. However, some analysts remain cautious about the durability of the rally.

    Greeks.live analyst Adam said ETFs had recorded large inflows, but the strong inflow streak ended with a $202 million outflow on August 28. The analyst warned that continued ETF outflows, and the possibility that they could become permanent, may make it more difficult for Bitcoin to remain above $80,000.

    The analyst also discussed Strategy’s decision to resume Bitcoin purchases after a long pause. According to the analyst, Strategy’s purchases could support the price in the short term but may not be sufficient on their own to alter the long-term trend.

    Macroeconomic Risks Remain

    The analyst said the Federal Reserve’s hawkish stance and broader macroeconomic uncertainty remain among the main risks facing Bitcoin, echoing concerns raised by Bitfinex.

    These factors are putting additional pressure on investor confidence and the Bitcoin price. The analyst believes it is too early to describe the market as a new strong bull trend without a sustained move above $80,000. ETF flows and Federal Reserve policy are likely to play a decisive role in determining Bitcoin’s short-term direction.

    This is not investment advice.

  • Bitcoin Price Correction: Why BTC Stalled at $78,000 Again

    Bitcoin Price Correction: Why BTC Stalled at $78,000 Again

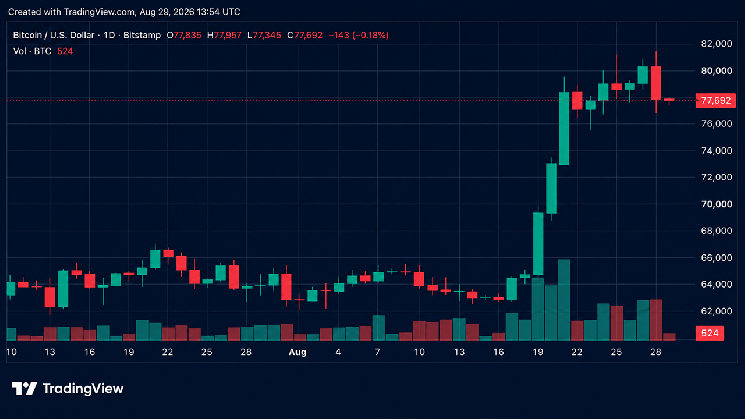
    Bitcoin rose 26% in less than two weeks to reach $81,455 before stopping at the same price level that ended its previous rally. As of Sunday, 30 August at 11:37 UTC, BTC/USD traded at $78,019 on Bitstamp, down 0.12% on the day.

    Why Did Bitcoin Correct After Reaching $81,000?

    The catalyst was macroeconomic rather than crypto-specific.

    On Friday, 28 August, new Federal Reserve Chair Kevin Warsh delivered his first Jackson Hole keynote. He highlighted PCE inflation running at 3.7% year over year and 4.1% annualised over the previous six months, signalling that the Fed still has more work to do.

    Markets repriced rapidly. September rate-hike odds on CME FedWatch rose to roughly 56% from 35% a day earlier, reaching 60% intraday. Gold fell 2.4%, US equities surrendered their early gains, and Bitcoin dropped from $81,455 to a low of $76,845 before closing near $77,800.

    Forced liquidations intensified the decline. CoinGlass recorded approximately $486 million in liquidations across about 95,731 traders, including $368 million in long positions. Altcoins performed worse, with Ethereum closing at $2,443, down 2.70%; Solana at $104.13, down 4.65%; and XRP at $1.3833, down 4.80%.

    What Do Bitcoin ETF Flows Say About Institutional Demand?

    US spot Bitcoin ETFs recorded $201.81 million in net outflows on 28 August, ending a nine-day inflow streak that had brought nearly $3 billion into the funds since 17 August.

    ARK 21Shares ARKB accounted for $114.9 million of the outflows, followed by Bitwise BITB at $49.7 million and BlackRock IBIT at $33.4 million. Morgan Stanley’s MSBT was among the few funds to attract new money, recording $9.3 million in inflows.

    The distribution of outflows is significant. IBIT’s relatively small share of the redemptions points to profit-taking after a rapid rally rather than a broad institutional exit. August month-to-date inflows remain above $3.1 billion, making it the strongest month of 2026. The funds collectively hold more than one million bitcoin, and the reversal came one day after their combined net assets crossed $100 billion.

    Ether ETFs moved in the opposite direction, adding $102 million on the same day and recording a tenth consecutive session of inflows.

    ETF creations require fund managers to buy spot Bitcoin, while redemptions require them to sell. If outflows continue this week, the market could lose the buying support that helped hold the $80,000 level.

    What Does the Bitcoin Chart Show?

    Bitcoin bottomed near $62,277 in mid-August before moving almost vertically higher. It cleared the 200-day exponential moving average at $72,170 within days and then ran into resistance at $78,670. The price is now sitting near that level without managing to close above it.

    The difficulty is that $78,670 also capped Bitcoin’s early-May rally. At that time, BTC consolidated just below the level for two weeks, failed to break through and fell to the low $60,000s by June.

    The current setup closely resembles that earlier structure, although there is one important difference. In May, the 200-day EMA was above the market and declining. It is now below the price at $72,170 and has begun to flatten.

    Momentum is also cooling. The daily RSI is 71.03, placing it in overbought territory, and it has already fallen below its own moving average at 74.90.

    The sharp advance also created a volume vacuum between approximately $68,000 and $76,000. Such thinly traded areas can accelerate moves in either direction.

    Bitcoin Price Targets if BTC Breaks Higher

    The next bullish move depends on a daily close above $78,670 supported by strong volume.

    $81,455: This is the first target, based on the 28 August high and the 50-week moving average near $81,000. That moving average has separated bull and bear phases through much of Bitcoin’s history and remains one of the most important levels in the current cycle. A sustained breakout above $82,000 would require genuine spot demand rather than short covering.

    $88,000: This is the next major target and the first clear structural resistance above $81,455.

    $100,000: This remains the stretch case. Standard Chartered’s Geoff Kendrick has indicated that his year-end forecast may now be too low, although reaching $100,000 would likely require the Federal Reserve narrative to turn more dovish after a soft inflation reading before 16 September.

    Bitcoin Downside Price Targets

    A second rejection at $78,670 would leave several clearly defined support levels below.

    $74,450: This is the first support and the most likely destination for a normal pullback. Holding this level would keep the broader uptrend intact.

    $72,170: The 200-day EMA is the key technical line. A loss of this level would suggest that the August advance was a bear-market rally.

    $66,803 to $65,000: This support shelf formed through July and early August. A decline into this zone would erase most of the recent advance but leave the broader structure repairable.

    $62,277: This is the origin of the rally. A complete round trip back to this level would represent a textbook failed breakout.

    $58,000: This is the bear-case target. Glassnode has warned that sellers appear exhausted while buyers remain absent, and that a break below $58,500 could open the way to a deeper decline. Michael Terpin has identified an October bottom near $57,000. That scenario would require a September rate hike to materialise.

    For context, Bitcoin has already fallen approximately 54% from its high in the current cycle, although that decline remains shallower than the drawdowns recorded in 2018 and 2022.

    Which Bitcoin News Could Move BTC Next?

    The CLARITY Act remains stalled in the Senate, while bank lobbying pushed Circle and Coinbase shares lower on 28 August. A proposed SEC crypto custody rule, RIN 3235-AN46, entered White House review on 25 August.

    XRP ETFs advanced through two new US filings, and Grayscale launched the first spot Zcash ETP under the ticker ZCSH on NYSE Arca.

    Market sentiment is another risk. The Crypto Fear and Greed Index reached 72 on 28 August, compared with a 30-day average of 42. When positioning becomes crowded so quickly, relatively small catalysts can trigger outsized selling. Friday’s move demonstrated that risk.

    Bitcoin Price Prediction: What Should Traders Watch?

    Bitcoin is at a decision point rather than in a confirmed trend.

    The bullish scenario requires a daily close above $78,670, a return to net ETF inflows this week and support from the $76,700 to $77,300 area during any retest. If all three conditions are met, Bitcoin could break through $81,000 and open the path toward $88,000.

    The bearish scenario requires a second rejection at the current resistance level followed by a break below $72,170. Given the limited trading volume between current prices and the lower support zones, such a move could reopen $65,000 quickly.

    The base case is range-bound trading. Bitcoin is overbought into resistance, while the underlying structure remains strong but is losing momentum. The Federal Reserve outlook is also uncertain with three weeks remaining before the key September decision.

    A range between $74,450 and $78,670 while the RSI cools would be the healthiest outcome for the bulls, and it is the scenario the chart currently supports. Traders should watch ETF flow data from Monday through Wednesday for the next major signal.

    Source: cryptonews.net

  • Is Bitcoin’s Recent Rally a Bubble or Sustainable?

    Is Bitcoin’s Recent Rally a Bubble or Sustainable?

    Bitcoin’s recent rally from approximately $63,500 to more than $80,000 appears to have been driven by strong spot demand rather than leveraged trading, according to an assessment from QCP Capital.

    Bitcoin rally shows healthier market structure

    QCP Capital reported that roughly $2.8 billion flowed into spot Bitcoin ETFs during Bitcoin’s rise from $63,500. At the same time, open interest in Bitcoin futures declined from about 646,000 BTC in mid-August to 588,000 BTC.

    Relatively low funding rates also suggest that the price increase was not fueled by aggressive leveraged long positions. QCP said spot purchases and the closing of short positions were particularly prominent during the rally.

    The limited accumulation of excessive leverage could point to a more sustainable market structure for Bitcoin than in previous speculative rallies.

    Federal Reserve and US Treasury remain in focus

    Despite Bitcoin’s positive technical structure, the broader macroeconomic outlook remains uncertain. Core PCE inflation held at 3.3% year over year in July, while markets are pricing in a 35% probability that the Federal Reserve will raise interest rates by 25 basis points at its September meeting.

    Meanwhile, the expansion of the US Treasury’s repurchase program for long-term bonds is supporting risk assets. Beginning September 9, the Treasury will raise the upper limit for each repurchase operation involving 10- to 30-year bonds from $2 billion to at least $4 billion.

    After the announcement, long-term bond yields declined and the dollar index weakened, while gold and Bitcoin prices moved higher.

    QCP also said Nvidia’s strong balance sheet had contributed to risk appetite across global markets.

    However, the US Treasury’s bond repurchase program is not quantitative easing. The initiative is designed to improve liquidity in the long-term bond market rather than directly determine bond yields, and it does not create a QE-like expansion in central bank reserves.

    According to QCP’s assessment, the key short-term question for Bitcoin is whether strong spot demand will continue.

    This is not investment advice.

  • Bitcoin Price Falls After Warsh’s Hawkish Jackson Hole Keynote

    Bitcoin Price Falls After Warsh’s Hawkish Jackson Hole Keynote

    Bitcoin has pulled back from its weekly high of $81,455, but its August gains remain substantial. As of Aug. 29, 2026, at 8:30 a.m., bitcoin was trading at approximately $77,588 to $77,984 per coin. The leading cryptocurrency had declined about 2% to 2.5% over the previous 24 hours, while still gaining 23.2% against the U.S. dollar since Aug. 15.

    Bitcoin’s initial rally followed the Treasury’s mid-August announcement about expanding bond buybacks. During the same week, U.S. President Donald Trump met with several cryptocurrency industry executives and made positive comments about the sector. He discussed bringing Hyperliquid to the United States and remained open to acquiring substantial amounts of $BTC after receiving advice from members of his administration.

    Those developments helped drive demand for spot bitcoin exchange-traded funds (ETFs), which recorded nine consecutive days of inflows. The streak ended Friday, when spot bitcoin ETFs posted their first day of outflows, with approximately $202 million leaving the funds.

    Sticky Inflation Meets Positive Crypto News

    Several developments put pressure on bitcoin toward the end of the week. U.S. inflation remained persistent, with the personal consumption expenditures (PCE) price index rising in July. Bitcoin initially absorbed the news and recovered from a modest decline before reaching its weekly high of $81,455.

    Additional positive developments supported the market, including a proposed draft to rewrite U.S. Securities and Exchange Commission (SEC) custody rules and Charles Schwab’s expansion of its digital asset offerings.

    Hawkish Jackson Hole Speech Pressures Bitcoin

    Market sentiment shifted during the Jackson Hole Economic Policy Symposium, where Federal Reserve Chair Kevin Warsh delivered his first speech at the annual event. Speaking at 10 a.m. EDT on Friday, Warsh addressed the symposium’s theme, “Financial Innovation: Implications for Payments and Policy.”

    The keynote was viewed as hawkish. Warsh said the U.S. central bank has “work to do” and argued that specific financial conditions remain difficult. He also said forward guidance had “overstayed its welcome.”

    Following the speech, the probability of a rate hike rose immediately from 35% to the mid-50% range. Treasury yields increased, while precious metals such as gold posted modest declines.

    Before Warsh’s keynote, bitcoin was trading sideways near $79,500. After the speech, its price briefly fell below $77,000 before buyers absorbed the intraday selling pressure. The move also coincided with the first day spot bitcoin ETFs recorded outflows after their extended inflow streak.

    Despite the break in consecutive inflow days, August remains a strong month for spot bitcoin ETF demand, with approximately $3.1 billion to $3.3 billion entering the funds.

    Bitcoin Tests $77,000 Support as Technical Indicators Signal Overheating

    Bitcoin’s immediate resistance this weekend is positioned between $79,500 and $80,300, a range the cryptocurrency lost following the Federal Reserve chair’s speech. Resistance becomes stronger at higher price levels.

    Support is currently holding near the $76,800 to $77,000 zone. Bitcoin’s 24-hour trading volume was approximately $28.731 billion. Technical indicators suggest momentum had already become stretched before the keynote. The daily relative strength index (RSI) was at 70, while the Stochastic indicator was higher at 85, indicating overbought conditions.

    Although the RSI is neutral and the Stochastic indicator points to overheating, the moving average convergence divergence (MACD) remains positive. Taken together, the oscillators and moving averages suggest bullish momentum is still intact despite bitcoin’s latest decline—at least for now.

  • Will the Fed Raise Interest Rates in September? Latest Probability Figures Revealed

    Will the Fed Raise Interest Rates in September? Latest Probability Figures Revealed

    Expectations that the Federal Reserve could raise interest rates at its September meeting have increased sharply after cautious comments on inflation from Fed Chairman Kevin Warsh. The probability of a rate hike in forecasting markets has reached one of its highest levels in recent months, while U.S. Treasury yields have also risen significantly.

    Rate hike expectations shift ahead of September Fed meeting

    Market expectations are changing rapidly ahead of the Federal Reserve’s monetary policy meeting on September 16. Data from forecasting markets indicate that the probability of the Fed keeping interest rates unchanged is about 55%, while a 25-basis-point rate hike is priced at approximately 46%. The probability of a larger increase is estimated at only about 1%.

    CME Group’s FedWatch tool shows that investors have raised the probability of a rate hike at the September meeting to 55.7%, an increase of approximately 20 basis points in a single day.

    Warsh says inflation trend has not improved significantly

    Speaking at the Jackson Hole symposium in Wyoming, Federal Reserve Chairman Kevin Warsh said inflation remains elevated.

    Warsh acknowledged that inflation data released during the summer was more positive than expected but said it did not demonstrate a lasting improvement in underlying inflation trends.

    Warsh stated, “While inflation data released this summer was better than expected, it doesn’t indicate a significant improvement in underlying trends.”

    The Fed chairman added that policymakers must ensure inflation is moving clearly and quickly enough toward the level targeted by the central bank.

    Warsh indicated that the Fed could otherwise need to tighten monetary policy further, saying, “Otherwise, we have more work to do. This is our duty, our authority, and our responsibility.”

    However, Warsh did not provide direct guidance on how the Fed will act at upcoming meetings or offer a definitive framework for the economic data that will determine future interest rate decisions.

    U.S. Treasury yields rise after Warsh’s remarks

    Following Warsh’s speech, U.S. stock indexes rose, while selling pressure emerged in the bond market.

    The yield on the 2-year U.S. Treasury note, which is highly sensitive to expectations for Federal Reserve interest rate policy, climbed approximately 8 basis points to 4.31%. That was the highest level for the 2-year yield since the end of July.

    The increase in short-term Treasury yields suggests that investors increasingly expect the Fed to pursue tighter monetary policy in the coming period.

    With approximately two and a half weeks remaining before the September meeting, upcoming inflation and employment data are expected to be critical in determining the direction of interest rate expectations. If inflation remains stronger than expected, the likelihood of a rate hike will increase. A significant slowdown in price pressures, however, could reinforce expectations that the Fed will leave interest rates unchanged.

    This is not investment advice.

  • Why Bitcoin Crashed After Warsh’s Jackson Hole Speech—and What Happens Next

    Why Bitcoin Crashed After Warsh’s Jackson Hole Speech—and What Happens Next

    Bitcoin’s recovery from below $65,000 to above $81,000 has encountered its first major macroeconomic setback after Federal Reserve Chair Kevin Warsh delivered a hawkish message at Jackson Hole on Friday. The key question now is whether the prospect of higher interest rates and rising U.S. Treasury yields could undermine the cryptocurrency market’s sharp rebound.

    Bitcoin ($BTC) held relatively steady during Warsh’s speech, but fell by $3,000 within hours of its conclusion, dropping below $77,000 for the first time in nearly a week. The sell-off spread across financial markets, weighing on stocks, precious metals and other risk-sensitive assets.

    Why Warsh’s Jackson Hole Speech Hurt Bitcoin

    Warsh did not explicitly say that the Federal Reserve is seriously considering raising interest rates, but his message was clear. Inflation remains elevated, the U.S. economy remains strong, and the central bank cannot simply declare victory. The Fed’s preferred personal consumption expenditures (PCE) inflation gauge is currently at 3.7% year over year, while its six-month annualized rate is even higher at 4.1%. Both measures remain well above the Fed’s target.

    Warsh emphasized that the Fed’s 2% inflation objective is “firm and fixed” and argued that price stability will not restore itself without further action from the central bank.

    He also played down some of the summer’s more encouraging inflation data, including the June figures, saying they had not convinced him or his colleagues that the underlying trend had improved substantially. Until the Fed can reassure markets that inflation is moving toward 2% “clearly and at sufficient speed,” policymakers will continue to “have work to do,” he added.

    Rate-Hike Expectations Rise as Bitcoin Falls

    Before Warsh’s speech, traders had assigned a one-third chance to an interest-rate increase in September. Those odds moved toward 60% after the speech, based on market pricing cited by Reuters. U.S. Treasury yields climbed again, while the dollar strengthened sharply after weakening the previous week.

    That is almost the opposite of the macroeconomic backdrop that helped Bitcoin surge 10 days earlier. The shift may explain why BTC fell from a recent peak above $80,000 to below $77,000 within hours, pulling most altcoins lower as well.

    Warsh also highlighted business investment growth of roughly 9% annually and a 20% rise in the S&P 500. Unemployment remained around 4%, while credit conditions were relatively easy. In practical terms, the economy is not currently giving the central bank an obvious reason to accept inflation above its target.

    Higher expected policy rates generally push Treasury yields higher, increasing the returns investors can earn from assets viewed as considerably safer. A more hawkish Federal Reserve also tends to support the U.S. dollar and tighten broader financial conditions. Historically, that combination has been unfavorable for Bitcoin and more speculative altcoins.

    Treasury Support Conflicts With the Fed’s Inflation Fight

    Treasury Secretary Scott Bessent’s recent intervention in the bond market helped drive long-term yields lower, at least temporarily, and contributed to Bitcoin’s major rally. However, Warsh reminded investors that the Federal Reserve has a different mandate.

    The Treasury may want to reduce borrowing costs and improve market liquidity, but the central bank must continue addressing inflation that remains above its target.

    As a result, markets remain caught between two powerful forces: Treasury efforts to support financial conditions and a Federal Reserve that may need to keep monetary policy tighter for longer than investors had expected.

    Source: cryptonews.net