Tag: Ethereum ETFs

  • Crypto Bull Market Returns? Three Signals Indicate a Possible Comeback

    Crypto Bull Market Returns? Three Signals Indicate a Possible Comeback

    Key Highlights

    • Total cryptocurrency market capitalization surged nearly $1 trillion in six weeks, climbing from $2.06 trillion to over $2.91 trillion as Bitcoin led a broad-based recovery.
    • Spot Bitcoin ETFs recorded $999 million in net inflows—the largest single-day haul since October 2023—while combined Bitcoin and Ethereum ETF inflows reached $1.27 billion.
    • Bitcoin reclaimed all major long-term moving averages after 300 days below them, trading above both the True Market Mean ($76,746) and short-term holder cost basis ($71,763), signaling potential bull-market onset.

    Market Sentiment Shifts From Fear to Greed as Bitcoin Breaks $85,000

    The cryptocurrency market has entered a pronounced bullish phase since early August, with Bitcoin spearheading a recovery that has erased much of the bear-market damage accumulated since October 2023. In just six weeks, the aggregate crypto market capitalization has swollen from $2.06 trillion to more than $2.91 trillion, according to CoinGecko data, adding nearly $1 trillion in fresh value. The Fear & Greed Index—a widely watched sentiment gauge—has surged to 59, squarely in “greed” territory, up sharply from a “fear” reading of 45 only a week earlier. The inflection point coincided with Bitcoin’s decisive push above the $85,000 psychological threshold, a level that had acted as stiff resistance during the prolonged consolidation.

    Record ETF Inflows Signal Deepening Institutional Conviction

    Underpinning the price action is a torrent of institutional capital flowing into U.S.-listed spot exchange-traded funds. On the most recent trading day, Spot Bitcoin ETFs collectively attracted $999 million in net inflows, marking the largest single-session intake since the products drew $1.21 billion on October 6, 2023, per SoSoValue figures. BlackRock’s iShares Bitcoin Trust led the charge with $381.37 million, followed by the Ark 21Shares Bitcoin ETF at $289.12 million and Fidelity’s Wise Origin Bitcoin Fund at $238.84 million. The momentum was not confined to Bitcoin: Ethereum ETFs simultaneously pulled in $269.98 million, lifting the combined daily net inflow across both asset classes to $1.27 billion. Analysts note that the breadth of participation—spanning both the flagship cryptocurrency and its largest smart-contract rival—suggests the rally is evolving into a genuine altcoin expansion rather than a Bitcoin-only phenomenon.

    On-Chain and Technical Metrics Align With Bull-Market Thesis

    Beyond fund flows, on-chain and technical indicators are flashing constructive signals. Glassnode data shows Bitcoin has now recaptured all of its long-term moving averages after spending roughly 300 days trading beneath them—a duration that historically precedes sustained up-trends. The asset’s spot price sits comfortably above two critical cost-basis benchmarks: the True Market Mean at $76,746 and the short-term holder realized price at $71,763. Holding above these levels implies that the majority of recent acquirers are in profit, a condition that typically reinforces holder conviction and reduces sell-side pressure. Meanwhile, the rally’s breadth has flipped the Bitcoin-cycle signal in favor of altcoins, indicating capital is rotating beyond the dominant store-of-value narrative into the broader ecosystem.

    Why This Matters

    The confluence of improving sentiment, record-breaking ETF flows, and technical breakouts arrives at a pivotal juncture for digital assets. After a grueling 18-month bear market that tested institutional commitment, the simultaneous breach of $85,000 Bitcoin, the reclamation of long-term moving averages, and the rotation into altcoins mirrors the early innings of previous bull cycles in 2017 and 2020-21. However, market veterans caution that the Fear & Greed Index’s rapid ascent toward “extreme greed” (above 70) often coincides with short-term tops or sharp pullbacks. The next few sessions will test whether the current inflow momentum can absorb profit-taking from early-cycle participants without triggering a deeper correction. Regulatory clarity around stablecoins and market structure legislation in the U.S. Congress, coupled with the Federal Reserve’s evolving rate-cut trajectory, remain the key macro variables that could either extend or truncate the advance.

    Frequently Asked Questions

    What triggered the latest surge in crypto market capitalization?
    A combination of Bitcoin breaking above $85,000, record single-day inflows into Spot Bitcoin ETFs ($999M), and concurrent Ethereum ETF inflows ($269.98M) drove the total market cap from $2.06T to over $2.91T in six weeks.
    Which ETF issuers led the Bitcoin inflows?
    BlackRock’s iShares Bitcoin Trust ($381.37M), Ark 21Shares Bitcoin ETF ($289.12M), and Fidelity’s Wise Origin Bitcoin Fund ($238.84M) were the top three recipients of the $999M net inflow.
    Are technical indicators confirming a new bull market?
    Yes. Bitcoin has reclaimed all long-term moving averages after 300 days below them and trades above both the True Market Mean ($76,746) and short-term holder cost basis ($71,763)—conditions historically associated with bull-market starts. However, the Fear & Greed Index at 59 nearing “extreme greed” warrants caution for near-term volatility.

  • Bitcoin Holds Firm as Ethereum Attracts Inflows: Crypto Positioning Analysis

    Bitcoin Holds Firm as Ethereum Attracts Inflows: Crypto Positioning Analysis

    Bitcoin briefly dipped to $76,700 following the release of fresh inflation data before recovering toward the $78,000 level. According to QCP Capital, this “contained” reaction signals that markets have largely priced in the prospect of a 25-basis-point rate hike.

    Technical Setup Remains Constructive

    The firm explained that $BTC‘s technical setup remains constructive at current levels, although conviction is still dependent on the broader market response to this week’s events.

    Two Very Different Bets: Bitcoin vs. Ethereum Flows

    Bitcoin is trading above a major support zone between $75,000 and $76,000, while resistance sits at $80,000 to $82,000. Ethereum, however, is showing a significantly different flow picture.

    Spot Bitcoin ETFs See Outflows Slow

    Spot $BTC ETFs recorded $462.7 million in net outflows during the holiday-shortened week. Notably, Friday’s withdrawal slowed sharply to $13.2 million compared with $282.7 million on Thursday, suggesting selling pressure may be exhausting.

    Ethereum ETFs Attract Strong Inflows

    Ethereum ETFs, meanwhile, recorded nearly $197 million in net inflows for the week. Friday’s $216.4 million influx helped drive the weekly total higher despite earlier outflows. QCP Capital said that the divergence indicated differentiated positioning between the two crypto assets. Ethereum is facing resistance at $2,500 to $2,550, while support sits at $2,400 to $2,425, with a secondary support zone located at $2,300 to $2,350.

    Low Volatility Points to Hedged Positioning

    Bitcoin volatility also remains relatively low. QCP Capital stated that the volatility curve is still upward sloping while the 25-delta risk reversal is around negative 3 volatility points. Puts are therefore moderately more expensive than calls, even as positioning remains well below stressed levels. The firm added that traders are staying hedged rather than taking a strong directional position.

    Bitcoin’s Resilience Against Tech Rout

    Several factors could influence risk appetite for crypto assets. Oil prices have moved higher following a drone attack that temporarily shut Saudi Arabia’s East-West pipeline. A prolonged disruption could add pressure to risk assets through higher energy costs and tighter financial conditions.

    At the same time, artificial intelligence-linked equities have come under pressure following public discussions about slowing AI development over safety concerns. QCP Capital said that Bitcoin’s relative resilience compared with the sharper declines across technology and semiconductor stocks is a constructive sign for its “uncorrelated positioning.” However, a deeper unwind in crowded technology trades could still spill into crypto through weaker overall risk appetite and tighter liquidity.

    Regulatory Catalyst: CLARITY Act Senate Vote

    Crypto markets also have a separate regulatory catalyst in Washington. Tuesday’s expected Senate procedural vote on the updated CLARITY Act could clarify the respective roles of the SEC and CFTC. This is expected to strengthen the medium-term case for institutional adoption by reducing regulatory uncertainty, though procedural progress would not guarantee final passage.

    More on the crypto market’s state and the upcoming key events can be found in our video below.

  • Bitcoin vs Ethereum ETFs: Which asset is winning September’s flow battle?

    Bitcoin vs Ethereum ETFs: Which asset is winning September’s flow battle?

    Bitcoin ETFs See $462.7 Million Weekly Outflows as Price Drops Below $78K

    Following a robust August rally that brought $3.52 billion in monthly inflows to spot Bitcoin ETFs, September has opened with significant selling pressure. During the week of September 8–11, these funds recorded cumulative net outflows of $462.73 million, coinciding with Bitcoin’s price decline from approximately $79,000 to $77,324.76—a 2.9% weekly drop.

    Daily Breakdown of Bitcoin ETF Flows

    The week began negatively on September 8 with $46.6 million in net outflows. Fidelity recorded $17.1 million in redemptions, Invesco saw $4.7 million exit, and Grayscale’s GBTC led with a substantial $65.5 million outflow, according to SoSo Value data.

    Selling intensified on September 9, pushing net outflows to $120.2 million. BlackRock experienced a $19.5 million outflow, ARK Invest’s ARKB lost $78.0 million, and GBTC shed another $27.2 million.

    September 10 marked the worst session with $282.7 million in net outflows. Pressure eased slightly on September 11, limiting outflows to $13.2 million. Across the four-day period, ARKB and GBTC emerged as the primary sources of selling pressure.

    Ethereum ETFs Diverge With Strong Late-Week Inflows

    Spot Ethereum ETFs followed a different trajectory, per Farside Investors data. After a weak September 8 showing $24.3 million in net outflows, the products reversed decisively on September 9 with $34.7 million in net inflows. Selling returned on September 10 before a dramatic reversal on September 11, when Ethereum ETFs recorded $216.4 million in net inflows—the largest single-day positive total of the week.

    BlackRock’s ETHA dominated with $148.8 million in inflows, followed by BlackRock’s ETHB at $18.3 million.

    Altcoin ETFs Show Mixed Results

    Other cryptocurrency ETFs displayed varied flow patterns during the same period. Solana’s SOL ETF attracted $10.30 million in weekly inflows, driven primarily by Bitwise’s BSOL. XRP ETFs recorded zero flows, while Hyperliquid’s HYPE ETFs saw $26.42 million in net outflows, according to SoSo Value.

    Market Sentiment Remains Constructive Despite Outflows

    Despite the weekly outflows, Bitcoin’s dominance persists. The altcoin index stands at 40, indicating Bitcoin continues to lead the market, per Coinglass data. The Crypto Fear and Greed Index sits at 63—firmly in “Greed” territory—suggesting investors remain bullish and view the slowdown as temporary, according to Alternative.

    This optimism aligns with the strong inflows seen during the first week of September, supported by shifting macroeconomic expectations around U.S. monetary policy.

  • Bitcoin ETFs End Nine-Day Inflow Streak as Ethereum Funds Extend Their Run

    Bitcoin ETFs End Nine-Day Inflow Streak as Ethereum Funds Extend Their Run

    U.S. spot Bitcoin exchange-traded funds recorded $201.9 million in net outflows on Aug. 28, ending a nine-day inflow streak and reducing cumulative net inflows to approximately $55.1 billion. Ethereum ETFs continued to attract investor capital, recording $102.1 million in inflows and extending their own streak to 10 consecutive days.

    Bitcoin ETFs reverse after strong inflow streak

    U.S. spot Bitcoin ETFs broke a nine-day winning streak on Friday as investors withdrew money while Ethereum ETFs continued to pull in fresh capital.

    According to SoSoValue data, the Bitcoin funds posted $201.9 million in net outflows on Aug. 28. The reversal ended a run of consecutive inflows that had continued since mid-August, lowering cumulative net inflows to about $55.1 billion. The funds held approximately $93.9 billion in total net assets. Decrypt’s ETF flow tracker changed its Bitcoin sentiment reading to “bearish” on the day.

    Myriad: Bitcoin’s next price move? Click to make your prediction.

    An exchange-traded fund, or ETF, is an investment vehicle that holds an underlying asset and trades on a traditional stock exchange. It allows investors to buy and sell shares through a standard brokerage account. A spot Bitcoin ETF holds Bitcoin directly, with each share representing a claim on a portion of the fund’s holdings. This structure gives investors indirect exposure to Bitcoin’s price without requiring them to purchase the cryptocurrency themselves.

    The convenience of spot Bitcoin ETFs has helped attract traditional and institutional investors. U.S. spot Bitcoin ETFs launched in January 2024 after years of regulatory rejections and quickly became some of the fastest-growing ETFs in history.

    Daily ETF flows now shift between heavy accumulation and sharp withdrawals as Bitcoin prices and the broader macroeconomic environment change. As a result, market observers closely monitor fund flows as a measure of investor sentiment.

    Bitcoin ETF Net Flows. Image: Decrypt

    Ethereum ETFs extend 10-day inflow streak

    Friday’s pullback followed an otherwise strong period for Bitcoin ETFs. The funds attracted $2.8 billion during an eight-day inflow streak as Bitcoin tested $80,000. They also recorded their largest single-day inflow since May, with daily inflows repeatedly exceeding $300 million and reaching more than $600 million on Aug. 20.

    Ethereum ETFs showed no comparable weakness. The funds brought in $102.1 million on Aug. 28, extending their inflow streak to 10 days, according to SoSoValue. Their cumulative net inflows rose to approximately $12.9 billion, while total net assets reached $13.8 billion.

    Ethereum ETF Net Flows. Image: Decrypt

    Decrypt’s tracker maintained its Ethereum reading at “bullish.” The sustained demand represents a notable shift, with Ethereum products in recent sessions nearly matching or exceeding Bitcoin’s daily inflows despite having a much smaller asset base.

    The divergent ETF flows emerged as Bitcoin declined after Federal Reserve Chair Kevin Warsh delivered hawkish remarks at Jackson Hole. The comments cooled a rally that had pushed Bitcoin toward $80,000, although the cryptocurrency later recovered to around $79,000 over the weekend.

    The single-day Bitcoin ETF outflow remains modest compared with the tens of billions of dollars the funds have accumulated since their launch. The end of a nine-day inflow streak does not necessarily indicate a broader decline in institutional demand, which has remained strong across both Bitcoin and Ethereum.

  • Ethereum news: Does a system simplification strengthen the trust of investors?

    Ethereum news: Does a system simplification strengthen the trust of investors?


    • Vitalik Buterin proposes Beam Chain and RISC-V to reduce the complexity of the Ethereum system protocol.
    • Despite ETF inflows and positive signals, ETH fights under $ 2,000 before the Pectra upgrade on May 7th.

    Ethereum is traded near $ 1,800 because investors are waiting for the Pectra upgrade on May 7th and Vitalik Buterins evaluate proposed protocol changes.

    Buterin has proposed to replace the Beacon Chain with Beam Chain and switch the EVM to RISC-V to reduce complexity.

    Redesign should reduce complexity

    In a recently published Blog post He wrote that the complexity of Ethereum leads to security and cost problems in the long term. He says the Bitcoin protocol is much easier:

    “Every clever high school student could understand it, and hobby programmers could easily create clients.”

    This is not the case with Ethereum’s execution layer, which the Ethereum Virtual Machine (EVM) uses. According to the butterin, this is because she is still optimized for outdated cryptographic operations. He wants to change that. He suggests taking over the RISC-V architecture, which could make the execution up to 100 times more efficient.

    That would have some problems with the downward compatibility, but he has a gradual approach in mind to migrate the consensus to a native RISC V environment. He also suggests replacing the Beacon Chain with the Beam Chain to simplify the peer-to-peer infrastructure.

    In this way, Ethereum, in his opinion, could reduce the development costs, minimize the risk of errors and achieve a stronger participation of the community in protocol development. He believes that this could happen with some coordinated upgrades within five years.

    Technical charts show uncertainty – ETH tests support zones

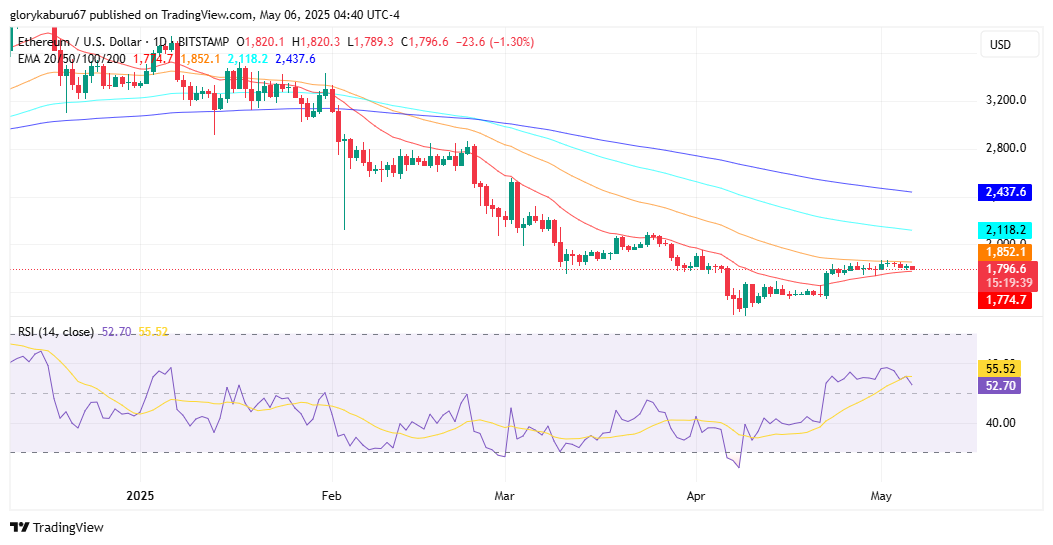
    According to Buterin’s blog post, the price of Ethereum fell 1 % and is currently traded at $ 1,803.51. ETH has not managed to rise over the 9-week exponential moving average (EMA) since January. Ethereum printed a Doji candle last week, which reflects the uncertainty between buyers and sellers. A rejection of the EMA level indicates a declining upward moment.

    ETH/USD Daily Chart.quelle: Tradingview

    According to the youngest CNF-Analyse ETH shows a tight Bollinger band squeeze at the ETH/BTC couple, which was last observed in June 2020. Such a squeeze usually precedes a volatility outbreak.

    On the downward side, support levels must be observed at $ 1,785, $ 1,750 and $ 1,685. The resistance is $ 1,830 and $ 1,880, a further increase is limited at $ 1,920. The technical indicators show the MACD on the daily chart in the declining area and the RSI under the 50 mark, which indicates continuing pressure.

    The ETH liquidations of the last 24 hours amounted to $ 44.45 million, with $ 35.71 million in long positions. The futures data of Coinglass show the continued restraint of the dealers. The current range between $ 1,749 and $ 1,855 indicates a low pressure to buy.

    Institutional demand speaks for a positive outlook

    Sea Socal recorded US spot ETFs for Ethereum last week net inflows of $ 106.75 million. This is the second week in a row with positive tributaries and reflects the traditional interest of investors despite the recent price stagnation.

    As CNF reported, the historical performance speaks for a bullish May. Since 2016, ETH has increased an average of 27.36 % in May, and 24.65 % last year. Technical analysts indicate that the relative strength index (RSI) has once again tested a multi-level level of support, a pattern that preceded earlier relaxation.

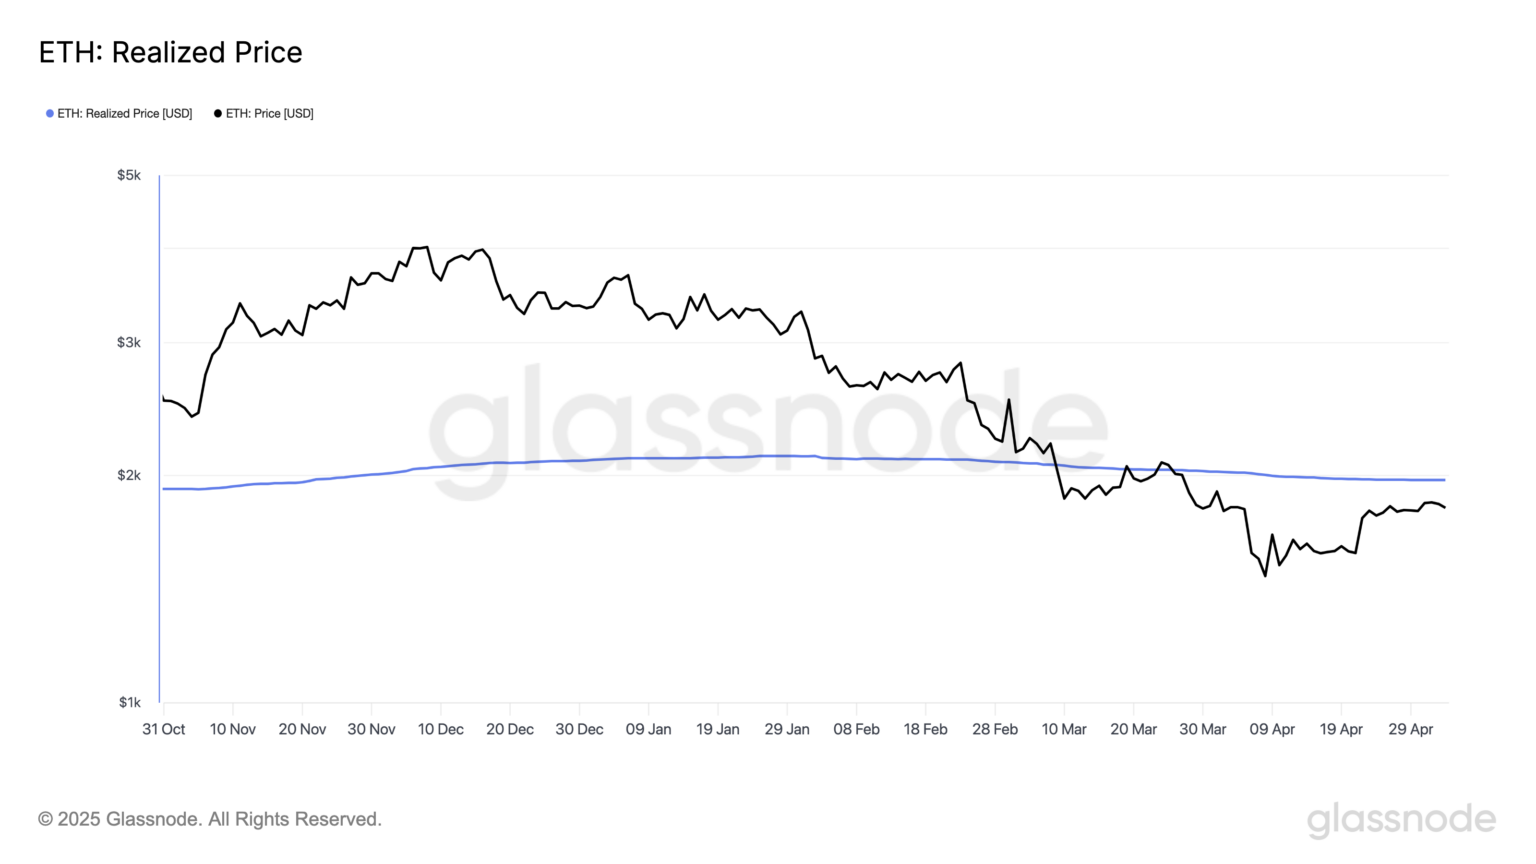
    In the meantime, Ethereum continues to act under his on-chain Realized Price of $ 1,972. This level, as from Glass node defined, the average cost basis for ETH represents in circulation. Remaining under this brand signals a weak upward dynamics and underlines the bearish mood.

    Ethereum-realized-price. Quelle. Coinglass

    The Pectra upgrade, which is planned for May 7th, aims to increase the ETH operating limits from 32 to 2,048 per validator. In addition, the number of “Blob” data units per block is increased and the transition to the EVM object format (EOF) is carried out. These changes aim at improved scalability, lower Layer 2 costs and improved Smart Contract efficiency.

    Despite these upgrades and institutional interest, Ethereum has not yet recaptured the psychological brand of $ 2,000. An outbreak of $ 1,880 could trigger a movement towards $ 2,050. Until then, the market remains careful in the run-up to the Pectra introduction.