Tag: El Niño

  • Kelvin Waves Headed for California Coast This Fall

    Kelvin Waves Headed for California Coast This Fall

    A coastally trapped Kelvin wave is advancing northward along the Mexican coastline and is projected to reach California waters over the coming month, bringing elevated sea levels, record-warm ocean temperatures, and increased coastal flooding risks.

    What Is a Coastally Trapped Kelvin Wave?

    If the term “Kelvin wave” is unfamiliar, you are not alone. These waves are a feature of fluid dynamics that rarely affect daily life. However, the phenomenon currently moving up the West Coast is a direct manifestation of the strengthening El Niño pattern and will become increasingly relevant to California residents in the weeks ahead.

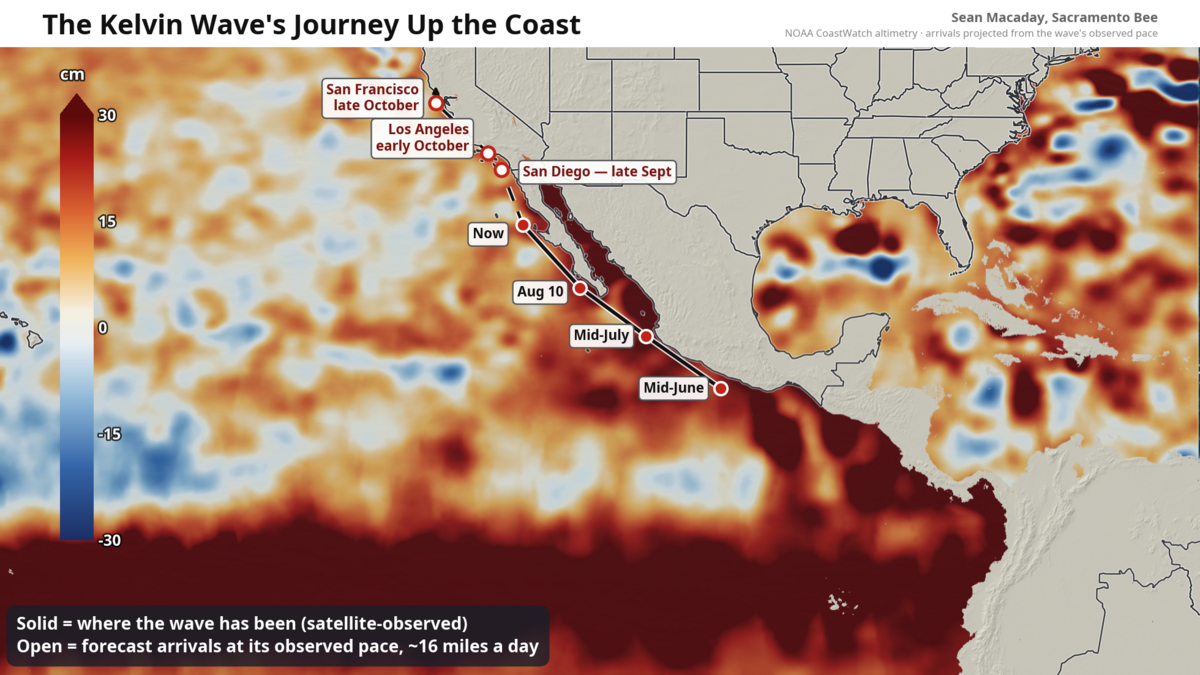
    Scientifically classified as a coastally trapped wave, this pulse of warm, elevated ocean water stretches hundreds of miles and is traveling north at roughly 6 mph — approximately the pace of a jogger. As of this week, the wave’s leading edge sits about 300 miles south of Southern California’s beaches, centered off central Baja California.

    Origins in the Western Pacific

    The wave originated months ago in the far western Pacific, where bursts of westerly wind along the equator shoved a massive pulse of warm water eastward across the ocean basin. When that pulse encountered Central America early this summer, the Earth’s rotation and the coastline’s geometry forced a portion of it to turn left and hug the shore northward, trapped against the coast by the Coriolis effect and the deep pool of warm water accumulated by El Niño.

    This is a “downwelling” Kelvin wave: the original warm pulse is so thick that it pushes the thermocline deeper, suppressing the normal upwelling of cold, nutrient-rich water that typically keeps the eastern Pacific cool. Satellite altimetry has tracked its progress continuously — passing Acapulco in mid-June, Puerto Vallarta in mid-July, and the tip of the Baja Peninsula in early August.

    Current Conditions and Projected Arrival

    Inside the wave, sea levels are running 4 to 8 inches above normal, and water temperatures off Baja have been measured in the mid-80s Fahrenheit. At its current speed, the wave is expected to reach:

    • San Diego by late September
    • Los Angeles shortly thereafter
    • San Francisco around mid- to late October

    Coastal Flooding: A Game of Margins

    A few inches of additional sea level may sound minor, but coastal flooding operates on margins stacked upon margins. This is not a tsunami; there will be no sudden impact. Instead, the wave quietly raises the baseline upon which daily tides ride for weeks or months.

    The effect is most pronounced during peak high tides — typically around full and new moons. With the baseline already elevated, water that would normally stop at the top of the beach can inundate parking lots, bike paths, and low-lying streets. The National Weather Service is expected to issue coastal flood advisories around high-tide windows once the wave settles in. Additionally, any incoming swell will produce larger wave run-up and accelerated beach erosion.

    Impacts Extend Inland to the Sacramento–San Joaquin Delta

    The connection reaches farther inland than a map suggests. The Delta is tidal, and in early fall — when river flows are near their annual low — the ocean’s twice-daily pulse propagates all the way up the Sacramento River to downtown Sacramento. A higher ocean at the Golden Gate translates into a smaller but measurable lift in water levels through the Delta’s leveed margins upstream. This also shifts the delicate balance between river outflow and salty bay water pushing inland, a critical factor for water quality and ecosystem health.

    Record-Breaking Ocean Temperatures and Marine Heatwave

    Coastal ocean temperatures will warm rapidly as the wave arrives. The warmest ocean temperatures ever recorded along the California coast are possible for San Diego later this month or in October, running 5 to 10 degrees Celsius (9 to 18 degrees Fahrenheit) above average. For the Central Coast, waters near San Francisco — currently in the 55–60°F range — could warm to near 70°F.

    This marine heatwave is expected to be severe, with cascading effects on the marine ecosystem likely persisting into winter. Warmer waters disrupt food webs, stress kelp forests, and can trigger harmful algal blooms.

    Compounding Winter Risks: El Niño Rains Meet Elevated Seas

    Compounding the threat, seasonal forecasts call for a wetter-than-average winter across California driven by El Niño. Elevated sea levels from the coastally trapped wave will coincide with periods of heavy rainfall and increased river runoff. When boosted high tides push inland simultaneously with storm-driven flows from land, the combined effect could exacerbate flooding in low-lying coastal communities and the Delta region.

  • El Niño Returns: What It Means for DC Winter Weather

    El Niño Returns: What It Means for DC Winter Weather

    Washington D.C. Winter Forecast 2026–2027: Mild Temperatures, Below-Average Snowfall Predicted

    The Washington, D.C. region is entering the 2026–2027 winter season with a forecast that favors manageable conditions, according to the Old Farmer’s Almanac. While the DMV area recently dug out from a powerful storm that dumped snow and ice, canceled flights, and closed schools, the long-range outlook suggests a generally mild winter with above-normal temperatures and slightly below-normal snowfall.

    What the Almanac Projects for the Nation’s Capital

    Last winter delivered a major snowstorm that brought nearly 8 inches to the District and more than 12 inches to surrounding areas. This year, the Old Farmer’s Almanac indicates the capital will largely avoid the deep freezes and heavier snow totals expected in the Appalachians and central New England.

    Key Windows for Cold and Snow

    Even with a milder baseline, the forecast highlights specific periods when commute disruptions and winter weather are most likely:

    • Coldest periods: Early to mid-December, early to mid-January, and early and late February.
    • Snowiest periods: Late November, early and mid-January, early and late February, and late March.

    Climate Drivers Shaping the Season

    The Almanac attributes the outlook to a convergence of global atmospheric and oceanic patterns:

    El Niño’s Dominance

    Unusually warm waters in the Pacific are heavily influencing the North American jet stream. For the Mid-Atlantic, this strong El Niño translates to a largely warmer, drier winter baseline.

    Polar Vortex Threat

    While the season leans mild, D.C. remains vulnerable to the Polar Vortex. If this mass of Arctic air wobbles southward, the capital will experience sudden, biting temperature plunges.

    Global Wind and Ocean Anomalies

    A warm Atlantic pattern and a neutral-to-positive Indian Ocean Dipole (IOD) are altering high-altitude storm tracks. Combined with decreasing solar activity as Solar Cycle 25 wanes, these complex variables ensure that while D.C. will avoid a relentless winter, sporadic winter weather events will still hit the region.

    Source: Information for this forecast was sourced from the Old Farmer’s Almanac Winter Weather Forecast 2026–2027.

  • This El Niño Will Be Unlike Any Seen in the Past Eight Decades

    This El Niño Will Be Unlike Any Seen in the Past Eight Decades

    In the middle of the Pacific Ocean, along the equator, scientists monitor a vast rectangular region known as Niño 3.4. Covering an area roughly two-thirds the size of China, the mostly uninhabited zone is tracked by satellites and moored buoys that record tiny changes in ocean temperatures.

    When the water in this part of the Pacific rises at least 0.5 degrees Celsius above normal for several months, scientists classify the change as the start of an El Niño phase. That seemingly modest warming can trigger floods, wildfires, droughts and famine around the world.

    Right now, Niño 3.4 is exceptionally hot.

    “Like a baby pool,” Kristina Tietjen, who spent most of August scuba diving in the middle of this mass of abnormally warm water, told me.

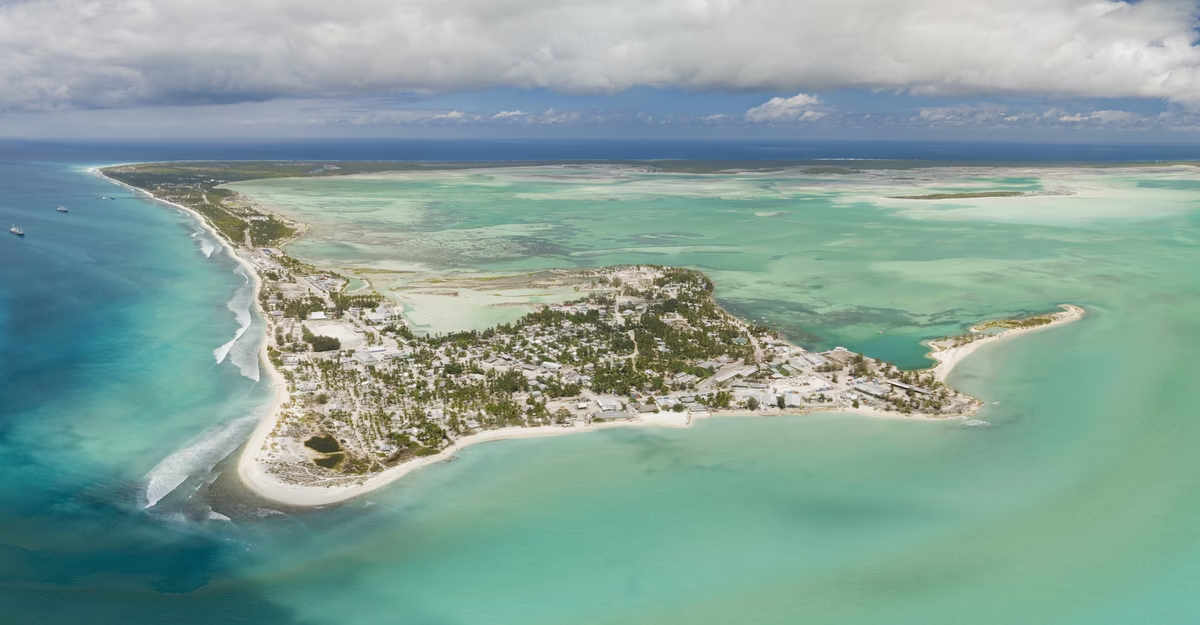
    Tietjen has visited Kiritimati, the world’s largest atoll, for more than a decade to study its coral reefs. She typically wears a medium-weight wetsuit while diving, but during this trip her team needed only rash guards. Although this El Niño cycle is still in its early stages—and is expected to be the strongest ever recorded—the waters around Kiritimati have already reached temperatures 3 to 4 degrees Celsius above normal.

    El Niño’s impact on Kiritimati’s coral reefs

    Tietjen’s work on Kiritimati, pronounced like Christmas, has given her a firsthand view of how repeated marine heatwaves are affecting the atoll’s once nearly pristine tropical coral reefs. During her first El Niño, in 2015–16, 90 percent of Kiritimati’s coral reef died. The ecosystem then experienced years of slow and incomplete recovery.

    This month, Tietjen and her colleagues—members of Canadian scientist Julia Baum’s laboratory at the University of Victoria—found that nearly half of the island’s remaining corals had already bleached. Coral bleaching can lead to death if the warming continues.

    When Tietjen returns, she may well be swimming over a graveyard.

    Most of the world feels El Niño through the ripple effects of heat accumulating in the equatorial Pacific and spreading into the atmosphere and around the globe. In some regions, the phenomenon brings intense rainfall and powerful storms. Elsewhere, crop-killing dry spells can last for months.

    Along South America’s Pacific Coast, torrential rain and landslides have temporarily closed a major route to Machu Picchu in Peru, while deadly floods have struck arid areas of northern Chile. India and Ethiopia are experiencing some of their driest summers on record. El Niño generally brings more rain to the southern United States and drier conditions across a band of the northern states.

    Strong El Niño events can also produce record-breaking heat. This event is developing in ways unlike any catalogued during the past eight decades. A 2-degree-Celsius rise in the Niño 3.4 region typically earns the label “Super El Niño.” Temperatures have already passed that threshold, and experts expect the warming could peak at roughly twice that level.

    “We are now pretty certain this will be an exceptional event,” Malte Stuecker, the director of the International Pacific Research Center at the University of Hawaii at Manoa, told me.

    Record ocean temperatures raise global concerns

    One reason Stuecker expects the warming to intensify is that equatorial buoys can measure temperatures far below the ocean’s surface. More than 100 meters underwater, a huge mass of warm water has accumulated and is expected to rise toward the surface in the coming months.

    The heat building in the ocean has produced a graph in which the current year veers sharply away from historical trend lines, climbing erratically into unfamiliar territory.

    Scientists continue to debate how much climate change affects the frequency and strength of El Niño cycles. They agree, however, that these events are now occurring in an ocean warmer than it was in the past.

    Last Saturday, the daily global average sea-surface temperature reached 21.1 degrees Celsius (70 degrees Fahrenheit), its highest recorded level, according to Europe’s Copernicus Climate Change Service. Even if El Niño cycles themselves are not changing, their peaks are rising along with the planet’s broader temperature baseline. The result is repeated stress on marine life and disruption to ecosystems that may not be reversible.

    Peru’s seabirds face another food crisis

    Carlos Zavalaga, director of the seabird laboratory at the Universidad Cientifica del Sur in Lima, began to understand the scale of this year’s warming in mid-June. He had traveled to Macabi and Guanape Norte, two islands off northern Peru, after hearing reports that hundreds of dead birds were washing up along the coasts of Peru and Ecuador.

    He had also seen reports of hungry Peruvian pelicans gathering around fish markets in port cities in search of food. The two islands had been crowded with pelicans, Inca terns and Humboldt penguins only a year earlier. When Zavalaga arrived, he found empty nests, including some containing eggs and starving chicks.

    “They were abandoned islands,” he told me.

    The seabirds feed on anchovies carried by the Humboldt Current, a cold, nutrient-rich upwelling that supports major fisheries along South America’s Pacific Coast. During El Niño years, warmer water moving east across the Pacific displaces the current, causing large schools of anchovies and other feeder fish to disappear from coastal waters.

    The decline has been so severe that Peru shut down its anchovy fishery this month. The fishery is a key part of the country’s economy, yet much of the annual quota remained unfilled.

    Long before satellite monitoring, Peruvian fishermen observed the cycles of warmer water and declining fish stocks. Because the phenomenon often peaked around Christmas, they named it after the Christ child. References to El Niño appear in Peru’s scientific literature as far back as the 19th century.

    Zavalaga has witnessed seabird die-offs during his three decades of research. What concerns him now is the speed and severity of the repeated shocks. Just three years ago—the same year avian flu killed more than 500,000 seabirds—another El Niño struck Peru’s coast.

    The birds that had only partially recovered now face another potential die-off.

    “It’s like a boxing match: You have a first knockout, you try to recover quickly, and then you have a second knockout,” he said. “I cannot imagine what will be the scenario by the end of this year.”

    Zavalaga doubts the birds will become extinct, but some species could move farther south in search of colder waters. Peru’s coastline, along with the culture that depends on its fish and seabirds, could be permanently changed.

    Flooding and changing weather on Kiritimati

    When warming began around Kiritimati, one of the few populated islands within the Niño 3.4 monitoring zone, resident Bill Newton was struck by how visible the changes were. He told me that the normally dry island became saturated, while recurring floods began washing out roads.

    The wet conditions brought swarms of mosquitoes. Previous El Niño events have been linked to outbreaks of dengue and chikungunya. They also brought clouds of dragonflies, which Newton had not seen before. Higher-than-normal tides flooded homes along the coast, while tuna—fish that can thrive in warmer water—attracted dozens of fishing boats offshore.

    The prevailing winds also changed direction.

    Corals are especially vulnerable to rising water temperatures because they cannot relocate and are highly sensitive to heat stress. According to Baum, whose laboratory includes Tietjen, as little as four weeks in water just 1 degree Celsius warmer than normal can cause bleaching. The process expels the symbiotic algae that provide corals with food and their vivid colors.

    Baum has studied Kiritimati’s reef since 2009. After the previous El Niño destroyed nearly the entire reef, she began considering whether she might witness the disappearance of a complete ecosystem during her lifetime.

    In a 2018 paper published in Science, Baum projected that repeated bleaching events could become frequent enough to prevent coral reefs from recovering. Reefs typically require roughly 10 to 30 years to recover from mass mortality, and successive bleaching events could arrive before they have time to regrow.

    In the years since, Baum had remained hopeful as surviving corals adopted symbiotic algae with greater heat resistance. This year’s warming and the rapid pace of bleaching have erased that hope.

    Why this El Niño may change ecosystems permanently

    Some of what happens next is predictable. El Niño is not a random force of destruction. It is a warming phase in a defined region of the Pacific that changes the likelihood of particular weather outcomes around the world.

    Those probabilities are reliable enough that the U.S. Navy has already scheduled a hospital ship to travel to Peru’s coast in February, positioning it to provide assistance after anticipated flooding.

    But Baum and other scientists who study and care for the fragile ecosystems of the equatorial Pacific are discovering that a familiar climate cycle does not guarantee familiar conditions when it ends.

  • September Outlook: Above-Average Fall Heat Expected as Northwest Cools

    September Outlook: Above-Average Fall Heat Expected as Northwest Cools

    September is expected to bring above-average temperatures across most of the United States, according to the latest outlook from Atmospheric G2 and The Weather Company. The Pacific Northwest is the main exception, with cooler-than-normal conditions forecast for the first month of meteorological fall.

    September temperature outlook

    • Hottest conditions from the Dakotas to Texas: The strongest above-average temperature signal extends from North Dakota south through the Plains and into Texas.
    • Warmth from the Gulf Coast to the Great Lakes: Above-normal temperatures are also expected across the Rockies and the mid-Atlantic.
    • Slightly warmer in the Southwest and Northeast: Both regions are forecast to remain warmer than normal, although the departure from average should be more modest than across the Plains.
    • Coolest weather in the Pacific Northwest: Below-normal temperatures could offer some relief after a difficult stretch of fire weather, making the region the most likely to experience sweater-weather conditions.

    September precipitation outlook

    The wettest conditions relative to normal are expected across the Four Corners, where the North American monsoon should remain active during its final weeks before winding down in late September.

    Above-normal precipitation is also forecast from the northern Rockies and Great Basin eastward through the Plains and into parts of the Midwest.

    The Pacific Northwest coast is expected to remain drier than normal despite the cooler temperatures. That dryness could limit the fire-season relief that a cooler month would otherwise provide.

    Drier-than-average conditions are also projected across the East and Southeast, including the Great Lakes, upstate New York, much of the Northeast, Florida and parts of the Gulf Coast.

    El Niño developing rapidly

    A historically strong El Niño is emerging rapidly, according to Todd Crawford, vice president of meteorology at Atmospheric G2 and chief author of the outlook.

    The current event is clearly outpacing all other events at this point in their development, including the 1997 and 2015 El Niños.

  • El Niño Triggers Sudden Sea Level Rise Along California Coast

    El Niño Triggers Sudden Sea Level Rise Along California Coast

    The sea level along California’s coast is projected to rise by about a foot by mid‑October as a coastal Kelvin wave — driven by the developing El Niño — pushes a large volume of water northward from offshore Mexico and Central America. According to Dillon Amaya, an oceanographer at North Carolina State University, the wave’s arrival marks one of the first significant impacts of the powerful El Niño taking shape in the tropical Pacific.

    “Typically, we think of El Niño and its impact on precipitation, but some of the first indications that El Niño is really occurring are the arrival of these coastally trapped waves,”

    Amaya said.

    What Is a Coastal Kelvin Wave?

    A coastal Kelvin wave is not a breaking wave visible at the beach. It is barely perceptible to the human eye as it slithers northward from offshore of Mexico’s Baja Peninsula at roughly six miles per hour. Satellites that measure changes in ocean height detect these waves. While you cannot surf a Kelvin wave, it affects surfing by raising coastal sea levels, which increases the likelihood of damage from astronomical high tides and winter storms also influenced by El Niño. In essence, one El Niño‑related phenomenon — sea level rise — compounds the damage caused by others.

    Kelvin waves in the open ocean are massive, slow‑moving undulations that slosh up and down like water in a bathtub. Once they reach land, they can shift direction, moving north and south parallel to the coast and raising ocean levels by 6 to 12 inches as they travel.

    El Niño’s Broader Impact on Sea Levels

    The ongoing El Niño, characterized by much hotter‑than‑average sea‑surface temperatures in the tropical Pacific, is forecast to be the strongest such event on record since at least 1950. El Niño temporarily increases water levels on top of the long‑term sea‑level rise driven by human‑caused climate change.

    Water levels along the California coastline have already been rising due to earlier El Niño‑linked Kelvin waves, including one that reached California in May and June. The upcoming wave will further elevate water levels and put the state at greater risk of coastal flooding, Amaya said.

    “It’s an epic transit,”

    Amaya said of the Kelvin wave’s journey. In about 120 days, a Kelvin wave can travel from the western Pacific to the Pacific Northwest coastline of the U.S., or even as far as the Gulf of Alaska, raising ocean heights along the way.

    These large, undulating Kelvin waves are part of what helps El Niño form, transporting heat from the western Pacific Ocean to its central and eastern regions near the equator. The waves push huge quantities of ocean heat under the sea surface in a process known as downwelling. When they reach the central and eastern tropical Pacific, that undersea heat rises, or upwells, increasing ocean temperatures there.

    In addition, sea levels are rising along the West Coast because the hotter waters associated with El Niño expand to take up more space.

    “The wave would add to what is already there,”

    Amaya said. The total sea level height, including this latest wave, is anticipated to be 10 to 14 inches higher than normal along the California coast.

    Expert Warnings on Coastal Flooding

    Patrick Barnard, research director at the Center for Coastal Climate Resilience at the University of California, Santa Cruz, said the ocean height increase puts many coastal residents at risk of flooding.

    “Because so many of our communities are built right at sea level on the West Coast, and our extreme water levels don’t vary widely, every 2 to 4 inches of sea level doubles our flood risk,”

    Barnard said.

    Amaya noted that background sea level rise since the preindustrial era along parts of the California coast has been about one foot, so these El Niño‑related changes will double that century‑long trend all at once, albeit temporarily.

    “El Niño has arrived. This is some of the first evidence that El Niño is impacting the United States.”

  • Hawaii Hurricane Lowell: At least one dead as storm devastates parts of state, governor says

    Hawaii Hurricane Lowell: At least one dead as storm devastates parts of state, governor says

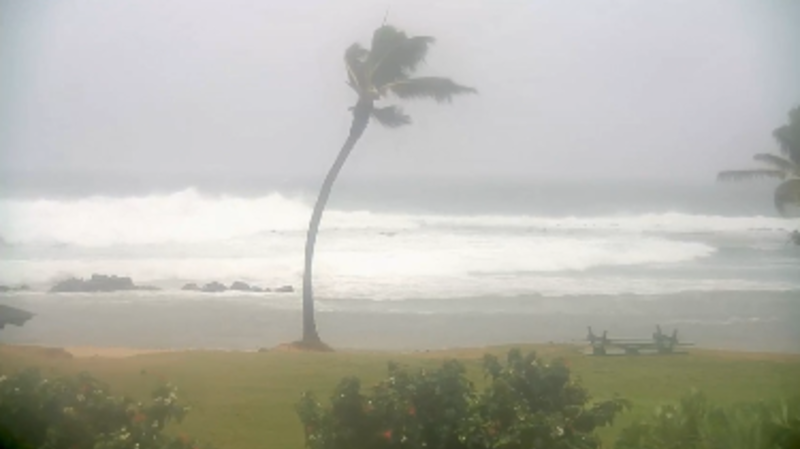
    Hurricane Lowell delivered a devastating blow to Hawaii as it swept past the state’s islands, leaving at least one person dead, damaging homes, and cutting power to tens of thousands, according to Gov. Josh Green.

    Governor Assesses Damage and Recovery Efforts

    We’ve seen an incredible amount of damage near the shore, Green told CNN’s Jake Tapper, adding the storm has likely caused hundreds of millions of dollars in damage. We’re doing what we can to recover, but this was a very serious storm, the governor told CNN.

    More than 300 National Guard members have been deployed across the islands, and the Department of Transportation is assisting with mudslides and washed-out or damaged roads. Crews are prioritizing power restoration to hospitals.

    Fatalities and Injuries Reported

    A homeless man on Oahu died after a tree fell on the tent he was living in, the governor confirmed. Kauai County spokesperson Ryan Wilson told CNN there have also been storm-related injuries, though details on severity and the extent of structural damage were not immediately available.

    Widespread Power Outages and Infrastructure Damage

    Wind gusts exceeding 80 mph knocked out power for roughly 90% of homes and businesses in Kauai County, which includes the islands of Kauai and Niihau, according to PowerOutage.com. The county’s utility provider stated Tuesday morning there is no estimated time of restoration and warned outages could be long-lasting.

    There are currently downed power lines, downed trees, debris all over Kauai, so we are really urging folks to stay in place, said Alan Clinton, situation unit leader with Kauai County. More than 30,000 customers also lost power on Oahu due to tropical-storm-force wind gusts.

    Evacuations and Emergency Shelters

    Voluntary evacuation advisories are in place for 650 residences on the south and west shores of Kauai due to storm surge, Wilson and county emergency management spokesperson Molly Pierce told CNN. In Kapa’a, dozens of guests at the ISO Hotel were evacuated to shelters Monday, according to CNN affiliate KITV. As of Tuesday morning, more than 300 people and dozens of pets were housed in Kauai County emergency shelters.

    Coastal Flooding and Transportation Disruptions

    Coastal flooding closed roadways in South Maui and areas of Maui Nui Monday morning, the County of Maui reported on Facebook. The flooding left debris clogging roads, damaged transportation infrastructure, and forced park and service closures. On Oahu, high surf inundated several ground-floor units in a western condominium, CNN affiliate Hawaii News Now reported.

    All flights at Lihue Airport, Kauai’s primary airport, were canceled Monday afternoon. The airport will reopen when conditions allow, according to Hawaii’s Department of Transportation. All state and county offices, Kauai Community College, and public schools are closed in Kauai County and on Oahu Tuesday as cleanup and damage assessments continue.

    Rainfall Totals and Lingering Threats

    Lowell has weakened to a tropical storm as it moves north away from Hawaii, but trailing rainbands continue to drop rain on already saturated areas. More than a foot of rain has fallen in higher elevations on Kauai, while Oahu’s Koolau mountains recorded 5 to 9 inches. Most other areas received 1 to 3 inches.

    El Niño Fuels Active Pacific Season

    El Niño is amplifying storm potential in the central Pacific this year, warming ocean temperatures and weakening upper-level winds that typically suppress hurricane formation, on top of long-term ocean warming from climate change. Five named storms, including Lowell, have already formed or tracked into the Central Pacific. A typical season sees only five total, but NOAA’s forecast calls for as many as 13 by season’s end.

  • El Niño Intensifies to Super Status: What It Means for Weather

    El Niño Intensifies to Super Status: What It Means for Weather

    An already powerful El Niño has intensified into “super” territory, crossing a critical threshold at an unprecedented pace for this time of year. The natural climate cycle, officially declared in June, has strengthened at a breakneck speed and is now stronger on this date than any previous event on record. Forecasters warn it is not done bulking up yet.

    Key Metric Crosses “Very Strong” Threshold

    For months, forecasters predicted El Niño would become “very strong” or “super” by fall. The key measure of its strength—the Niño 3.4 Relative Oceanic Niño Index (RONI)—has now crossed that threshold and is projected to continue soaring.

    As a refresher, El Niño is characterized by warmer-than-average sea surface temperatures along the equator in the Pacific Ocean. This warmer water triggers corresponding shifts in the atmosphere, creating a domino effect on weather patterns globally. An active Pacific hurricane season threatening Hawaii, a hurricane-less Atlantic season to date, and overwhelming wildfires in Indonesia are just a few effects already linked to this very strong event.

    The stronger an El Niño, the more likely it is to influence these weather patterns, though it does not guarantee more extreme impacts in every location.

    How NOAA Measures El Niño Strength

    To capture El Niño’s strength, National Oceanic and Atmospheric Administration (NOAA) forecasters measure how far above normal sea surface temperatures are in a specific region of the Pacific using the RONI metric. The latest weekly RONI value hit 2.0 degrees Celsius (3.6 degrees Fahrenheit) above average. This marks the threshold for “very strong,” the highest official category set by forecasters, and the point where El Niño gains its unofficial “super” moniker.

    These weekly values provide a reliable real-time snapshot of El Niño’s strength, which is crucial given how fast this event is gaining ground. Just a year ago, a weak La Niña—El Niño’s cool counterpart—was in place. Only a handful of other years have seen such a rapid flip to a potent El Niño, including the strongest event on record from 1982 to 1983.

    Weekly vs. Monthly Metrics

    Using weekly values is a slight departure from the norm. NOAA’s most widely recognized strength metric is a three-month rolling average RONI. The rolling average smooths out short-term data fluctuations in favor of a cleaner long-term average and updates once a month. This is how a decades-long climate record is built, but the delayed data means it will take weeks for that reading to truly capture how super-sized El Niño is right now.

    Record-Breaking Trajectory Confirmed

    This is not a normal event. In addition to being the strongest El Niño on record for this date, it is ultimately likely to become stronger than any event before it. By the end of the year, El Niño has a 75% chance of peaking as the strongest event since records began in 1950, according to NOAA’s latest forecast issued last week.

    This year’s El Niño is also unfolding in a much hotter world than previous record-setting events due to climate change. A comparison of sea surface temperatures from this year against past record events illustrates how much fossil fuel pollution has rewritten the rules.

    Climate Change Alters the Monitoring Metric

    Climate change has literally changed the metric used to monitor El Niño. This event is the first to be captured by NOAA’s RONI, which was first implemented in February. The old metric took sea surface temperatures at face value, but RONI subtracts how much warmer the Pacific Ocean is because of climate change to isolate the “true” strength of El Niño. Even with this adjustment, this El Niño continues to clear hurdles in its pursuit of record-breaking strength later this fall or early winter.

    Impacts: Past, Present, and Still to Come

    Winter is when El Niño is forecast to hit its peak strength and when its influence on global weather is typically most pronounced, but it has already left significant calling cards this summer as it strengthened rapidly.

    Hurricane Season Disruption

    El Niño has been a major factor in both the Atlantic and Pacific hurricane seasons. In the Atlantic, it has driven storm-killing wind shear to extreme levels and kept it there, even during what should be the busiest time of the season. This created a record-long wait for the season’s first hurricane.

    Conversely, El Niño has suppressed that same wind shear over the exceptionally warm Pacific, and activity has exploded. Sixteen storms, including two Category 5 hurricanes, have formed and thrived in the eastern and central Pacific so far. Hawaii alone has faced three tropical systems in less than a month. Fourteen of those storms originated in the East Pacific, which—with two and a half months of the season still remaining—will likely blow past its average seasonal storm total of 15.

    Indonesia Wildfires and Global Heat

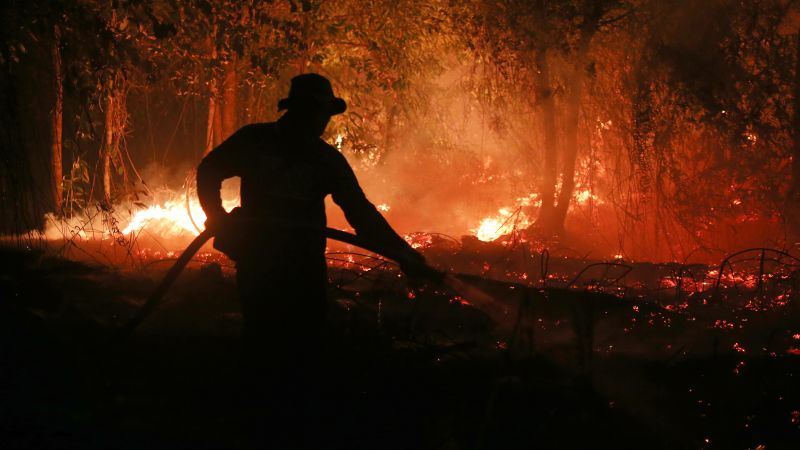
    Elsewhere, Indonesia is battling widespread wildfires, and conditions could deteriorate further. El Niño years make the country drier than usual, leaving plenty of tinder-dry vegetation for blazes to consume and limited rainfall to help fire crews tamp down ongoing activity.

    El Niño also raises global average air temperatures above levels already being increased by climate change. It was a factor in making this summer a scorcher around the globe. August was Earth’s hottest on record and could mark the start of a record-breaking warm stretch that would likely culminate in a record-hot 2024—and possibly 2025—globally.

    It is clear El Niño is already a major player, but it will hit its full stride in the months ahead, right on time to dictate winter weather across the U.S.