Tag: DeFiLlama

  • NEAR Hits New ‘All-Time High’ in TVL, But What About Its Price?

    NEAR Hits New ‘All-Time High’ in TVL, But What About Its Price?

    Key Highlights

    • NEAR Protocol surges over 10% in 48 hours, breaking the $3.2–$3.4 supply zone to print a new local swing high at $3.9 while trading above all key Exponential Moving Averages.
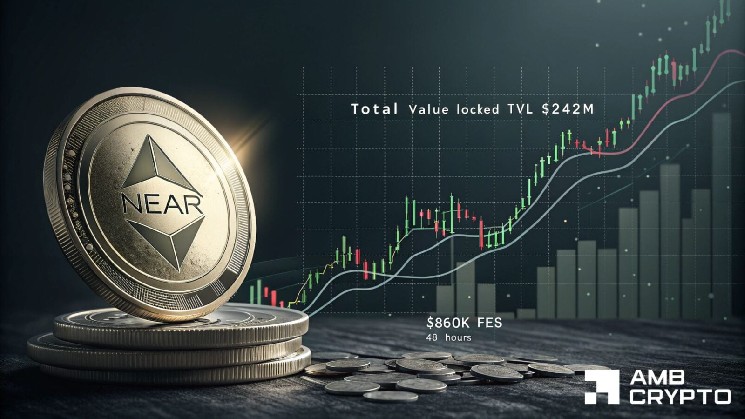
    • Network fundamentals hit record strength: Total Value Locked (TVL) reaches an all-time high of $242 million and protocol fees climb to $860,000 over the same period, per DefiLlama data.
    • NEAR satisfies all criteria for its anticipated milestone airdrop as of September 19, with TVL having crossed $70 million and price clearing $3.3, adding a fundamental catalyst to the technical breakout.

    NEAR Protocol Leads Crypto Market Rebound with Double-Digit Gains

    NEAR emerged as one of the cryptocurrency market’s biggest beneficiaries over the last 48 hours as the wider sector flashed green. The token recorded gains exceeding 10%, propelled by improving network activity that provided fundamental backing for the rally. This explosive bullish push cleared NEAR’s supply zone between $3.2 and $3.4 and printed a new local swing high at $3.9. With the token now trading above all key Exponential Moving Averages, market participants are assessing whether network bulls can sustain the momentum.

    On-Chain Fundamentals Underpin Price Surge

    Latest on-chain metrics reveal that fundamentals for NEAR Protocol have been robust over time. To be specific, the blockchain’s Total Value Locked set another record high of $242 million while network fees soared over the last 48 hours. This hike may be evidence that more capital is pouring into NEAR’s ecosystem. Additionally, NEAR protocol’s fees hit the $860,000-mark over the same period. Cumulatively, the hike in capital inflows into the network and fee generation may be a sign of growing activity across the ecosystem, according to data sourced from DefiLlama.

    Airdrop Milestone Adds Catalyst to Bullish Narrative

    Still, it is worth noting that 19th September marks the first day since NEAR ticked all the boxes for the anticipated milestone airdrop. The token’s TVL crossed the $70 million-mark two days ago while yesterday’s rally pushed the token’s price above $3.3. This convergence of technical breakout, record on-chain activity, and airdrop eligibility creates a multi-layered bullish case that distinguishes NEAR from peers relying solely on speculative momentum.

    Technical Outlook: Bulls Face Profit-Taking Test

    NEAR’s ability to maintain the prevailing momentum will depend on whether buyers continue to support the token after its 10% daily hike. A sustained rally alongside further growth in TVL and network fees would keep the bullish structure intact and could bring higher price levels into focus. Conversely, a rise in profit-taking could force NEAR to consolidate and retest nearby support. As it stands, the network’s long-term on-chain sentiments point to a potential bullish continuation. However, a short-term correction from the anticipated profit-taking cannot be ignored completely.

    Why This Matters

    The NEAR Protocol rally exemplifies a growing market trend where price action is increasingly tied to verifiable on-chain fundamentals rather than pure speculation. The simultaneous achievement of an all-time high in TVL ($242 million), a surge in protocol revenue ($860,000 in 48 hours), and the satisfaction of airdrop criteria signals genuine ecosystem adoption. For investors and developers, this suggests NEAR’s sharded proof-of-stake architecture is attracting meaningful capital and usage—critical for long-term viability in the competitive Layer-1 landscape. The upcoming days will test whether the protocol can convert speculative inflows into sticky liquidity, a key determinant of whether the $3.9 high becomes a launchpad or a local top.

    Frequently Asked Questions

    What triggered NEAR’s recent price surge above $3.9?
    The surge was driven by a combination of broad crypto market recovery, NEAR clearing a key $3.2–$3.4 supply zone, and strong on-chain fundamentals including record TVL of $242 million and $860,000 in protocol fees over 48 hours.
    Has NEAR qualified for its anticipated milestone airdrop?
    Yes, as of September 19, NEAR met all criteria for the milestone airdrop after TVL crossed $70 million and the token price surpassed $3.3.
    What are the key levels to watch for NEAR’s next move?
    Immediate resistance lies at the $3.9 local high, while support zones to watch on any pullback include the cleared supply area at $3.2–$3.4 and key Exponential Moving Averages now acting as dynamic support.
  • Nostra Hit by $3.5M Oracle Attack as Security Concerns Re-emerge

    Nostra Hit by $3.5M Oracle Attack as Security Concerns Re-emerge

    Key Highlights

    • Nostra’s lending market on Starknet suffered an oracle manipulation exploit, allowing an attacker to borrow approximately $3.5 million using artificially inflated NSTR collateral.
    • The attacker bridged roughly $1.92 million to Ethereum mainnet, comprising 234.57 ETH and 1.3 million DAI, before the protocol paused all lending, borrowing, withdrawals, and liquidations.
    • The incident contributes to a surging trend in crypto security losses, with DeFiLlama data showing $1.1 billion stolen across more than 212 on-chain incidents in the first half of 2026 alone.

    Oracle Manipulation Drains Nostra Lending Market on Starknet

    Crypto security faced another significant breach today as Nostra’s lending market on the Starknet network was exploited through a deliberate manipulation of the price feed governing its native NSTR token. According to reports, the attacker subverted the protocol’s oracle system into reporting an inaccurate, inflated value for NSTR. Because Nostra relies on this oracle price to calculate collateral worth, the manipulated feed made the attacker’s NSTR holdings appear substantially more valuable than their actual market price, creating the conditions for a large-scale borrowing spree.

    Attacker Borrows $3.5 Million Across Multiple Assets Before Bridging to Ethereum

    Once the corrupted price data was accepted by Nostra’s oracle, the attacker leveraged the overvalued NSTR collateral to borrow roughly $3.5 million in a basket of assets, including Ethereum (ETH), Starknet (STRK), Circle’s USDC, Tether’s USDT, Wrapped Bitcoin (WBTC), and DAIv1. The loans appeared legitimate within the protocol’s logic because the collateral valuation and borrowing limits were derived from the compromised oracle feed. The attacker subsequently moved to extract value, bridging approximately $1.92 million to Ethereum mainnet, a sum comprising 234.57 ETH and 1.3 million DAI.

    Protocol Pauses Operations Amid Investigation; Total Loss Still Unclear

    In response to the breach, Nostra has enacted a comprehensive safety pause, halting all lending, borrowing, withdrawals, and liquidations while the team investigates the oracle manipulation vector. The protocol emphasized that the $3.5 million borrowed does not represent the final loss figure, as impact assessments and potential recovery efforts are ongoing. The exact technical method used to compromise the oracle has not yet been disclosed.

    Wave of Exploits Highlights Systemic Vulnerabilities Across CeFi and DeFi

    The Nostra incident does not exist in isolation. It coincides with a cluster of high-profile security failures over the past two weeks, signaling a broad threat landscape. Revolut, a major fintech player, fell victim to a sophisticated phishing attack initiated by a fraudulent government request that bypassed internal security checks. Term Finance suffered an exploit targeting weaknesses in its DAO governance structure, while Liquid Network experienced a software flaw that allowed attackers to generate approximately 4,000 BTC illicitly. These cases span centralized finance, decentralized governance, and sidechain infrastructure, demonstrating that attack vectors are diversifying across the entire crypto stack.

    Why This Matters: Escalating Losses Define 2026 Security Landscape

    Data from DeFiLlama underscores the severity of the current environment. Crypto security losses in the first half of 2026 have already reached $1.1 billion across more than 212 on-chain incidents. The month of April alone accounted for over $600 million in losses, driven primarily by the KelpDAO and Drift Protocol exploits. Ethereum recorded the highest chain-specific losses at $332 million, followed closely by Solana at $326 million. Zooming out to the trailing 12 months, total value hacked stands at approximately $2.101 billion, with DeFi protocols bearing the brunt at $1.353 billion and cross-chain bridges accounting for a further $758.96 million. The Nostra exploit on Starknet adds another data point to the mounting evidence that oracle integrity and cross-chain bridging remain critical systemic weak points.

    Frequently Asked Questions

    How did the attacker exploit Nostra’s lending market on Starknet?

    The attacker manipulated the price feed oracle for the NSTR token, causing it to report an artificially inflated value. This allowed the attacker to deposit NSTR as collateral that appeared more valuable than it was, enabling them to borrow approximately $3.5 million in various assets (ETH, STRK, USDC, USDT, WBTC, DAIv1) against the overvalued collateral.

    What actions has Nostra taken following the exploit?

    Nostra has paused all lending, borrowing, withdrawals, and liquidations as a safety measure while investigating the oracle manipulation. The team is currently assessing the total impact and exploring potential recovery options. The exact technical method of the oracle compromise has not yet been disclosed.

    What are the broader crypto security trends for 2026 based on DeFiLlama data?

    In the first half of 2026, crypto exploits have resulted in $1.1 billion in losses across 212+ incidents. Ethereum ($332M) and Solana ($326M) lead in chain-specific losses. Over the past year, total losses reach $2.101 billion, with DeFi protocols accounting for $1.353 billion and cross-chain bridges for $758.96 million, highlighting persistent vulnerabilities in decentralized finance infrastructure and interoperability layers.

  • Uniswap Extends DEX Lead as Volume Tops $70 Billion

    Uniswap Extends DEX Lead as Volume Tops $70 Billion

    Uniswap processed over $70 billion in trading volume during the 30‑day period ending September 13, surpassing the combined volume of the next three largest decentralized exchanges according to DeFiLlama Research data cited by the protocol. The milestone reflects activity across Uniswap v2, v3 and v4 on all supported blockchains and does not represent revenue earned by Uniswap Labs or the market value of the $UNI governance token.

    Uniswap has processed $70B+ in volume over the past monthMore than the next three DEXs combinedThe world’s value moves on 🦄 pic.twitter.com/ak426mmX1x
    — Uniswap (@Uniswap) September 12, 2026

    Uniswap v4 and v3 drive the bulk of volume

    DeFiLlama’s Uniswap v4 page showed nearly $38 billion in trading volume over the preceding 30 days when accessed on September 13, while the analytics platform attributed roughly $32 billion to Uniswap v3 over a similar period. Uniswap v2 contributed more than $1.2 billion, pushing the combined three‑version total above the $70 billion figure cited by the protocol. Minor discrepancies between the version‑level sum and Uniswap’s published number can arise from smaller deployments or differences in data‑update timing.

    Volume measures the dollar value of swaps executed by the protocol; it does not indicate trader profits, liquidity‑provider returns, or revenue flowing to $UNI holders. Each trade generates fees for liquidity providers, and selected pools direct a portion of those fees to the protocol under governance‑approved settings. Uniswap v3 remains active because it allows liquidity providers to concentrate capital within chosen price ranges, while version 4 employs a shared contract architecture with programmable hooks that let developers add customized pool functions. Recent growth has moved v4 ahead of v3 in the current monthly snapshot, though both versions continue to serve different pools, assets and integrations.

    Volume spans dozens of blockchain networks

    Uniswap’s aggregate volume covers deployments on Ethereum and numerous scaling networks. DeFiLlama lists v3 contracts on more than 40 chains, with Ethereum accounting for the largest share of the version’s locked liquidity. Activity from Base, Arbitrum, BNB Chain, Polygon, OP Mainnet and Robinhood Chain all contribute to the combined protocol figures. Each deployment processes swaps through its own pools, while analytics providers group the results under the Uniswap protocol.

    Robinhood Chain emerges as a notable contributor

    Robinhood Chain has recently become a significant source of Uniswap activity. As reported by crypto.news, the network reached approximately $945 million in daily DEX volume on August 25, with Uniswap serving as its primary public automated market maker. DeFiLlama’s September 13 snapshot showed Robinhood Chain processing roughly $1.35 billion in total DEX volume over 24 hours and $12.19 billion over seven days. Uniswap accounted for about $262 million of the chain’s daily volume and close to $4 billion of its seven‑day total at the time of measurement. Uniswap Labs launched v2, v3, v4 and UniswapX on Robinhood Chain in July, integrating the protocol into the Uniswap web app, wallet and API from the network’s first day of public operation.

    On Ethereum, DeFiLlama recorded approximately $681 million in total DEX trading over the latest 24‑hour period and $8.5 billion over seven days. Uniswap competes there with Curve, PancakeSwap, SushiSwap and other automated exchanges.

    Competitor comparison is a moving snapshot

    Uniswap stated that its monthly volume exceeded the next three DEXs combined but did not name the three competitors in its announcement. Rankings can vary depending on whether an analytics provider groups protocol versions, counts only spot swaps, or combines activity across supported chains. DeFiLlama defines DEX volume as the value of spot token swaps processed by a protocol; perpetual futures trading is presented separately, preventing derivatives‑focused venues from being mixed with spot exchanges in the same metric.

    Competition within the DEX sector has shifted over time. Raydium surpassed Uniswap in one monthly comparison during January 2025, while PancakeSwap held a higher 30‑day total during parts of that year. The latest data cited by Uniswap places the protocol back at the top of the selected spot‑DEX ranking. An earlier monthly record offers additional context: crypto.news reported in November 2024 that Uniswap reached $38 billion across Ethereum scaling networks. The current figure is more than 80 % above that total, though the two measurements cover different dates and may not include an identical set of chains and protocol versions. Uniswap’s competitor comparison should therefore be read as a trailing‑period snapshot verifiable only against the methodology, protocol groupings and timestamp used for the underlying ranking.

    Protocol fees link volume to $UNI supply

    Uniswap governance approved a fee mechanism that directs a portion of trading charges from selected pools to the protocol. The settings do not cover every pool or every dollar of reported volume, so monthly trading volume cannot be multiplied by a single fee rate to calculate protocol revenue. In July, Governance Proposal 100 expanded the mechanism to v4 pools across seven networks. Crypto.news reported that the change raised Uniswap’s measured daily protocol revenue from approximately $114,000 to $325,000 at the time.

    Captured fees are routed through TokenJar contracts and can fund $UNI purchases and token burns under the governance system. Liquidity providers continue to receive the portion assigned to them under each pool’s settings. Uniswap Labs has continued expanding products connected to the protocol’s liquidity. A June agreement brought $150 million in Spark stablecoin liquidity to v4, with plans to move the assets into a programmable DualPool hook developed with Uniswap Labs. Spark’s design places idle stablecoins in yield‑bearing vaults between trades and moves the required capital into a v4 pool when a swap occurs. Uniswap said USDS would serve as the first quote asset, with support planned for USDT and PYUSD liquidity.

    $UNI price action

    $UNI traded near $6.21 during the latest market session, down roughly 2 % from the previous close. The token moved between approximately $6.17 and $6.55 during the day, with no verified evidence connecting the price decline to Uniswap’s monthly volume announcement.

  • Venice Posts Record $1.1M Quarterly Earnings—Why Is VVV Down 13%?

    Venice Posts Record $1.1M Quarterly Earnings—Why Is VVV Down 13%?

    Venice Token ($VVV) fell 13% to $16.03 at press time, even as its protocol-level performance continued to improve.

    Data from DeFiLlama showed record quarterly earnings of $1.1 million, while monthly earnings also reached a record $654,000. The increase suggested that platform activity and usage had grown despite recent market turmoil.

    However, stronger protocol performance had not yet translated into price support for $VVV. The divergence raised questions about whether Venice Token was entering a bearish phase and which traders were driving the decline.

    Are derivatives traders pressuring $VVV?

    Venice Token’s perpetual market showed the clearest signs of weakening trader sentiment. The funding rate fell from 0.0141% on August 28 to 0.0001% at press time.

    The funding rate remained marginally positive, meaning the decline pointed to weakening demand from long traders rather than confirmed dominance by short sellers.

    CoinGlass data also showed that $VVV’s long/short ratio fell to 0.86. A reading below one indicates that short accounts outnumber long accounts in the measured market.

    Together, the funding rate and long/short ratio pointed to a weaker derivatives bias. Continued short positioning could keep pressure on the Venice Token price.

    Are spot traders buying Venice Token?

    In contrast, $VVV’s spot market netflow remained negative during recent sessions. Approximately $267,000 left centralized exchanges over a 12-hour period, while negative netflows had persisted for three days.

    These outflows could indicate that holders were withdrawing $VVV from exchanges, reducing the supply immediately available for selling. However, negative netflows alone cannot confirm fresh buying or long-term accumulation.

    Venice Token therefore faced a clear market split. Derivatives traders leaned bearish, while spot outflows suggested that exchange-held supply was tightening.

    If spot accumulation continues, $VVV could attempt a near-term recovery. Persistent derivatives pressure, however, could delay that move despite Venice Token’s record earnings.

    Venice Token market outlook

    Venice Token fell 13% to $16.03 despite recording $1.1 million in quarterly earnings. Its funding rate dropped sharply but remained marginally positive, signaling weaker long demand rather than confirmed short dominance.

    Source: cryptonews.net

  • Tokenized Assets Are More Active Than the Data Shows

    Tokenized Assets Are More Active Than the Data Shows

    Estimates of how much tokenized real-world assets (RWAs) are actually being used in decentralized finance (DeFi) range from less than 1% to 7%, 11.7% and nearly 20%. All of these figures were published this year, and each can be defended. The problem is that they do not measure the same thing.

    The lowest estimate receives the most attention. Of the roughly $51 billion in tokenized real-world assets on public blockchains, it suggests that only a single-digit percentage is actively used. The figure is often cited as evidence that onchain finance remains a toy: a great deal of tokenized “value,” but very little of it operating in public markets.

    That criticism is not without merit. An asset that moves onchain, incurs transaction fees and gains no additional utility is a worse product than the traditional asset it replicates. However, the statistic used to support that criticism is nearly meaningless—not because the percentage is too low, but because both sides of the calculation are misleading.

    Where tokenized RWA utilization figures come from

    The sub-1% estimate covers only three tokenized money market funds, rather than the broader market. BlackRock’s BUIDL, Circle’s USYC and Franklin Templeton’s iBENJI hold a combined $7.2 billion and have approximately $50 million deployed.

    Expanding the sample produces a utilization rate of 11.7% according to DeFiLlama. Using CoinShares’ $7.4 billion second-quarter estimate against RWA.xyz’s $38 billion total produces a figure of about 19%. The resulting 20-fold gap reflects the lack of agreement over what should be measured, not necessarily a change in the underlying market.

    Why the denominator distorts the calculation

    According to Bernstein research, private credit accounts for approximately 47% of the $51 billion in tokenized real-world assets onchain. Private credit also tends to move infrequently in traditional finance. Tokenization does not change its redemption schedule or its holder base.

    Including private credit in the denominator of a metric intended to measure composability is therefore a category error rather than evidence of disappointing adoption. A meaningful assessment of DeFi usage must distinguish between assets designed for frequent onchain activity and assets whose underlying structure makes limited movement normal.