Tag: cryptocurrency rally

  • Bitcoin Price Gains 44% for Second-Best Q3 as Ethereum Jumps 71%

    Bitcoin Price Gains 44% for Second-Best Q3 as Ethereum Jumps 71%

    Key Highlights

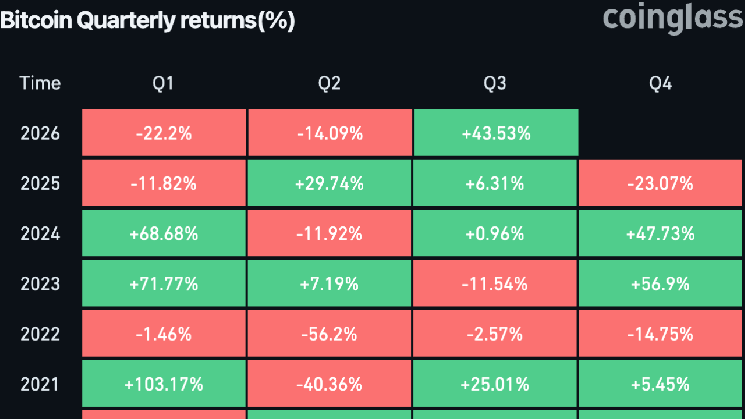
    • Bitcoin surged approximately 43.5% in Q3 2026, rising from roughly $58,500 to around $84,000, marking its second-best third quarter on record behind only the 80.4% gain in 2017.
    • Ethereum outperformed with a 71% quarterly advance, surpassing its previous Q3 record of 66.5% set in 2025 and establishing its strongest summer rally ever.
    • Both assets cleared key technical hurdles including the September 25 quarterly options expiry, with Bitcoin reclaiming critical investor cost-basis levels and showing strengthened ETF demand alongside restrained profit-taking.

    Bitcoin and Ethereum Break Historical Q3 Patterns

    Cryptocurrency markets have transformed what is typically one of the calendar’s quieter quarters into one of the strongest periods in digital asset history. Bitcoin’s price has gained roughly 43.5% during Q3 2026, climbing from about $58,500 at the quarter’s start to approximately $84,000 as of September 26. This performance puts the quarter on track to become Bitcoin’s second-best Q3 ever, trailing only the approximately 80.4% surge recorded in 2017.

    Ethereum has delivered an even more remarkable showing. According to Coinglass data, ETH has risen 71% this quarter, exceeding its previous Q3 record of about 66.5% set in 2025. The move marks Ethereum’s strongest summer rally on record, defying the historical pattern where July, August, and September often produce flat or modest returns compared with typically stronger fourth-quarter periods.

    Analysts Call Performance Extraordinary

    The combination of both major assets posting historic quarterly gains simultaneously has drawn significant attention from market observers. Crypto analyst Luciano described the developments as extraordinary, writing on X that this is the 2nd best quarter ever recorded for BTC and the best quarter $ETH has ever had. The significance extends beyond raw percentage gains, as both assets enter the final stretch of September with established momentum ahead of a quarter that has historically attracted greater speculative interest.

    Bitcoin Clears Technical Hurdles and Cost Bases

    The rally’s foundation appears to rest on more than derivatives speculation alone. Bitcoin has moved back above several investor cost-basis levels that previously capped recovery attempts. Exchange-traded fund demand has strengthened, spot trading volume has increased, and profit-taking remains relatively restrained compared with previous market peaks.

    Bitcoin’s price also held firm through the large September 25 quarterly options expiry, an event carrying substantial open interest that had the potential to generate significant short-term volatility. With that hurdle now behind the market, attention is shifting toward the next major onchain resistance level near the mean MVRV price around $96,700. A move toward that zone would again place Bitcoin within striking distance of the psychological $100,000 level.

    Why This Matters

    The historic Q3 performance fundamentally alters the setup for what has traditionally been cryptocurrency’s strongest seasonal quarter. Q4 has historically outperformed Q3 for digital assets, and the current momentum—combined with stronger ETF demand, improving spot market activity, and lighter profit-taking than at prior peaks—creates a potentially powerful launching pad. However, the immediate test centers on whether buyers can continue absorbing supply as Bitcoin trades in the mid-$80,000 range. If demand sustains, what is already a historic third quarter could become the foundation for an even more consequential fourth quarter, potentially accelerating institutional adoption narratives and broader market participation.

    Frequently Asked Questions

    How does Bitcoin’s Q3 2026 performance compare historically?

    Bitcoin’s approximately 43.5% gain in Q3 2026 represents its second-best third quarter on record, behind only the 80.4% surge in Q3 2017. It also marks Bitcoin’s best Q3 performance since 2013.

    What records did Ethereum set this quarter?

    Ethereum’s 71% quarterly advance surpassed its previous Q3 record of 66.5% set in 2025, establishing its strongest summer rally on record according to Coinglass data.

    What technical levels are traders watching next for Bitcoin?

    The next major onchain resistance sits near the mean MVRV price around $96,700. A move toward that level would bring Bitcoin back within striking distance of the psychologically significant $100,000 threshold.


  • DoubleZero Surges 29% as Open Interest Jumps 113% – Can 2Z Outpace $124M Token Unlock?

    DoubleZero Surges 29% as Open Interest Jumps 113% – Can 2Z Outpace $124M Token Unlock?

    Key Highlights

    • DoubleZero (2Z) surged over 29% in 24 hours, leading all top 200 cryptocurrencies by market capitalization amid a broader market rebound.
    • Technical indicators confirm bullish momentum: price cleared key liquidity above $0.075, CVD shows 19.57 million tokens bought at press time, and Open Interest jumped 113% alongside a 107% volume spike past $50 million.
    • Major token unlock looms on October 2nd: 1.77 billion 2Z tokens ($124 million, 17.79% of max supply) will enter circulation, potentially capping the uptrend that began September 16.

    DoubleZero Leads Market Recovery With 29% Intraday Rally

    DoubleZero (2Z) emerged as the standout performer across the top 200 digital assets by market capitalization over the past 24 hours, posting a gain exceeding 29% as the broader cryptocurrency market staged a rebound. The altcoin’s ascent pushed it decisively past the $0.075 resistance level, clearing liquidity clusters that had previously capped advances near the $0.060 equal highs. On-chain and derivatives data point to aggressive accumulation rather than speculative churn, with cumulative volume delta (CVD) metrics recording 19.57 million 2Z tokens purchased during the peak trading hour at press time. The Stochastic Momentum Index (SMI) on the daily timeframe registered near maximum levels, reinforcing the strength of the current up-move.

    Derivatives Data Signals Leveraged Long Positioning

    The rally’s structure is underpinned by a pronounced shift in derivatives markets. Open Interest on 2Z futures contracts surged 113%, while spot and perpetual trading volume climbed 107% to surpass $50 million at the time of writing, according to CoinGlass data. Notably, cumulative long liquidation leverage stood at $2 million versus just $955,000 in short orders, indicating that the price advance has been fueled by fresh long exposure rather than a short squeeze. This dynamic suggests conviction among leveraged participants, though it also introduces vulnerability should funding rates overheat or price action reverse sharply.

    Institutional Wallet Flows Reveal Accumulation Patterns

    Blockchain analytics from Arkham Intelligence highlight coordinated movement among major custodians and market makers. Fireblocks transferred 1.452 million 2Z tokens—valued at approximately $102,000—to a BtcTurk cold storage wallet, a transaction consistent with institutional accumulation. Simultaneously, Binance and Wintermute executed inter-wallet transfers, with Wintermute routing 1.113 million tokens to a Bybit hot wallet, likely for liquidity provisioning. South Korean exchange Upbit moved over 14 million 2Z (worth more than $800,000) across its internal hot wallet infrastructure, activity the data suggests is related to position management rather than distribution. Absent a coordinated selling effort by these entities, the technical backdrop remains supportive of further upside.

    October Token Unlock Presents Critical Supply Overhang

    The most significant risk to the current uptrend arrives on October 2nd, when the protocol’s vesting schedule releases 1.77 billion 2Z tokens—representing 17.79% of the maximum supply and valued at roughly $124 million at current prices. According to CoinMarketCap, this event will lift the circulating supply to 51%, up from a locked position exceeding 65% today. The bulk of the unlocking allocation is earmarked for early backers including Jump Crypto and Malbec Labs, alongside other institutional contributors. Market participants will closely monitor whether these stakeholders opt to hold, stake, or liquidate their newly liquid positions, as the resulting sell pressure could arrest the advance that has been in place since the September 16 trendline break.

    Why This Matters

    DoubleZero’s rally illustrates how mid-cap altcoins can decouple from broader market beta when derivatives positioning and institutional flow align. The convergence of technical breakout confirmation, rising Open Interest, and identifiable accumulator wallets provides a textbook case study in on-chain forensic analysis for traders. However, the impending token unlock represents a classic supply-side catalyst that has historically capped rallies in similarly structured vesting schedules. The October 2nd event will test whether demand from new market entrants and existing holders can absorb what amounts to nearly one-fifth of the token’s maximum supply entering free float within a single day. For the sector, the outcome may signal appetite for infrastructure-layer tokens with concentrated insider holdings—a dynamic relevant to numerous Layer 1 and DePin projects facing similar unlock cliffs in Q4 2024 and beyond.

    Frequently Asked Questions

    What are the key price levels to watch for 2Z following the breakout?

    Immediate resistance targets sit at $0.095 and $0.120, contingent on the price holding above the $0.075 breakout level. The primary downside invalidation zone is $0.050, which marks the trendline break origin from September 16.

    How large is the October 2nd token unlock relative to current circulation?

    The unlock will release 1.77 billion 2Z tokens ($124 million), equivalent to 17.79% of the maximum supply. This will increase the circulating supply to 51% from a current locked ratio exceeding 65%, with the majority allocated to Jump Crypto, Malbec Labs, and other institutional contributors.

    Are institutions buying or selling 2Z based on recent wallet activity?

    Recent on-chain flows suggest accumulation and liquidity management rather than distribution. Fireblocks moved tokens to a BtcTurk cold wallet, Wintermute transferred to Bybit for likely market-making purposes, and Upbit conducted internal wallet rotations. No major exchange deposit spikes indicative of selling pressure have been observed at press time.

  • SUI Jumps 16% as Volume Nears $1.7B; Traders Eye $2 Target If Conditions Hold

    SUI Jumps 16% as Volume Nears $1.7B; Traders Eye $2 Target If Conditions Hold

    Key Highlights

    • SUI token surged 16.59% in a single session as trading volume nearly doubled to $1.73 billion, signaling strong capital inflow behind the price recovery.
    • On-chain metrics remained robust with 125,038 active addresses, 12,551 new addresses, and 41.44 million transactions processed in 24 hours, while Total Value Locked held firm at $551.65 million.
    • Technical breakout above a prolonged descending channel, confirmed by Parabolic SAR flip and bullish DMI structure, opens path toward $1.3295 resistance with $2.00 as a potential extended target.

    SUI Token Stages 16.59% Rally on Doubled Volume and Surging Network Activity

    The SUI token delivered a sharp 16.59% daily price gain as trading activity nearly doubled, providing substantial market participation behind the recovery move. According to market data, the token’s trading volume expanded 94.28% to reach $1.73 billion, almost doubling alongside the price advance. This volume surge attracted significantly greater market participation than the previous session, reinforcing the relevance of SUI’s price rebound from its wider declining technical structure. The token drew substantially more capital turnover as prices recovered rather than advancing on thin activity, though the rapid uptick brought prices toward a crucial technical zone where sustained participation will be essential for further upside.

    On-Chain Metrics Provide Fundamental Backing for Price Recovery

    Beyond trading markets, the Sui network recorded considerable usage during the recent 24-hour period, adding an on-chain dimension to the rally. According to DeFiLlama analytics, AAVE’s Active Addresses on Sui hit 125,038, with the network adding 12,551 new addresses within the 24-hour window. Transaction activity provided another strong indicator, with Sui processing 41.44 million transactions over the same period. These figures suggest network participation remained exceptionally active as SUI recorded its double-digit price recovery. The address increase gave the rally an on-chain element beyond expanding trading volume, while new addresses reflected fresh traders interacting with the network during the rally period. Expanded transaction activity indicated existing users continued generating considerable on-chain activity, creating potential for stronger fundamental backing as SUI attempts to extend its recovery.

    DeFi Liquidity Holds Firm as TVL Climbs to $551.65 Million

    The Sui DeFi ecosystem preserved considerable liquidity as prices pushed higher, with Total Value Locked (TVL) climbing to $551.65 million following a modest 0.34% increase over 24 hours. Despite the modest percentage gain, the key takeaway is that ecosystem liquidity did not contract even as speculative market activity expanded rapidly. This distinction matters because a falling TVL could have weakened the fundamental outlook beneath SUI’s recovery. Instead, capital locked across Sui DeFi remained firm as both network and trading activity strengthened. The rally emerged alongside stable ecosystem liquidity rather than a noticeable withdrawal of DeFi capital. Continued TVL growth could validate this backdrop if prices continue pushing higher, though price expansion significantly outpaced the daily TVL increase, leaving technical confirmation increasingly crucial for sustained upside.

    Technical Breakout Above Descending Channel Targets $1.3295 Resistance

    On a weekly timeframe chart, SUI strengthened its technical structure after breaking above its extended descending channel during the recent price recovery. The breakout followed a price reversal from the $0.6578 support region, marking an important shift in the token’s wider price structure. Adding further support to the bullish setup, the Parabolic SAR indicator flipped below the prevailing price near $0.5597. The Directional Movement Index (DMI) structure also favored buyers, with the +DI at 30.40 positioned above the -DI signal at 14.70. The Average Directional Index (ADX) strength indicator reached 20.75, leaving room for directional strength to expand as the price breakout developed. SUI now needs to protect its position above the broken descending channel. Ultimately, the token’s price breakout gained backing from stronger trading activity, elevated network usage, and firm DeFi liquidity. If bulls defend the channel breakout, the $1.3295 resistance could become the next test before a possible move toward $2.00.

    Why This Matters

    The convergence of rising trading volume, robust on-chain activity, and stable DeFi liquidity represents a rare multi-factor confirmation for a layer-1 token recovery. Most rallies in the current market environment are driven by either speculative futures flows or isolated fundamental improvements, but rarely both simultaneously. SUI’s ability to generate 41.44 million daily transactions while adding over 12,000 new addresses suggests genuine network adoption is occurring alongside price appreciation. The TVL stability at $551.65 million is particularly noteworthy given that many competing ecosystems have seen capital rotation out of DeFi during volatile periods. From a technical perspective, the weekly descending channel breakout combined with the Parabolic SAR flip and bullish DMI alignment creates a coherent structure that could attract trend-following capital. The $1.3295 level represents the next significant horizontal resistance, and a weekly close above it would likely trigger algorithmic and systematic buying interest toward the $2.00 psychological level.

    Frequently Asked Questions

    What drove SUI’s 16.59% daily price gain?
    The surge was driven by a 94.28% increase in trading volume to $1.73 billion, supported by strong on-chain metrics including 125,038 active addresses, 12,551 new addresses, and 41.44 million daily transactions, alongside stable DeFi TVL at $551.65 million.
    What are the key technical levels to watch for SUI?
    Immediate resistance sits at $1.3295 following the descending channel breakout. The Parabolic SAR flipped bullish near $0.5597, and the token reversed from $0.6578 support. A sustained move above $1.3295 could open a path toward $2.00.
    Is the rally supported by fundamentals or just speculation?
    Both. The rally coincides with expanding network usage (41.44M transactions, rising active/new addresses) and stable DeFi liquidity (TVL at $551.65M), suggesting fundamental activity underpins the speculative volume surge.