Key Highlights
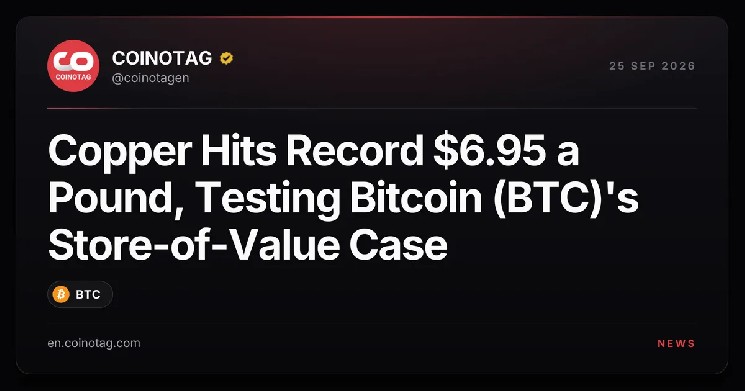
- Copper futures reached an all-time high of $6.95 per pound on September 22, 2026, rising roughly 20% year-to-date and more than 46% over the trailing twelve months, while gold remained essentially flat at +0.02% over the same period.
- Physical copper inventories have plunged to multi-year lows, with Shanghai warehouse stocks dropping to 43,900 tonnes (lowest since 2023) and LME available stocks falling to 133,725 tonnes, creating a structural supply squeeze amid surging AI-driven demand.
- Investor Michael Burry has placed a concentrated bet on a copper miner rather than AI equities, citing an 18-year mine development cycle versus a two-to-three-year horizon for AI data center demand, while markets await a pending U.S. Commerce Department tariff ruling on refined copper imports.
Copper’s Record Rally Defies Traditional Commodity Logic
Copper futures printed a fresh all-time high of $6.95 per pound on September 22, capping a year in which the industrial metal and gold have moved in strikingly opposite directions. The six-month chart shows copper up approximately 20% in 2026, positioning it for one of its strongest annual performances on record, while the trailing twelve-month gain widens to more than 46%. Gold, by contrast, has added just 0.02% over the same stretch — a flat line that conceals a wilder ride beneath it. Bullion climbed past $5,600 per ounce in late January 2026 on safe-haven flows, crashed within days, and has spent the months since clawing its way back toward flat. Copper absorbed a shock of its own in September, when a stalled U.S. tariff plan briefly stripped almost 8% from the price, but the metal erased that pullback and pressed on to fresh records.
Physical Market Tightness Drives Structural Repricing
The physical numbers behind the squeeze are striking. Shanghai warehouse stocks of copper cathode — the refined form traded against exchange contracts — dropped to 43,900 tonnes, its lowest reading since 2023. London Metal Exchange stocks available to the market slipped to 133,725 tonnes, a drawdown severe enough to reshape pricing across the commodity complex, from crude oil (WTI) through industrial metals. Exchange-warehouse levels matter because they measure metal actually available for delivery rather than paper claims; when registered stock thins, nearby contract prices decouple from longer-dated ones. On the demand side, artificial intelligence is the new engine. Michael Burry spelled out the asymmetry last week: bringing a new copper deposit into production takes roughly 18 years, while data centers built for AI add fresh demand on a two-to-three-year horizon. That timing gap, he argued, was central to his choice of a copper miner over AI-linked equities — from chipmakers to enterprise-hardware names such as HP Enterprise — a concentrated single-stock position in the classic whale mold. Producers cannot respond quickly, because mine development cycles stretch across decades — precisely the constraint Burry flagged.
Policy Catalyst Looms Over Next Price Move
The next catalyst now sits in Washington. The Commerce Department’s long-delayed tariff ruling on refined copper imports remains pending, and traders expect the decision to move prices sharply once it lands. Gold, by contrast, still wins on sheer size: the metal’s outstanding stock is worth roughly $30 trillion, and central banks continue to hold it as a reserve asset — a monetary role copper, whatever its 2026 momentum, does not share. For investors whose scarce-asset exposure runs through vehicles such as the S&P 500 ETF, the 2026 divergence suggests the market is repricing what counts as scarce across asset classes. Readers tracking the market in real time can follow live spot and futures prices on Bybit.
Why This Matters
The copper-gold divergence reflects a deeper shift in how markets value scarcity. Copper’s rally is rooted in tangible industrial consumption — wiring, power grids, and electronics — with AI data center construction creating a demand surge that mine supply cannot match on any relevant timeline. Gold’s monetary role and $30 trillion outstanding stock provide a fundamentally different backing. Meanwhile, Bitcoin (BTC), trading near $84K at press time (spot $84,294), rests its store-of-value case on a fixed 21 million coin supply. Investors weighing exposure across these assets are effectively choosing between monetary scarcity (gold, Bitcoin) and industrial scarcity (copper). Copper’s rally does not dethrone Bitcoin or gold, but it confirms that hard-cap narratives are no longer crypto’s monopoly. The pending U.S. tariff decision on refined copper imports represents the nearest-term policy risk, with potential to accelerate or disrupt the current price trajectory.
Frequently Asked Questions
- Why is copper outperforming gold in 2026?
- Copper’s gains are driven by a structural supply deficit — warehouse inventories at multi-year lows — colliding with accelerating industrial demand from AI data center construction. Gold lacks this industrial demand tailwind and has traded flat despite safe-haven flows earlier in the year.
- What is Michael Burry’s copper thesis?
- Burry has taken a concentrated position in a copper miner based on the asymmetry between an 18-year mine development cycle and a two-to-three-year horizon for AI-driven copper demand. He chose this over direct AI equity exposure to chipmakers or hardware firms such as HP Enterprise.
- What catalyst could move copper prices next?
- The U.S. Commerce Department’s pending tariff ruling on refined copper imports is the key near-term catalyst. Traders expect a sharp price reaction once the decision is announced, given current tight physical inventories.