Tag: CoinGlass

  • Bitcoin Hits $85,000 as Short Squeeze Liquidates $648 Million in Bearish Bets

    Bitcoin Hits $85,000 as Short Squeeze Liquidates $648 Million in Bearish Bets

    Key Highlights

    • Bitcoin surged 5.4% to $84,984, breaking decisively above the September range high of $82,284 set on Sept. 4.
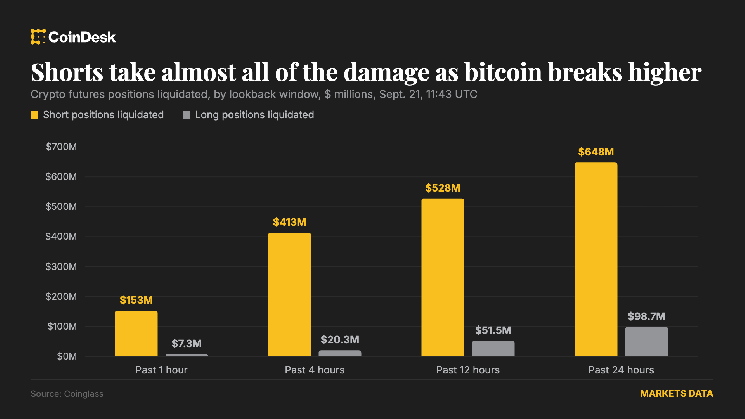
    • The rally was fueled primarily by a massive short squeeze, with $746 million in positions liquidated over 24 hours—$647.9 million of them shorts.
    • Open interest rose 7.59% to $156 billion and volume jumped 39% to $224 billion, indicating traders are re-establishing positions rather than exiting the market.

    Bitcoin Breaks September Resistance on Heavy Short Liquidations

    Bitcoin BTC extended its breakout above the top of its September trading range on Monday, changing hands at $84,984 during the late European morning session. The move represents a 5.4% gain over the prior 24 hours and leaves the asset well clear of the $82,284 high recorded on Sept. 4, which had previously capped upside attempts throughout the month.

    Forced Buying Drives Momentum Rather Than Fresh Conviction

    According to market analysts and data from Coinglass, the rally is being propelled predominantly by forced buying stemming from a cascading short squeeze rather than an influx of new long-side conviction. Over the past 24 hours, $746 million in total positions were liquidated, of which $647.9 million were short positions. In the most recent hour alone, an additional $159.9 million in positions were wiped out, with 95% of those liquidations on the short side.

    Bitcoin shorts accounted for $277.5 million of the 24-hour liquidation total, while Ether (ETH) shorts contributed $122.8 million. The disproportionate short-side washout underscores a market that was heavily positioned for downside or range-bound price action, leaving bears vulnerable to a sharp upside repricing.

    Open Interest and Volume Signal Position Replenishment

    Despite the massive short covering, open interest across the market has risen 7.59% to $156 billion, and 24-hour trading volume has surged 39% to $224 billion. This combination—rising open interest alongside heavy liquidations—suggests that traders are actively replacing the positions being closed out rather than stepping back from the market. The data points to a structural repositioning, with new participants or existing players re-entering on the long side as the breakout confirms.

    Why This Matters

    The break above the September range high marks a technically significant development for Bitcoin, which had been consolidating in a relatively tight band for weeks. The fact that the move was catalyzed by a short squeeze rather than organic spot buying introduces a degree of fragility: if the forced buying exhausts itself without follow-through from spot accumulators, a pullback toward the former resistance—now potential support—around $82,000 could materialize. However, the concurrent expansion in open interest and volume suggests the market is not merely covering shorts but rebuilding directional exposure. Traders will be watching closely for sustained spot bid interest, funding rate normalization, and whether the $85,000 level can flip to support in the coming sessions. The next key technical hurdle lies near the late-July highs around $87,500–$88,000.

    Frequently Asked Questions

    What triggered Bitcoin’s break above the September range?

    The breakout was driven primarily by a massive short squeeze, with $746 million in positions liquidated over 24 hours—$647.9 million of them shorts—forcing bearish traders to buy back positions and accelerating upside momentum.

    Does rising open interest during a short squeeze signal bullish continuation?

    Yes. The 7.59% increase in open interest to $156 billion, combined with a 39% volume surge to $224 billion, indicates traders are replacing liquidated shorts with new long positions rather than exiting the market, suggesting conviction behind the move.

    What are the key levels to watch after this breakout?

    Immediate support now sits at the former September high of $82,284. Upside targets include the late-July highs near $87,500–$88,000. Sustained spot buying and funding rate normalization will be critical for follow-through.


  • Why AVAX’s Rally Must Pass This ‘Structural Test’ on the Charts

    Why AVAX’s Rally Must Pass This ‘Structural Test’ on the Charts

    Key Highlights

    • Avalanche (AVAX) posted a double-digit daily surge exceeding 12%, but a 1-month Liquidation Heatmap from CoinGlass reveals limited upside liquidity clusters above current price levels.
    • Multiple deep downward liquidity clusters below the press-time price create magnetic pull toward lower levels, making the rally vulnerable without sustained momentum.
    • Accumulation/Distribution data shows heavy buying volume at 122 million, yet the Aroon Indicator on TradingView signals only weak bullish conviction with minimal separation between Aroon Up and Aroon Down lines.

    AVAX Rally Faces Liquidity Headwinds Despite Double-Digit Gains

    Avalanche (AVAX) has recently displayed clear bullish tendencies, recording a daily price surge of more than 12%. However, technical analysis derived from the 1-month Liquidation Heatmap on CoinGlass casts doubt on the sustainability of this uptrend. The heatmap indicates a near absence of upside liquidity clusters above the current market price, while simultaneously revealing multiple high-depth clusters positioned below it. In derivatives markets, these clusters represent concentrations of unfilled orders that frequently act as magnets, drawing price action toward them.

    Downside Magnetic Pull Threatens Recent Gains

    The structural imbalance in liquidity creates two divergent scenarios for AVAX. With limited to no upside clusters, further appreciation would depend almost entirely on continued momentum and aggressive buying pressure. Conversely, the pronounced downward clusters exert gravitational pull, increasing the probability that price could be drawn lower and erase the recent gains. This dynamic leaves the current rally in a fragile state, where the path of least resistance may be to the downside unless fresh catalysts emerge.

    Accumulation Surges but Trend Confirmation Remains Weak

    On-chain and volume data paint a mixed picture. The Accumulation/Distribution Indicator (A/D) on TradingView shows massive buying activity, with volume-weighted purchases hitting 122 million. Elevated accumulation typically signals positive investor sentiment and near-term bullish expectations. However, the Aroon Indicator—which plots Aroon Up (orange) and Aroon Down (blue) to gauge directional bias—confirms only a marginal bullish tilt. Aroon Up sits above Aroon Down, yet the gap between the two lines is minimal. A robust bullish confirmation would typically require Aroon Up at 100% and Aroon Down at 0%, a threshold not currently met.

    Structural Resistance at the Lower High

    Price action analysis highlights a critical technical hurdle: the lower high formed during prior weeks’ bearish leg. For the bullish structure to gain credibility, AVAX must achieve a decisive daily close above this level. Such a close would invalidate the recent downtrend and neutralize the structural lower high. Until that occurs, the market lacks a clear directional signal, and the risk of a reversion toward the deep liquidity clusters below remains elevated.

    Why This Matters

    The interplay between liquidity topology and momentum indicators underscores a recurring theme in altcoin markets: sharp, news-driven or sentiment-driven spikes often lack the structural scaffolding—specifically, stacked upside liquidity—to sustain advances. For AVAX, the 12% daily gain, while notable, has not yet been accompanied by the order-book architecture or trend-strength metrics that typically underpin durable uptrends. Traders and investors monitoring CoinGlass heatmaps and TradingView oscillators should watch for a daily close above the lower high as the primary confirmation signal; absent that, the probability favors a drift toward the high-density liquidity zones below current price.

    Frequently Asked Questions

    What does the CoinGlass Liquidation Heatmap show for AVAX?

    The 1-month heatmap reveals limited to no upside liquidity clusters above the current price, while multiple deep clusters exist below. These downside clusters act as magnets that could pull price lower, making the recent rally vulnerable without sustained buying pressure.

    How strong is the bullish signal from the Aroon Indicator?

    The Aroon Indicator on TradingView shows Aroon Up above Aroon Down, confirming a technical bullish bias, but the gap between the lines is minimal. A convincing bullish trend would typically require Aroon Up at 100% and Aroon Down at 0%, which is not currently the case.

    What price level must AVAX clear to confirm a structural trend change?

    AVAX needs a decisive daily close above the recent lower high. Clearing this level would nullify the prior bearish leg and the downtrend structure, providing a stronger foundation for a sustained rally.

  • XRP Spot Trading Volume Surges to $1.36 Billion as Price Climbs 7% to $1.41

    XRP Spot Trading Volume Surges to $1.36 Billion as Price Climbs 7% to $1.41

    Key Highlights

    • XRP spot trading volume surged to approximately $1.36 billion over a 24-hour weekend period, according to CoinGlass data.
    • The token’s price rallied roughly 7% to reclaim the $1.41 level, signaling renewed buyer interest.
    • Total tracked turnover across exchanges approached $4.9 billion on CoinMarketCap, indicating broad-based market participation.

    Weekend Volume Spike Propels XRP Above $1.40

    XRP demonstrated significant market momentum over the weekend as spot trading volume climbed to approximately $1.36 billion in a single 24-hour window, data from CoinGlass shows. The surge in on-exchange activity coincided with a price appreciation of roughly 7%, enabling the digital asset to retake the psychologically important $1.41 threshold. The move marks a notable recovery for the token, which has traded in a relatively tight range throughout the preceding weeks.

    Exchange Data Points to Broad-Based Participation

    While CoinGlass recorded the spot volume at $1.36 billion, aggregated figures from CoinMarketCap painted an even more expansive picture of market engagement. Total tracked turnover across all monitored trading venues approached $4.9 billion during the same period. The disparity between spot and total tracked volumes suggests heightened activity in derivatives markets, including perpetual futures and options, alongside traditional spot buying and selling. Such elevated derivatives turnover often accompanies strong directional conviction among traders.

    Technical Reclamation of Key Resistance

    The push above $1.41 represents a technical breakthrough for XRP, as the level had previously acted as resistance during multiple testing episodes in recent sessions. Reclaiming this price point shifts the near-term market structure in favor of bulls, potentially opening a path toward the next cluster of seller liquidity near the $1.50-$1.55 zone. Market observers will be watching closely for follow-through volume during the traditional Asian and European trading sessions to validate the sustainability of the weekend advance.

    Why This Matters

    Weekend trading sessions in cryptocurrency markets are typically characterized by lower liquidity and thinner order books, making the observed volume spike particularly noteworthy. A $1.36 billion spot volume print during a traditionally quiet period suggests institutional or algorithmic participants were actively accumulating positions, rather than retail-driven speculation alone. The concurrent rise in total tracked turnover to nearly $4.9 billion underscores that the move was supported across both spot and derivative venues, reducing the likelihood of a false breakout driven solely by leveraged positioning. For XRP, which remains entangled in ongoing regulatory proceedings in the United States, sustained trading above $1.40 could improve market sentiment and attract renewed interest from market makers and liquidity providers who have remained cautious amid legal uncertainty.

    Frequently Asked Questions

    What drove the sudden increase in XRP trading volume over the weekend?

    The source data attributes the volume surge to heightened spot and derivatives activity across major exchanges, though it does not specify a single catalyst. Such moves often follow technical breakouts, macroeconomic news, or developments in the Ripple Labs vs. SEC legal case.

    Is the $1.41 price level significant for XRP?

    Yes. The $1.41 mark has acted as a key resistance level in recent trading. Reclaiming it on high volume is viewed by technical analysts as a bullish signal that could precede further upside toward the $1.50-$1.55 region, provided buying pressure sustains.

    How does CoinGlass data differ from CoinMarketCap’s total tracked turnover?

    CoinGlass reported $1.36 billion in spot volume specifically, while CoinMarketCap’s $4.9 billion figure represents aggregate turnover across spot, futures, and options markets. The gap highlights substantial derivatives activity accompanying the spot rally.

  • Crypto Longs Worth $570 Million Wiped Out as Clarity Act Fails

    Crypto Longs Worth $570 Million Wiped Out as Clarity Act Fails

    Crypto traders holding long, or bullish, futures positions suffered significant losses over the past 24 hours following the failure of the Clarity Act in a Senate procedural vote.

    Liquidation Data Reveals Heavy Long-Side Damage

    Exchanges liquidated approximately $571 million in long positions during this period, marking the highest total since August 22, according to data from CoinGlass. In contrast, short, or bearish, positions accounted for only about $100 million of the total wipeout.

    Bitcoin and Ether Lead Liquidation Tally

    Bitcoin and ether longs absorbed the heaviest damage, with roughly $190 million liquidated in each asset. XRP longs lost about $30 million, while Solana longs saw approximately $22 million in liquidations.

    Market Positioning Reflected Legislative Optimism

    The liquidation data indicates markets were positioned for continued upside, largely driven by hopes that the Clarity Act would advance. Analysts had previously flagged ether and DeFi tokens as the assets most likely to outperform bitcoin if the Senate voted in favor of the legislation.

    Trump Concession Reports Fueled Recent Rally

    Optimism strengthened earlier this week after reports that President Donald Trump was willing to make concessions on the bill’s ethics provisions. The market responded positively: bitcoin, the largest cryptocurrency by market value, rose to nearly $80,000 from about $77,000 on Monday.

  • Bitcoin Hits Resistance: $2.9B in Longs at Risk Below $68,000

    Bitcoin Hits Resistance: $2.9B in Longs at Risk Below $68,000

    Bitcoin has surged approximately 40% from its July low of around $57,800, sparking fresh optimism that the cryptocurrency may have established a definitive market bottom after several months of sideways consolidation. On August 27, $BTC was trading near $80,200. However, this impressive recovery has pushed the leading digital asset back into a major overhead resistance zone that previously triggered a sharp market sell-off.

    Technical indicators and derivatives market metrics indicate that the current rally could face a notable correction unless Bitcoin can decisively break through this key barrier.

    Leveraged Positions Highlight Potential Downside Risks

    An analysis of Bitcoin’s liquidation heatmap reveals a heavy concentration of leveraged positions sitting just below the current market price. This imbalance suggests that the path of least resistance could turn downward to flush out over-leveraged buyers.

    The closest downside liquidity cluster is situated around the $77,500 level. Data from CoinGlass indicates that approximately $392.31 million in long positions could face liquidation if $BTC slips to this price point. Because high-density liquidation zones act as liquidity magnets, they often attract price action and fuel market volatility when tested.

    A drop toward $77,500 could trigger a chain reaction of forced selling among leveraged long traders, accelerating downward momentum. An even larger risk cluster lies lower at $68,000, where an estimated $2.9 billion in long positions are vulnerable to liquidation.

    In contrast, the primary liquidity pool for short sellers on the upside is located between $84,200 and $84,215. While Bitcoin features massive liquidity targets on both sides of its current price, the significantly larger volume of leverage on the downside supports a cautious short-term outlook. Currently, $82,500 remains the critical breakout level to watch. Failing to clear this barrier could expose $77,500, followed by $72,000, and eventually the $68,000–$68,300 zone.

    BTC Re-enters the Resistance Zone of a Previous 30% Drop

    Bitcoin is currently trading within the key $79,000–$82,500 range, the same territory that capped its recovery efforts back in May. During that previous consolidation phase, sellers ultimately seized control at these levels, sparking a rejection that drove $BTC down to $57,800—a steep decline of nearly 30% from the upper boundary of the range.

    The current retest of this zone is showing similar signs of market exhaustion. Bitcoin’s daily Relative Strength Index (RSI) has climbed above 82, placing it deep in overbought territory (well above the traditional threshold of 70). While an overbought RSI does not guarantee an immediate price drop, it significantly elevates the probability of profit-taking from short-term holders.

    Key Technical Support Levels to Monitor

    Should Bitcoin fail to break above the crucial $82,500 resistance, its 200-day exponential moving average (EMA) near $72,000 will serve as the first major line of defense. A pullback to this level would represent a roughly 10% decline from current prices.

    If selling pressure intensifies, $BTC could decline toward the $68,000–$68,300 area. This region is bolstered by the convergence of the 50-day and 100-day exponential moving averages, making it a highly formidable support zone.

    Conversely, the bearish outlook would be invalidated if Bitcoin manages a decisive daily close above $82,500. A clean breakout would convert this former major resistance zone into a reliable support base, reinforcing the theory that the July low of $57,800 marked a solid, long-term market bottom.