Key Highlights
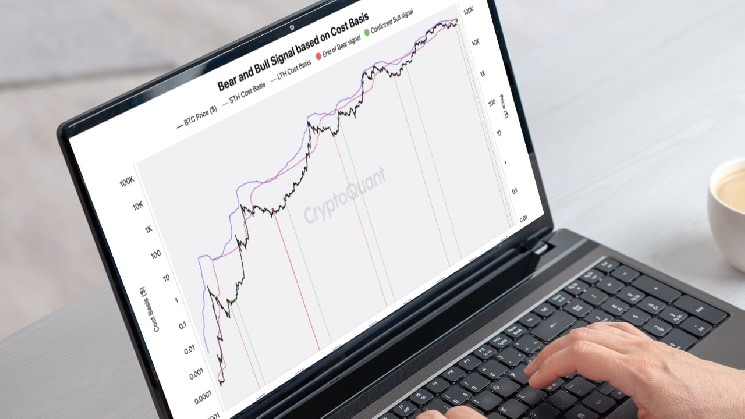
- Cryptoquant contributor Darkfost identifies a fifth historical bull market signal for Bitcoin on September 24, marking the first such crossover since 2023 and joining prior signals in 2012, 2015, 2019, and 2023.
- The signal triggers when the short-term holder cost basis rises above the active long-term holder cost basis, using a seven-year activity filter that excludes over 3.5 million dormant BTC untouched for a decade or more.
- U.S. spot Bitcoin ETFs recorded $2.06 billion in net inflows over three consecutive days (Sept. 21–23), led by a record $999 million single-day inflow on Sept. 21, coinciding with the signal’s confirmation.
Fifth Cost-Basis Crossover Confirms Bull Market Structure
A new on-chain metric flashed a bullish confirmation for Bitcoin on September 24, marking the fifth time in the asset’s history that the average acquisition cost of short-term holders has surpassed that of active long-term holders. The analysis, published by Cryptoquant contributor Darkfost, identifies the crossover as a recurring structural signal that has preceded sustained upward moves in each of the four prior cycles.
In a post on X, the analyst stated: “Bull Market Confirmed … This is the 5th occurrence, which gives a bit more credibility to the dynamic bitcoin is putting in place, though there’s always a margin for error, and I prefer to point that out.” The comment underscores both the statistical weight of the pattern and the inherent uncertainty in any single indicator.
The metric compares two distinct cost bases: the average price paid by short-term holders versus the average price paid by active long-term holders. Crucially, the long-term cohort is filtered to include only coins that have moved at least once in the past seven years. This design excludes deeply dormant supply—estimated at more than 3.5 million BTC older than ten years—which the analyst argues would otherwise distort the measure of genuine holder conviction.
Defining Active Long-Term Holders: The Seven-Year Filter
The seven-year activity threshold serves a different analytical purpose than the standard 155-day holding period used by firms such as Glassnode to separate short-term from long-term supply. While Glassnode’s definition classifies any coin held longer than roughly five months as long-term, Darkfost’s additional filter asks whether that long-term coin has shown any on-chain life in the last seven years. Coins that have not are treated as effectively lost or permanently dormant and removed from the active cost-basis calculation.
The analyst acknowledges the cutoff is arbitrary but notes its practical relevance. The dormant pile grows by an estimated 8,000 to 30,000 BTC each month, and its monthly change has turned negative only once since 2019—when an early miner moved approximately 100,000 BTC. Notably, coins inactive for five to 15 years resumed movement in 2026, demonstrating that even decade-old supply can re-enter circulation and validating the decision to track active versus dormant segments separately.
ETF Inflows Provide Liquidity Backdrop for the Signal
The cost-basis crossover arrived alongside a surge of institutional demand via U.S. spot Bitcoin exchange-traded funds. According to daily flow data from Farside, the funds attracted $2.06 billion in net inflows across the three sessions from September 21 through September 23. Every session printed positive flows, though the pace decelerated sharply after the opening day.
September 21 saw the largest single-day inflow of 2026 at $999 million. The following day added $714.7 million, and September 23 contributed $346.9 million. The three-day sequence coincides with the period in which the on-chain signal confirmed, lending circumstantial support to the argument that fresh ETF liquidity is reinforcing the shift in holder economics. The analyst cautions, however, that the flow data establishes correlation during the signal window, not causation of the crossover itself.
Spot Bitcoin ETFs allow investors to gain exposure through brokerage-traded shares backed by actual BTC held by the fund, lowering the operational barrier for institutional allocators and wealth managers who cannot or prefer not to custody digital assets directly.
Cycle Outlook: Tempered Volatility, Multi-Fold Returns
The bullish signal and ETF momentum are being framed within a broader cycle thesis. In a separate assessment published September 22, Cryptoquant founder and CEO Ki Young Ju argued that the market’s expanding size and deepening institutional ownership could dampen the extreme boom-bust amplitude characteristic of earlier cycles. His base-case forecast projects threefold to fivefold returns for Bitcoin this cycle, followed by a milder bear market drawdown than historical norms.
Why This Matters
The fifth cost-basis crossover matters because it represents a rare confluence of on-chain holder behavior and institutional capital flows. Prior occurrences in 2012, 2015, 2019, and 2023 each preceded significant bull-market legs, suggesting the metric captures a fundamental shift in the marginal buyer—from long-term accumulators to newer participants willing to pay higher average prices. The seven-year activity filter refines this insight by focusing on economically active long-term holders, filtering out supply that behaves more like lost coins than invested capital. Meanwhile, the $2.06 billion in ETF inflows over three days—anchored by a record $999 million session—signals that traditional financial infrastructure is now a primary vector for Bitcoin demand. If Ki Young Ju’s cycle thesis holds, the combination of structural on-chain signals and sustained institutional flows could produce a cycle defined by steadier appreciation and shallower corrections, reshaping risk expectations for both retail and institutional participants.
Frequently Asked Questions
What exactly is the “fifth bull market signal” identified by Cryptoquant?
It is the fifth historical occurrence where the short-term holder realized price (average acquisition cost of coins held less than ~155 days) crosses above the active long-term holder realized price (average cost of coins held longer than 155 days that have also moved at least once in the past seven years). Previous crossovers appeared in 2012, 2015, 2019, and 2023.
Why does the analysis exclude Bitcoin that hasn’t moved in over seven years?
The analyst treats coins untouched for seven-plus years as dormant or effectively lost supply. Including them in the long-term holder cost basis would dilute the measure of active holder conviction. Over 3.5 million BTC fall into this category, growing by 8,000–30,000 BTC monthly, with only one monthly decline since 2019.
Did the ETF inflows cause the bullish crossover?
The data shows the $2.06 billion in net ETF inflows (Sept. 21–23) coincided with the signal’s confirmation, but the analyst explicitly states the flows “do not establish that ETF buying caused the crossover.” The inflows provide liquidity context, not proof of causation.