Key Highlights
- Bitcoin surged approximately 6% on Friday to briefly trade above $81,000, absorbing five major macroeconomic and regulatory headwinds—including a failed Senate vote on the CLARITY Act, a Federal Reserve rate hike, and a Bank of Japan rate increase—without a sustained selloff.
- The rally was driven predominantly by short covering: $470 million in short positions were liquidated versus only $60 million in longs, while aggregate open interest fell 1.4%, signaling position compression rather than fresh leveraged buying.
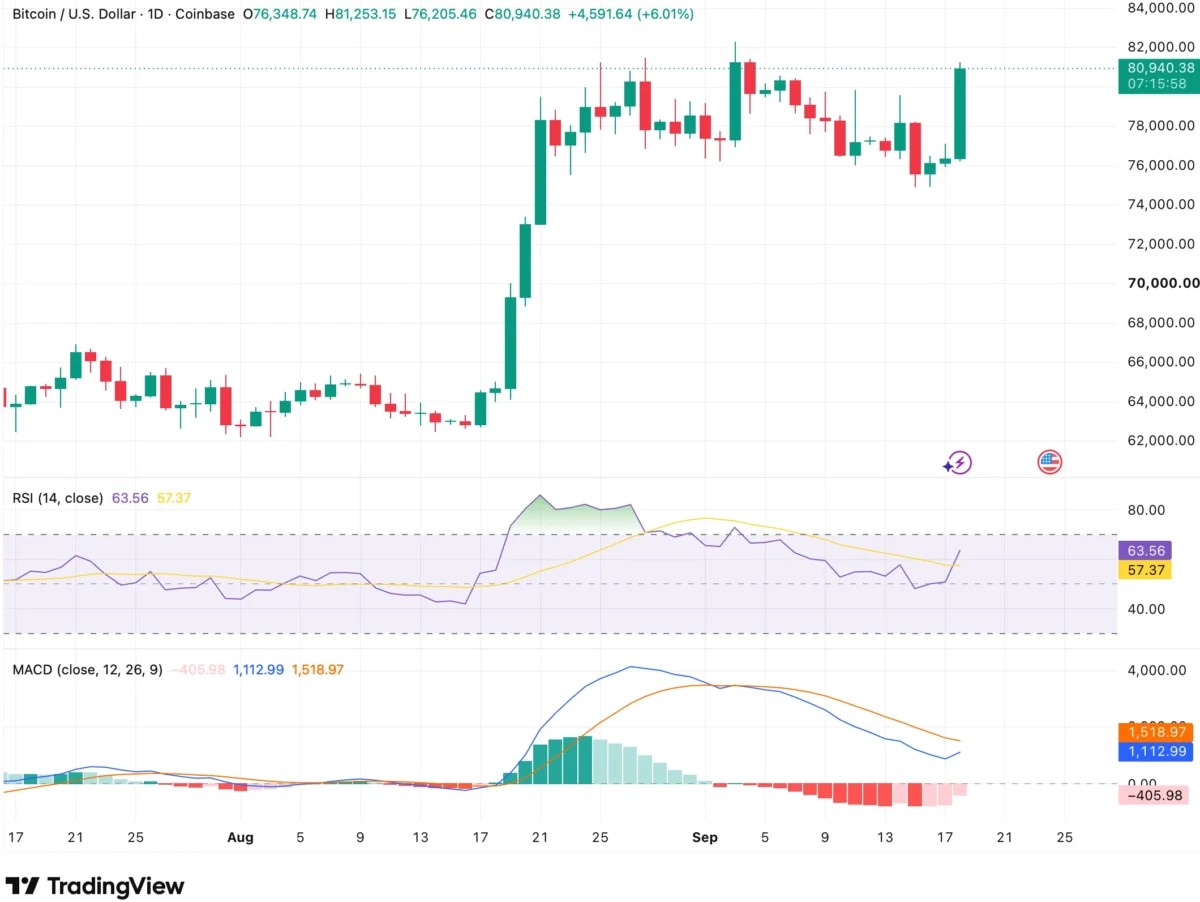
- Technical momentum is improving (14-day RSI at 63.56, above its moving average), but the daily MACD remains below its signal line, leaving the move unconfirmed by slower momentum indicators.
Bitcoin Defies Concentrated Macro Headwinds
Bitcoin staged a sharp intraday reversal on Friday, climbing roughly 6% to a session high of $81,253 on the Coinbase daily chart before settling near $80,940 at the time of writing. The advance is notable not for its magnitude but for the backdrop against which it occurred: within a single week, the market digested a procedural failure on the CLARITY Act in the U.S. Senate (49–50, short of the 60 votes needed for cloture), the Federal Reserve’s first rate increase since 2023 (lifting the target range to 3.75%–4.00%), the Bank of Japan’s policy rate hike to 1.25% (a 31‑year high), a U.S. Dollar Index reclaiming the 100 level, and Brent crude holding above $100 per barrel. Each of these developments typically pressures risk assets—higher rates boost the appeal of yield‑bearing alternatives, a stronger dollar tightens global financial conditions, and elevated oil sustains inflationary impulses—yet Bitcoin not only refused to extend its earlier decline toward $76,000 but accelerated higher.
Derivatives Data Reveal Short‑Covering Dynamics
Friday’s derivatives metrics provide a clearer mechanical explanation than any single bullish catalyst. According to Coinglass data, roughly $530 million in leveraged crypto positions were liquidated over 24 hours, with short positions accounting for approximately $470 million of that total versus only $60 million in long liquidations. Simultaneously, aggregate open interest declined 1.4% to $453.43 billion while 24‑hour derivatives volume rose 2.2% to nearly $936 billion. This combination—rising price, falling open interest, and disproportionately large short liquidations—is consistent with position compression: traders positioned for further downside were forced to buy back as Bitcoin rallied, amplifying the move. The breadth of the advance underscores the systemic nature of the squeeze; Ethereum gained 5.3%, XRP 6.2%, Solana 10.4%, and HYPE more than 11%, lifting total crypto market capitalization about 5% to $2.76 trillion.
Short Squeezes Are Self‑Limiting
While the liquidation cascade explains the velocity of Friday’s rally, it does not guarantee durability. Forced covering creates mechanical demand that evaporates once bearish positions are exhausted. The critical question is whether underlying spot demand—evidenced by sustained exchange trading activity, continued ETF inflows, or stable open interest rebuilding—persists after the liquidation impulse fades. Absent that, the rally remains a positioning unwind rather than a new demand regime.
Technical Momentum Improves But Lags Price Action
Bitcoin’s daily chart offers a second lens on sustainability. The 14‑day Relative Strength Index has climbed to 63.56, comfortably above its moving average at 57.37 and well clear of the conventionally overbought 70 threshold, indicating strengthening momentum without exhaustion. The Moving Average Convergence Divergence, however, tells a more cautious story: the MACD line has turned upward to 1,112.99 but remains below the signal line at 1,518.97, leaving the histogram negative at –405.98. The histogram bars have been contracting and the MACD line curling higher, suggesting the direction is improving, but a bullish crossover has not yet occurred. This divergence—price accelerating while the slower daily momentum indicator has not fully confirmed—creates a clear watchpoint: a MACD crossover would signal that momentum broadening is underway rather than remaining concentrated in a single explosive session.
Historical Parallel: 2023 Regime Shift Echoes
The current dynamic bears a striking resemblance to Bitcoin’s behavior throughout 2023. During that period, the asset absorbed aggressive Federal Reserve tightening (the target range ultimately reaching 5.25%–5.50%) alongside an intensive U.S. regulatory campaign that saw the SEC sue Coinbase and Binance and designate several major tokens as securities. Despite repeated negative headlines, each successive shock generated diminishing incremental selling pressure, and Bitcoin gradually ceased revisiting the lows established after the 2022 collapse. The lesson from 2023 is not that restrictive policy or enforcement actions became bullish, but that the market’s capacity to produce new sellers in response to them was waning. Markets can begin shifting before the news flow turns favorable, and Friday’s price action—absorbing five simultaneous headwinds without a net decline—suggests a similar recalibration may be in progress.
Why This Matters
The week’s events highlight a potential inflection point in Bitcoin’s market structure. For years, macro tightening and regulatory uncertainty acted as reliable catalysts for drawdowns. The failure of that playbook in the face of a concentrated barrage of negative catalysts—failed legislation, dual central‑bank hikes, dollar strength, and elevated energy prices—signals that the marginal seller may be exhausted. If spot demand proves resilient, leverage remains contained, and momentum indicators like the MACD confirm the RSI’s strength, the market could be transitioning to a regime where bad news is increasingly “priced in” and produces diminishing downside volatility. This has direct implications for portfolio allocation, risk management, and the narrative around Bitcoin’s maturation as a macro asset. Institutional participation metrics (ETF flows, custody data) and derivatives market structure (open interest trends, funding rates) will be the primary arbiters of whether this is a durable shift or a temporary positioning anomaly.
Frequently Asked Questions
What specifically drove Bitcoin’s 6% rally on Friday?
The primary driver was a massive short‑covering event: approximately $470 million in short positions were liquidated in 24 hours, forcing bearish traders to buy back Bitcoin and accelerating the price rise. Aggregate open interest fell, confirming that the rally stemmed from position unwinding rather than new leveraged long entries.
Is this rally sustainable or just a short squeeze?
Sustainability hinges on whether genuine spot demand persists after the forced buying ends. Key signals to watch include continued ETF inflows, stable or gradually rebuilding open interest (rather than a surge in aggressive longs), and a bullish MACD crossover on the daily chart confirming broadening momentum.
How does this week compare to previous macro stress periods for Bitcoin?
The closest analogue is 2023, when Bitcoin absorbed simultaneous Fed tightening and SEC enforcement actions with progressively smaller drawdowns. In both episodes, the market’s reaction function to negative news appeared to change—selling pressure diminished even as the fundamental headwinds persisted—suggesting a structural shift in participant positioning and risk appetite.