
Tag: Altcoin Season Index

  • Altcoin Market Cap Surpasses $1.07T as Bitcoin Dominance Weakens, Fueling Altseason Speculation

    Altcoin Market Cap Surpasses $1.07T as Bitcoin Dominance Weakens, Fueling Altseason Speculation

    Key Highlights

    • The total altcoin market capitalization, including Ethereum, has broken above the critical $1.07 trillion resistance level, marking the midpoint of a long-term trading range with a ceiling near $1.71 trillion.
    • Market sentiment has shifted decisively bullish: the Crypto Fear & Greed Index has held above 60 since August 20, and 70% of altcoins on Binance now trade above their 200-day moving average, confirming sustained upward momentum.
    • Despite the strength, the Altcoin Season Index sits at just 54—well below the 80 threshold that historically signals a true altseason—while analysts warn that rising social-media-driven leverage could trigger a near-term pullback.

    Altcoin Market Cap Breaks Key Resistance, Signaling Broad-Based Strength

    The cryptocurrency market has entered a pronounced greed phase, with the Crypto Fear & Greed Index climbing above 60 on August 20 and remaining at elevated levels since. This sentiment shift coincides with a sharp Bitcoin recovery that lifted BTC from roughly $76,000 back above the $80,000 mark, rekindling risk appetite across the digital-asset spectrum. Crucially, the aggregate altcoin market capitalization—including Ethereum—has mirrored Bitcoin’s gains, clearing the pivotal $1.07 trillion level that represents the midpoint of a multi-year range whose upper boundary sits near $1.71 trillion.

    Technical Milestones and On-Chain Confirmation

    Glassnode, in a post on X, observed that altcoin open interest as a share of Bitcoin’s open interest has not yet reached risk thresholds, suggesting the current rally is not overextended on a leverage basis. The research firm added that “A resurgent Ethereum also helped make the case that the altcoin strength would continue in the coming days and weeks.” Supporting this view, crypto analyst Darkfost noted that “70% of the altcoins on Binance have moved back above their 200-day moving average.” He emphasized that “This confirmed that a majority of them were experiencing strong, sustained bullish momentum in recent weeks to clear this key MA.” Meanwhile, Bitcoin itself is eyeing the next major hurdle at the $82,000 resistance zone, a break of which could further amplify capital rotation into alternative assets.

    Why Altseason Has Not Yet Arrived Despite Bullish Metrics

    While price action and breadth indicators are flashing green, the dedicated Altcoin Season Index remains at only 54. Historical precedent shows that true altseason extremes typically occur when this index surpasses 80—a level last seen in September 2025, just weeks before Bitcoin printed its all-time high. The source analysis states plainly: “It is not yet altseason.” It adds that “Rising altcoin market cap and falling Bitcoin dominance trends, if they come true in the coming weeks, will serve as confirmation of hefty capital flow into the altcoin market.” In other words, the necessary rotation from Bitcoin dominance into a broad altcoin rally is still in its early innings.

    Social Hype and Leverage: The Double-Edged Sword

    Alphractal, writing on X, highlighted a surge in social-media activity accompanying the price rally: “The sudden price rally across the market resulted in a surge in social media posts. This can lead to more discussion, more FOMO, and more speculation.” The same analysis cautioned that “Heightened leverage could be a factor to watch out for, as it would increase the risk of a pullback.” Nevertheless, the firm concluded that “As things stand, the conditions support further gains for the altcoin market.”

    Why This Matters

    The breach of the $1.07 trillion altcoin market-cap midpoint is a structurally significant development. It suggests that capital is beginning to diversify beyond Bitcoin in a sustained manner, a prerequisite for any genuine altseason. However, the sub-80 Altcoin Season Index reading indicates that leadership remains concentrated in a subset of large-cap assets—likely Ethereum and a handful of major layer-1s—rather than the broad-based speculative frenzy that characterizes mature alt cycles. Traders and investors should monitor two key confirmation signals: a decisive decline in Bitcoin dominance below its recent range and a sustained push of the Altcoin Season Index toward the 80 threshold. Simultaneously, the rapid rise in social-media chatter and potential leverage buildup warrants caution; history shows that excessive retail FOMO often precedes sharp, short-lived corrections even within longer-term uptrends.

    Frequently Asked Questions

    Has altseason officially started according to the Altcoin Season Index?

    No. The Altcoin Season Index currently sits at 54, well below the 80 level that historically marks the beginning of a true altseason. The last time the index exceeded 80 was in September 2025, shortly before Bitcoin reached its all-time high.

    What technical level did the total altcoin market cap just clear, and what is the next target?

    The aggregate altcoin market capitalization (including Ethereum) broke above the $1.07 trillion midpoint of a long-term range. The next major resistance is the range high near $1.71 trillion.

    What are the primary risks to the current altcoin rally?

    Analysts flag two main risks: (1) a rapid increase in leverage driven by social-media-fueled FOMO, which could amplify any pullback, and (2) the absence of a confirmed downtrend in Bitcoin dominance, which is needed to validate broad-based capital rotation into altcoins.

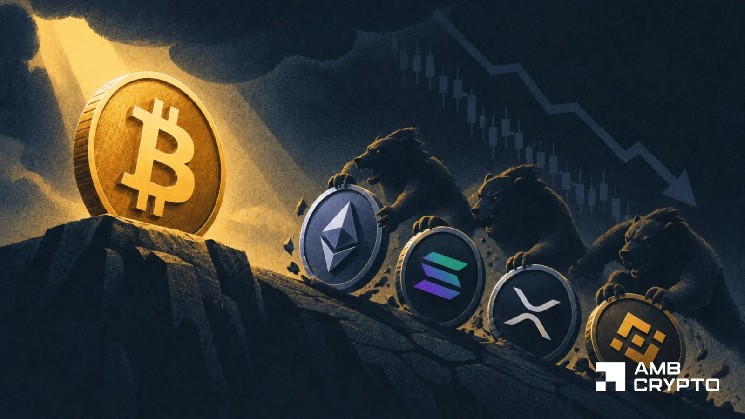
  • Altcoins Surge Again, but a Key Metric Indicates Altseason Is Still Absent

    Altcoins Surge Again, but a Key Metric Indicates Altseason Is Still Absent

    Key Highlights

    • Altcoin market capitalization surged to $222 billion for the first time in eight months, yet futures leverage remains well below historical risk thresholds.
    • Major assets remain far from all-time highs: Bitcoin down 36%, Ethereum down 47%, Solana down 61%, and the broad altcoin market cap down 54%.
    • The Altcoin Season Index sits at 54—firmly between Bitcoin Season and Altcoin Season—and has repeatedly failed to sustain the 75+ level required for a confirmed altseason.

    Altcoin Market Cap Surges to $222 Billion but Leverage Remains Subdued

    The broader cryptocurrency market rally has lifted the altcoin complex, pushing total altcoin market capitalization to $222 billion—a level not seen in eight months. Despite this notable expansion, on-chain and derivatives data suggest the advance lacks the speculative intensity that historically precedes a full-blown altseason. According to Glassnode, altcoin leverage is still below the major risk threshold that typically signals overheated conditions. “Altcoin traders need to put in more work,” the data implies, as futures open interest for altcoins relative to Bitcoin (BTC) hovers around -10% to -15%, well beneath the red risk-threshold line near parity. Historically, spikes toward or above that parity line have coincided with stretched leverage and elevated liquidation risk. The current reading indicates the derivatives market remains relatively uncrowded, leaving room for additional speculative capital to flow in before leverage reaches historically dangerous levels.

    Distance from All-Time Highs and Bitcoin Dominance Shape Market Dynamics

    Contextualizing the rally requires examining the gap to previous peaks. Bitcoin continues to trade roughly 36% below its all-time high, while Ethereum (ETH) sits approximately 47% below its peak. Solana (SOL) remains about 61% off its high, and the aggregate altcoin market capitalization is still 54% below its former summit, per data from TradingView. At the same time, Bitcoin dominance held at a healthy 59.19% at press time, underscoring that the largest cryptocurrency still commands the majority of total crypto market capitalization. This dominance metric, combined with the deep drawdowns across major altcoins, suggests the current bounce is occurring within a broader structural downtrend rather than a fresh bull market expansion.

    Altcoin Season Index Stalls at 54, Failing to Confirm Broad Rotation

    The Altcoin Season Index, tracked by Coinglass, registered a reading of 54 at press time—squarely in the neutral zone between Bitcoin Season (below 25) and Altcoin Season (above 75). While the index has periodically climbed toward the 75+ threshold, it has consistently failed to sustain those levels. This pattern confirms that the market has not yet achieved the breadth or consistency required for a genuine altseason. A recent report by AMBCrypto reinforced this view, highlighting that although altcoins may finally be breaking out after nearly two years of stagnation, a broad, self-sustaining altcoin season has not yet arrived.

    Why This Matters

    The divergence between rising spot prices and subdued derivatives leverage presents a nuanced picture for market participants. On one hand, the low leverage ratio reduces the immediate risk of cascading liquidations that can abruptly end rallies. On the other, it signals a lack of conviction among speculative traders, who typically pile into futures during confirmed altseasons. The persistent Bitcoin dominance above 59% and the failure of the Altcoin Season Index to breach 75 suggest capital rotation remains tentative. For investors, this environment favors selectivity over broad beta exposure: assets with strong fundamentals, upcoming catalysts, or clear technical breakouts may outperform, while a indiscriminate “altcoin rally” remains contingent on a sustained shift in market structure—specifically, a decline in Bitcoin dominance toward the low-50s and a decisive close of the Altcoin Season Index above 75.

    Frequently Asked Questions

    What does the current altcoin futures open interest relative to Bitcoin indicate?

    The metric sits at -10% to -15%, below the parity risk threshold. This means altcoin derivatives positioning is not yet stretched, implying there is capacity for further speculative inflows before leverage reaches historically elevated, high-risk levels.

    Why hasn’t an altcoin season been confirmed despite the market cap recovery?

    The Altcoin Season Index at 54 has repeatedly failed to hold above 75, Bitcoin dominance remains high at 59.19%, and major altcoins are still 47–61% below their all-time highs. These factors indicate insufficient breadth and momentum for a broad-based altseason.

    How far are major cryptocurrencies from their all-time highs?

    As of the latest data: Bitcoin is ~36% below its ATH, Ethereum ~47%, Solana ~61%, and the total altcoin market cap ~54% below its peak.

  • Altcoin Rally Stalls as Institutional Bets Fail to Rescue Ethereum, Solana, Aptos

    Altcoin Rally Stalls as Institutional Bets Fail to Rescue Ethereum, Solana, Aptos

    Altcoin Market Diverges After August Rally as Bitcoin Dominance Holds Near 60%

    The cryptocurrency market is signaling a significant shift following August’s rally, with major altcoins splitting into distinct winners and losers while Bitcoin maintains its commanding lead. Ethereum, Solana, and XRP all declined despite positive fundamental developments, while Tron, Aptos, and Kaspa posted strong gains.

    Ethereum Slips Despite Institutional Accumulation and ETF Inflows

    Ethereum ($ETH) fell approximately 2% over the period, even as bullish catalysts accumulated. Bitwise added 28,086 ETH to its treasury, bringing holdings to nearly 4.9% of Ethereum’s total supply. Simultaneously, spot ETH ETFs recorded $218 million in net inflows, underscoring sustained institutional demand.

    On the protocol front, Vitalik Buterin introduced EIP-8141, a proposal designed to simplify stablecoin transactions by reducing the necessity for users to hold ETH specifically for gas fees.

    Solana Declines Amid Technical Upgrade and Corporate Buying

    Solana ($SOL) dropped 4% despite the activation of its Transaction V1 upgrade, which enhances the network’s capacity to process larger and more complex DeFi transactions. DeFi Development Corp. raised $11 million to acquire SOL, adding a layer of potential institutional demand. However, spot SOL ETFs saw modest outflows, and broader market weakness pressured the token.

    XRP and BNB Face Headwinds Despite Ecosystem Growth

    Ripple’s XRP experienced a sharper decline even as RLUSD’s market capitalization surpassed $2.3 billion. Binance Coin ($BNB) fell 1.5%, though BNB Chain strengthened its position in tokenized assets, now holding approximately $1.267 billion in tokenized stocks—representing 44.6% of that market segment, ahead of both Ethereum and Solana. Jupiter’s JUP slipped just 0.7% as it expanded into tokenized assets.

    Tron, Aptos, and Kaspa Lead Gainers

    Not all altcoins retreated. Tron (TRX) gained 2.7%, supported by Canary Capital’s launch of TRXS, the first spot-staked TRON ETF. Aptos ($APT) surged 6.4%, driven largely by Bitwise filing an S-1 registration statement for a potential spot Aptos ETF, raising expectations for broader institutional access.

    Kaspa ($KAS) emerged as the strongest performer, rallying 23% as its circulating supply approached 96.5% of its hard cap, significantly reducing concerns around future supply dilution.

    Altcoin Season Index Signals Continued Bitcoin Preference

    The Altcoin Season Index sat at 40 at press time, indicating the market remains in a Bitcoin-dominated phase rather than a broad altcoin rally. Data from CoinGlass shows altcoin Open Interest has surpassed Bitcoin’s for the first time since December 2024, signaling aggressive leveraged positioning in the altcoin space.

    Bitcoin ($BTC) traded at $76,751.69, down modestly over 24 hours but up over 22% on a monthly basis. Bitcoin dominance stands at 59.29%, up 0.18%, reinforcing capital preference for BTC over altcoins.

    Key Resistance at 60% Dominance Could Dictate Next Move

    The steady rise in Bitcoin dominance suggests the current Bitcoin season trend remains intact. However, with dominance testing the key 60% resistance level, weak trading volumes and renewed macroeconomic uncertainty could trigger a rejection—potentially paving the way for a September-style altcoin rally. Confirmation of such a shift remains pending until altcoins break through critical resistance levels.

    Summary

    • Ethereum, Solana, XRP, and Jupiter declined post-August rally despite positive fundamentals.
    • Tron, Aptos, and Kaspa surged on ETF filings, product launches, and supply dynamics.
    • Altcoin Season Index at 40 confirms Bitcoin season persistence.
    • Bitcoin dominance at 59.29% tests 60% resistance; breakout or rejection will signal next trend.
  • Crypto Market Moves ‘as one block’ Despite Broader Rally, Says Cryptex Co-Founder

    Crypto Market Moves ‘as one block’ Despite Broader Rally, Says Cryptex Co-Founder

    Bitcoin and major altcoins have posted sharp gains, but Cryptex Finance data suggests the cryptocurrency rally has not yet produced a broad rotation of capital beyond Bitcoin and Ethereum.

    Cryptex Finance tracks 36 digital assets representing approximately 92% of the cryptocurrency market. Its co-founder, Joe Sticco, told crypto.news that participation in the rally had widened, while capital allocation had not kept pace. As a result, cryptocurrencies have traded more like a single market than a group of assets in which investors are selecting individual winners.

    Cryptex’s market index reached 1,199.69, nearly 20% above its 1,000 base level set on Feb. 20. The index tracks assets across five sectors using Coinbase pricing, offering a broader view than Bitcoin or a small group of leading altcoins.

    Over the previous seven days, however, the index had gained only 1.92%. Sticco said much of the rally from recent lows occurred during a roughly 72-hour period between Aug. 19 and Aug. 21, followed by several days of relatively flat trading.

    “Measure from the low, and you get a rally. Measure the trailing week, which is what most readers think they’re being told, and you get almost nothing,” Sticco said.

    Bitcoin’s acceleration during that period followed a major derivatives flush alongside renewed spot demand. Earlier market coverage showed $BTC rising from below $65,000 to approximately $69,500 on Aug. 19 as more than $1 billion in cryptocurrency short positions were liquidated within an hour.

    Cryptocurrency gains show limited separation between assets

    Price dispersion within the Cryptex index provides another reason Sticco is reluctant to describe the move as a full capital rotation.

    On the day measured by Cryptex, the strongest constituent rose 6.71%, while the weakest fell 1.49%. Although the index covers 36 cryptocurrencies across five sectors, the difference between the best and worst performers was only about eight percentage points.

    “That is not a market sorting winners from losers. That’s a market moving as one block,” Sticco said.

    Sticco said the low level of dispersion indicates that a common market factor is lifting cryptocurrencies together, rather than investors shifting money between assets based on their individual fundamentals.

    Major tokens still recorded notably different headline gains over the broader rally. Sticco estimated Bitcoin’s seven-day increase at roughly 14%, compared with 28% for $XRP and about 19% for Solana.

    Capital allocation did not reflect that apparent range of price performance. Bitcoin dominance remained between approximately 57% and 60%, depending on the market universe used. Sticco also cited an Altcoin Season Index reading below 40, well below the 75 threshold generally used to identify an altcoin season.

    Solana remained more than 50% below its October 2025 level despite gaining about 19% during the week, according to Sticco.

    “Participation broadened. Allocation didn’t,” he said.

    Institutional cryptocurrency flows remain concentrated in Bitcoin and Ethereum

    Regulated investment products provide another way to distinguish rising cryptocurrency prices from the destination of new capital.

    During one recent Wednesday session, U.S. spot Bitcoin ETFs received approximately $232 million, while Ether ETFs attracted roughly $192 million, Sticco said. $XRP products brought in around $28 million, compared with approximately $15 million for HYPE products and $9 million for Solana.

    By Sticco’s calculation, nearly nine out of every 10 dollars went into Bitcoin and Ethereum. Weekly figures showed a similar concentration, with Bitcoin receiving approximately 71% of flows and Ethereum another 26%.

    The concentration has persisted as U.S. spot products have supported Bitcoin’s recovery. A previous report on ETF demand found that U.S. spot Bitcoin ETFs received approximately $1.9 billion over five consecutive inflow sessions by Aug. 24. Analysts said continued spot buying would be necessary after forced short covering helped accelerate the initial breakout.

    Sticco said the subsequent streak had reached eight consecutive sessions of net Bitcoin ETF inflows totaling approximately $2.8 billion. Ether ETFs had also recorded eight positive sessions and more than $1 billion in inflows.

    August Bitcoin ETF inflows had exceeded $3 billion by the time of his comments, making it the strongest month of 2026, according to Sticco. He said BlackRock had absorbed a significant share of the demand, including approximately $1.3 billion during the previous week.

    “Eight straight sessions of regulated spot creations is not what a short squeeze produces,” he said.

    ETF figures nevertheless require an additional distinction when measuring the amount of new institutional money entering Bitcoin.

    Sticco said the net assets held by the funds had increased from approximately $77 billion in mid-August to just above $99 billion by Tuesday, a gain of about $22 billion. Actual net inflows during the eight-session streak totaled only around $2.8 billion.

    Much of the difference came from Bitcoin’s rising price, which increased the value of assets already held by the funds, rather than from investors providing another $22 billion in fresh capital, he said.

    Earlier in August, five consecutive inflow sessions brought approximately $853.5 million into U.S. spot Bitcoin ETFs between Aug. 3 and Aug. 7, reversing withdrawals recorded during the preceding week.

    Sticco also cautioned against assessing August in isolation. He said spot Bitcoin ETFs had lost roughly $5.4 billion during the first half of 2026 and remained approximately $2.5 billion in negative territory for the year despite the latest inflows.

    ETF demand offers a clearer signal than derivatives positioning

    Distinguishing institutional buying from leveraged trading requires examining different parts of the market, according to Sticco.

    ETF flows and market depth measure demand, while funding rates, futures basis and open interest provide more information about trader positioning. Sticco said falling open interest alongside rising prices can indicate that short positions are closing rather than that new buyers are entering the market.

    He declined to characterize current open interest as either bullish or bearish because publicly available readings differed. Some datasets measure open interest in Bitcoin, while others use its dollar value, producing different trends when $BTC moves sharply.

    Market depth presents a similar challenge. Sticco described depth as one of the most useful measures of institutional participation because it shows how much capital can enter or exit without materially moving prices.

    “Price tells you what the last trade cleared at. Depth tells you what the next big one will cost.”

    Publicly available depth figures were not current enough for Sticco to determine how much liquidity had recovered. He pointed to the damage caused by the October 2025 deleveraging event, when an estimated $10 billion to $20 billion in leveraged positions were erased and Bitcoin’s top-of-book depth on major venues fell by more than 90% intraday.

    According to Sticco, market makers subsequently reduced resting liquidity after being left with inventory while hedges were force-closed. That left order books at their thinnest levels since 2022.

    Sticco said the institutional side of the cryptocurrency market had therefore developed faster than the liquidity supporting the underlying market.

    U.S. policy and Treasury conditions contribute to the crypto rally

    Macroeconomic conditions have also played an important role in the latest advance, according to Sticco. He identified the U.S. Treasury’s Aug. 19 decision to increase long-dated debt buybacks as an important catalyst.

    The Treasury doubled the maximum size of certain long-end liquidity-support buybacks from $2 billion to at least $4 billion per operation. The announcement was followed by falling long-term yields and an 8.2% Bitcoin advance from an intraday low near $64,100 to approximately $69,500 in less than 12 hours.

    Sticco said Bitcoin’s close relationship with software stocks during the move showed how closely cryptocurrency had become linked to U.S. macroeconomic conditions. As interest-rate expectations later changed and short-term yields rose, Bitcoin surrendered some of its gains even though the legislative situation in Washington had not materially changed.

    Congress represents another variable for U.S. investors. Sticco pointed to the CLARITY Act, which would establish a statutory division of responsibilities between the SEC and CFTC for parts of the digital asset market. The legislation would also create a federal framework affecting exchanges, brokers, dealers and custody services.

    The Senate Banking Committee advanced the legislation by a 15-9 vote in May, with Democratic Sens. Ruben Gallego and Angela Alsobrooks joining Republicans. Sticco, who attended the markup as part of Cryptex’s policy work, said both Democrats made clear at the time that their committee votes did not guarantee support on the Senate floor without progress on unresolved provisions.

    A Sept. 15 cloture vote requires 60 votes to move the legislation forward. Previous coverage of the negotiations identified ethics rules, stablecoin rewards and financial-crime provisions as issues that remained unresolved ahead of the procedural vote.

    For regulated index products, Sticco highlighted provisions covering CFTC registration for digital commodity exchanges, brokers and dealers. He said capital, asset-segregation, surveillance and customer-protection requirements could increase the number of regulated venues capable of supporting assets used in exchange-traded products.

    Sticco also cited custody provisions and changes affecting financial holding companies as potentially important for institutions. He argued that statutory classification of digital assets would give index providers greater certainty than relying on agency interpretations that future regulators could change.

    Policy expectations have weakened even as cryptocurrency prices have risen. Sticco said Polymarket odds for the CLARITY Act becoming law in 2026 had fallen from approximately 82% in February to around 25% in late August, while Galaxy Research placed the probability closer to 10%.

    The Sept. 15 vote will also take place on the first day of the Federal Reserve’s Sept. 15-16 meeting, putting two major U.S. policy events in the same period.

    According to Sticco, unresolved Senate negotiations include ethics and conflict-of-interest rules involving government officials, possible secondary enforcement authority for state attorneys general, illicit-finance provisions and banking-industry objections to crypto exchanges paying yield on stablecoin balances.

  • Should CASHCAT Traders Expect a Major Price Correction Soon?

    Should CASHCAT Traders Expect a Major Price Correction Soon?

    $CASHCAT’s recent price rally faced significant profit-taking after the altcoin reached an all-time high of around $0.254 on August 26. The pullback pushed the token’s 24-hour losses to 12.52%, while trading volume declined 18.43% to $64.79 million.

    The combination of falling price and lower volume suggests that market participation weakened during the correction rather than traders rushing to exit their positions. However, $CASHCAT still gave back part of its recent gains, leaving buyers responsible for defending the post-rally structure.

    Altcoin weakness adds pressure to $CASHCAT

    Broader market conditions also contributed to the weakness. The Altcoin Season Index fell to 35 from a level closer to 50, signaling a shift in investor sentiment and reduced appetite for broader crypto risk.

    At the same time, the Bitcoin Season Index rose sharply, indicating that capital was moving away from altcoins and toward Bitcoin exposure. This created a less favorable environment for speculative assets following their recent rapid gains.

    The Altcoin Season Index remained above 25, the level associated with deeper Bitcoin Season conditions. As a result, $CASHCAT’s correction occurred amid weakening altcoin momentum rather than a complete loss of speculative market interest.

    The same shift was visible in derivatives markets, where traders gradually reduced leveraged positions after the rally.

    Leverage retreats as funding premium collapses

    Open interest fell 3.32% to $62.67 million as derivatives traders reduced their outstanding $CASHCAT positions. Funding rates recorded a substantially sharper adjustment.

    The open-interest-weighted funding rate had climbed toward 0.33% during the rally, but fell back to 0.0077% by August 28. Although the funding rate remained slightly positive, its sharp decline pointed to weaker demand for leveraged long exposure.

    The decline in open interest occurred alongside the funding reset rather than an increase in speculative positioning. This suggests that traders were unwinding leverage as $CASHCAT moved away from its peak.

    That deleveraging removed some of the excess positioning built during the price advance. However, the reduction in leveraged participation also removed part of the demand that had helped fuel the rally.

    The next price reaction will determine whether this deleveraging marks a healthy cooling phase or develops into a broader structural reversal.

    Can $0.19768 support contain the correction?

    $CASHCAT retreated after resistance near $0.254 rejected the latest advance, bringing the $0.19768 support level into focus. The altcoin was trading at approximately $0.21651 at press time.

    Buyers had previously reclaimed $0.19768 before launching the final move toward the $0.254 zone. A successful defense of this level could therefore preserve the broader recovery structure despite continued profit-taking from short-term traders.

    Technical indicators have also cooled alongside the price. The Relative Strength Index briefly reached the overbought 70 level before falling to 65.51.

    The MACD remained bullish at 0.02904, but the shrinking positive histogram bar showed that bullish momentum was fading as sellers interrupted the advance.

    A successful defense of $0.19768 would keep the $0.254 level in view for another potential test. A break below that support, however, could increase downside pressure toward the broader $0.08907 support area.

    Source: CoinMarketCap

    Source: CoinGlass

    Source: TradingView

    Key takeaway

    $CASHCAT’s rally is losing momentum as profit-taking, declining trading volume, and reduced leverage weigh on demand. Holding the $0.197 support area could help preserve the recovery, while a breakdown would raise the risk of a deeper decline.