Tag: 000 target

  • Bitmine Chairman Tom Lee Reveals New Bitcoin and Ethereum Price Predictions

    Bitmine Chairman Tom Lee Reveals New Bitcoin and Ethereum Price Predictions

    Bitmine Chairman Tom Lee says Ethereum is undervalued relative to Bitcoin and could rise to $6,000 if Bitcoin surpasses $150,000. He believes Ethereum has substantial upside potential in the months ahead.

    Regulation and institutional demand could support Ethereum

    Lee identified several factors that could drive Ethereum’s value higher for the rest of the year. One of the most significant is the potential passage of the CLARITY Act, a comprehensive US regulatory framework for the cryptocurrency market.

    According to Lee, clearer regulations could make it easier for institutional investors to enter the crypto market. The return of capital that has been held back from crypto assets could also provide additional support for prices.

    He also pointed to rising capital inflows from Asia and “compensatory purchases” of crypto assets by global institutions seeking to improve their quarterly performance as potential tailwinds for Ethereum.

    Ethereum-to-Bitcoin ratio could recover

    Lee said the $ETH/BTC ratio, which tracks Ethereum’s performance against Bitcoin, could retest its previous level of 0.08. Even in a more cautious scenario, he said a recovery to 0.04 would give Ethereum significant upside potential.

    Although Lee continues to see long-term upside potential for Bitcoin, he expects asset tokenization and AI-powered finance to be among the key forces shaping the cryptocurrency market over the next five years.

    Tom Lee’s outlook supports expectations that the performance gap between Bitcoin and Ethereum could narrow. Investors are expected to closely monitor how institutional capital flows affect Ethereum in the coming period.

    If Bitcoin reaches $150,000, Ethereum’s move to $6,000 would represent a substantial increase from current price levels. However, that scenario depends on Bitcoin exceeding the $150,000 threshold and Ethereum attracting the anticipated capital inflows.

    This is not investment advice.

  • Solana Price Prediction: Is SOL Ready for Its Next Big Rally?

    Solana Price Prediction: Is SOL Ready for Its Next Big Rally?

    Solana is showing early signs of a potential trend reversal after reclaiming the $100 level. Improving weekly momentum indicators and long-term cycle analysis suggest that $SOL may be emerging from a prolonged bottoming phase, although confirmation still depends on establishing a sustained pattern of higher highs and higher lows.

    Solana Long-Term Cycle Chart Projects a Potential Move Toward $1,000

    Solana’s broader market structure may be shifting from accumulation and manipulation toward a potential expansion phase. CryptoCurb’s analysis projects a long-term move toward $1,000 if the current bullish setup continues to develop.

    Solana $SOL $1,000 Market Cycle Projection. Source: CryptoCurb (@CryptoCurb) on X

    The weekly $SOL/USDT chart divides the market into three phases: accumulation, manipulation and distribution. The accumulation zone covers much of 2024 and 2025, when $SOL traded within a broad range after recovering from earlier cycle lows.

    The chart identifies the decline into 2026 as a manipulation phase. During that period, $SOL fell below the lower boundary of its previous range before stabilizing near $100. CryptoCurb’s thesis is that the breakdown represents a shakeout rather than the beginning of another extended bearish cycle.

    The immediate technical challenge is a sustained recovery above the lower section of the former trading range. With $SOL shown near $104, the area between roughly $110 and $120 represents an important initial resistance zone. A decisive reclaim of that range would strengthen the argument that the breakdown has failed and that Solana is moving back toward an expansion phase.

    Beyond that point, the projected path becomes significantly more aggressive. The chart shows $SOL potentially rising toward approximately $600, correcting into the mid-$400s and later extending toward $1,000 around 2028.

    However, the $1,000 level remains a speculative long-term scenario rather than a confirmed price target. The chart does not establish that level through a measured move or another independent technical calculation. The bullish outlook therefore depends first on $SOL reclaiming its former range and later breaking above the major highs established during the 2024-2025 structure.

    $SOL Weekly Chart Shows Bullish Divergence and New Buy Signals

    A second weekly chart from Jesse Olson supports the shorter-term reversal case. It shows improving momentum, a strong weekly candle and several bullish technical signals.

    Solana $SOL Weekly Bullish Reversal Signals. Source: Jesse Olson (@JesseOlson) on X

    The Kraken $SOL/USD chart shows $SOL at $105.06 after opening the week at $95.41, reaching $110.61 and trading as low as $93.27. At the time shown on the chart, the token had gained approximately 10.1% for the week.

    Olson highlights a series of bullish signals, including bullish divergence, a buy signal, an RSI-related buy signal and a newly printed green trending dot. The green dot is notable because it follows an extended sequence of bearish trend markers, suggesting that momentum conditions may be changing.

    Solana’s price has also moved above a visible reference level near $97.72 and is testing the $105-$110 area. A clean move above that zone would improve the short-term market structure and raise the probability of a higher high.

    The next confirmation would be the formation of a higher low after any pullback. Together, a higher high and higher low would provide stronger evidence that $SOL is transitioning from a downtrend into a developing uptrend instead of staging another temporary relief rally.

    The chart also identifies a lower reference near $76.77, which serves as an important invalidation level for the developing bullish structure. A sustained move below that area would weaken the reversal thesis.

    Above the current price, the visible volume profile indicates further resistance around $115-$125, followed by a heavier supply zone near $145-$150. Clearing those levels would offer stronger technical confirmation that Solana’s bottoming process has developed into a broader recovery.

  • Bitcoin’s Failed $81,000 Breakout Puts $75,000 Back on the Table

    Bitcoin’s Failed $81,000 Breakout Puts $75,000 Back on the Table

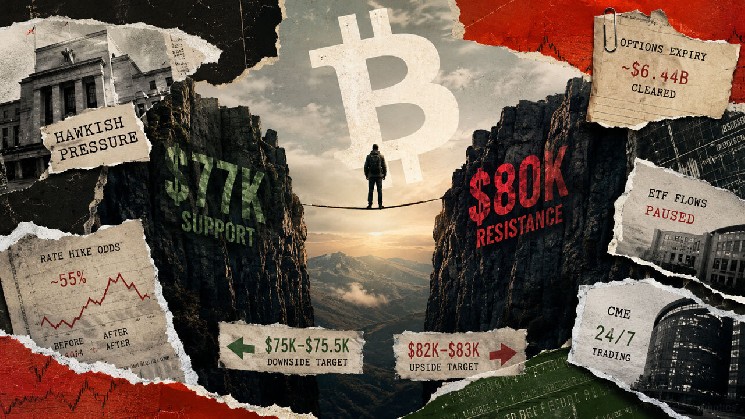
    Bitcoin is trading near $78,000 heading into the weekend, positioned between support at $77,000 and resistance at $80,000 after a sharp rejection above $81,000 on Aug. 28.

    A confirmed break below $77,000 could expose the mid-$75,000s. Conversely, a sustained move back above $80,000 would bring Bitcoin’s Aug. 28 high near $81,300 and the $82,000–$83,000 zone back into focus.

    Bitcoin Reverses After Jackson Hole Rate Shock

    Bitcoin reversed from its Aug. 28 intraday high after Kevin Warsh’s Jackson Hole remarks pushed the probability of a September rate hike to around 55%, up from roughly 40% before the speech. Warsh said the Fed still had work to do if inflation failed to return toward its target.

    The resulting repricing pushed Bitcoin back below $80,000 by the close. A level buyers had briefly reclaimed turned into resistance, leaving $77,000 as the immediate level traders must defend.

    Friday’s Bitcoin Options Expiry Removes a Major Market Anchor

    Approximately 81,700 Bitcoin options worth about $6.44 billion expired on Deribit Friday at 08:00 UTC. The expiry removed a positioning cluster that had helped anchor Bitcoin near key strike prices throughout the week.

    Calls outnumbered puts by a ratio of 0.83. The largest concentration of call open interest was around $75,000 and $80,000, the same two levels now defining the weekend’s downside and upside scenarios.

    U.S.-traded spot Bitcoin ETFs recorded nine consecutive days of net inflows through Aug. 27, totaling roughly $3 billion. That source of demand pauses over the weekend because ETF creation and redemption activity follows the same weekday schedule as U.S. equity trading.

    CME shifted to 24/7 trading in late May, with only a weekly maintenance window interrupting the schedule. Regulated institutional derivatives can now respond directly to Saturday and Sunday price moves, well before the Sunday evening Globex reopening that previously marked the return of futures activity.

    As a result, Bitcoin enters the weekend with one of its strongest recent demand channels offline while the market that once remained largely dormant is still fully active.

    Key Bitcoin Price Levels Traders Are Watching

    Above the current price, $80,000 is the key trigger. A sustained reclaim would suggest that buyers absorbed the Aug. 28 hawkish shock and turned the failed breakout into a bear trap.

    That move could open a path toward the Aug. 28 high near $81,300 and then toward the $82,000–$83,000 zone, where fresh options positioning overlaps with technical resistance.

    Below the market, $77,000 plays the same role in reverse. Bitcoin’s Aug. 28 low was printed near $77,078. A loss of that level followed by sustained acceptance below it over several hours would shift the setup from consolidation toward continued downside.

    The initial target would be $75,000–$75,500, an area that already carries heavy options interest from the Aug. 28 expiry.

    A deeper break below $75,000 could expose the low $70,000s, with $72,000–$73,000 emerging as the next significant target if selling pressure holds. The $69,000–$70,000 region remains a longer-term support zone.

    Reaching that area over a single weekend would likely require a larger liquidation event or an additional macroeconomic shock beyond the Aug. 28 repricing.

    Bitcoin Price Targets From Citi and Bernstein

    Citi cut its 12-month Bitcoin target to $82,000 from $112,000 in July, reduced its ETF inflow assumption to zero, and placed its recession-driven bear case near $53,000. That makes the weekend’s $82,000–$83,000 upside zone notable in its own right because it now overlaps with a major bank’s full-year base case from only eight weeks ago.

    Bernstein’s longer-term outlook is far above the levels relevant to this weekend. The bank has pointed toward $150,000 by mid-2027 and as high as $500,000 in a debasement-driven bull case.

    That forecast applies to an entirely different timeframe and provides context for where Bitcoin could trade over the coming years.

    Bitcoin Bull and Bear Cases for the Weekend

    The bullish scenario has Bitcoin reclaiming $80,000 and clearing the Aug. 28 high. CME’s continuous futures market could reinforce that move through the weekend even without support from ETF flows.

    Under that path, $82,000–$83,000 becomes the next major test, while the failed breakout above $81,000 could be interpreted as a shakeout within an intact uptrend.

    The bearish scenario has Bitcoin losing $77,000 and establishing genuine acceptance below the level, forcing out buyers who chased the move above $80,000 earlier in the week.

    In that case, $75,000–$75,500 would become the immediate target. A further breakdown there could open $72,000–$73,000 as the market prices in a correction that has grown beyond the Aug. 28 single-day rate shock.

    Bitcoin’s next major move could be decided before U.S. ETF desks reopen Monday, with regulated futures now trading continuously through the weekend.